J. Cent. South Univ. Technol. (2009) 16: 0663-0668
DOI: 10.1007/s11771-009-0110-7

Failure mode and strength anisotropic characteristic of stratified rock mass under uniaxial compressive situation
LU Guang-yin(鲁光银), ZHU Zi-qiang(朱自强), LIU Qun-yi(柳群义), HE Xian-qi(何现启)
(School of Info-physics Engineering, Central South University, Changsha 410083, China)
Abstract: A stratified rock mass model was founded by FLAC3D. The failure mode and anisotropic characteristic of strength for stratified rock mass were analyzed. The analysis results show that the numerical simulation can visually reflect the failure modes of rock samples under different inclination angles β of structural plane. The stiffness of rock sample before peak strength changes in the compressive procedure. With the increase of β, the compressive strength σc of rock sample decreases firstly and then increases; when β is in the range of 20?-30? and 80?-90?, σc has the largest sensitivity to β; while β falls in the range of 30?-70?, σc varies little. When  j<β<90?. (φj is friction angle of structure plane), the results obtained from numerical simulation and theoretical analysis are in almost the same values; while β≤j or β=90?, they are in great different values. The results obtained from theoretical analysis are obvious larger than those from numerical simulation; and the results from numerical simulation can reflect the difference of compressive strength of rock samples for the two situations of β≥φj and β=90?, which is in more accordance with the real situation.
Key words: stratified rock mass; failure mode; strength; anisotropic characteristic; numerical analysis
1 Introduction
Stratified rock mass widely exists in geotechnical engineering, and its compressive strength is the main parameter in engineering design. With obvious transversely isotropic characteristic, strength of stratified rock mass is not only related to strength of intact rock but also to the inclination and characteristic of structure plane. Under different stress conditions, failure of rock mass will generate along structure plane or in the intact rock depending on the combination of major stresses and structure plane inclination, which in turn lead to different mechanical characteristics of the whole rock mass [1]. In the past, studies for this type of rock mass were mainly done by theoretical method [2-3] and laboratory test [4-7]. The theoretical method can reflect the main principle of rock mass, but it can only be applied to analyzing the problem with simple geometry; while laboratory test method costs much expense. Recently, with rapid development of computer technique, numerical simulation methods have been widely applied to engineering [8-9], which explores a new way for geotechnical design. These methods can simulate geo- models with complicated geometry, obtain stress―strain relationship and failure modes by the integral effect ofresponse in micro-unit according to the classical mechanical theories. Among all the numerical simulation methods, fast Lagrangian explicit finite difference method (FLAC3D) is widely used to solve practical problems, especially in field of elasto-plastic characteristic, large deformation analysis and construction procedure. So in this work, numerical simulation for the failure mode of stratified rock mass under axial compression was done by FLAC3D, and results of simulation were compared with those of theoretical analysis, which could give further guidance to understand the anisotropic characteristic of stratified rock mass.
2 Theoretical analysis for failure mechanism of stratified rock mass
Suppose that failure of stratified rock mass is in accordance with Mohr-Coulomb criterion, and then according to the stress distribution of rock unit (Fig.1), the following equation can be obtained:
 (1)
(1)
 (2)
(2)
When failure takes place along structure plane, the

Fig.1 Analytical calculation model: (a) Stress; (b) Stress decomposition
major stresses should meet the following relationship:
 (3)
(3)
where cj and  are the cohesion and friction angle of structure plane, respectively; β is the inclination angle of structure plane.
When σ3 is fixed to be constant, stress deviation (σ1-σ3) will vary with β. When β→90? or β→, and (σ1-σ3)→∞, σ1 will be infinitely increased while structure is parallel to σ1 or the angle between normal direction of structure plane and σ1 equals , which will never lead to the failure of rock mass. But this situation does not exist in fact, so the failure along structure plane can only occur under the condition of <β<90?; while under other conditions, the failure occurs in both intact rock and structure plane. At this time, major stresses meet the following relationship with the fact that cohesion and friction angle of intact rock are larger than those of structure plane,
 (4)
(4)
where  =
= ; cr and
  are the cohesion and friction angle of intact rock, respectively.
From Eqn.(4), it can be found that the compressive strength of rock mass is the same for the situation of β≤ and β=90?.
3 Numerical simulation model and calculation method
3.1 Numerical model
In the numerical model, there exists a set of preferred structure plane, which is considered as weakness plane. The intact rock and structure plane are simulated by block element, which are treated as the continuous medium and only differ from each other in material parameters. The radius of rock sample is 1 m, with a height of 4 m. Inclination of structure plane is β (whose values vary in the range of 0?-90?, with a gradient of 10?), the thickness of structure plane is 0.15 m (the main purpose of this work is to study the failure mode of stratified rock mass, although the thickness of structure plane influences the compressive strength of rock mass, the trends of strength with different β remain the same no matter what the thickness is; while taking in consideration of calculation time, 0.15 m is chosen), spacing of structure plane is 0.15 m. The three dimensional calculation model is founded by FLAC3D (Fig.2) with the help of self-compiled ANSYS-FLAC3D interface program. The velocity of 2.0×10⁻³ mm/step is chosen as the loading mode. During calculation, relationships between stress and displacement of sample’s upper boundary are recorded. Calculation parameters are shown in Table 1, where γ is unit weight, E is elastic modulus, υ is Poisson ratio, c is cohesion, is friction angle, ψ is dilation angle, and σt is tensile strength.

Fig.2 Numerical calculation model
Table 1 Calculation parameters for simulation model

3.2 Numerical treatment method for describing strain-softening characteristic
Cohesion, friction, dilation angle and tensile strength may soften after the onset of plastic yield, and they can be defined as piecewise-linear functions of a softening parameter measuring the plastic shear strain. The code measures the total plastic shear and tensile strains by incrementing the softening parameters at each time step, and causes the model properties to conform to the user-defined functions. This model is based on the FLAC3D Mohr-Coulomb model with non-associated shear and associated tension flow rules.
Two hardening parameters for this model, ks and kt, are defined as the sum of some incremental measures of plastic shear and tensile strain for the zone, respectively. The zone-shear and tensile hardening increments are calculated as the volumetric average of hardening increments over all tetrahedra involved in the zone [10]. The shear-hardening increment for a particular tetrahedron is a measure of the second invariant of the plastic shear-strain increment tensor for the step, given as
 (5)
(5)
where  is the volumetric plastic shear strain increment,
  =(
=( +
+ )/3; and are respectively the plastic shear strain increments in the first and the third major direction, which can be obtained as
 (6)
(6)
 (7)
(7)
where  ;
;
Nψ=(1+sinψ)/(1-sinψ); α1 and α2 are calculated by the shear modulus G and bulk modulus K, α1=K+4G/3, α2=K-2G/3; and
and are the test stress in the calculation procedure.
The tetrahedron tensile-hardening increment is the magnitude of the plastic tensile-strain increment  :
:
 (8)
(8)
3.3 Calculation parameters
According to the advices of FLAC3D and rock mass characteristic, the corresponding parameters of cp,  and ψp have the relationship with initial ci,
  and ψi: cp=wcci; =-
 ; ψp=ψi-wψ; where wc, and wψ are the variation factors of cohesion, friction angle and dilation angle. The relationship between wc, , wψ and plastic strain εp is shown in Table 2.
Table 2 Relationship between wc, wφ, wψ and εp

4 Results and discussion
4.1 Deformation analysis
Fig.3 shows the failure modes of samples. When β=0?, tensile failure takes place in the middle of sample, which is brittle failure caused by derived tensile stress induced from internal material. The failure direction is perpendicular to that of the maximum tensile stress. When tensile failure plane generates, shear stress and tensile stress of rock material below structure plane will reduce to zero, which in turn lead to a gradual increase of areas of tensile failure plane; and axial splitting takes place in the sample [11-12]. When β=10?, shear failure will occur in the upper part of rock sample, shear planes consist of structure and non-structure planes, among which non-structure shear failure is the compound failure cutting through both structure plane and intact rock. When β=20?-60?, rock sample will slip along one or two sets of structure plane (30?), with the reason that shear stress surpasses the shear strength along structure plane. When β=70?-90?, the shear failure along structure does not continue, and is replaced by the tip-tilt failure of the whole sample, with expansion failure in the bottom. The reason for this phenomenon is that the whole sample cannot slip while some structure planes are supported by bottom boundary, and shear band exists in the place of each structure plane, because the loading on rock sample surpasses its critical strength, and causes plastic flow. At the moment, rock sample loses its capability of loading, and in the last, it crushes with unlimited deformation until final disintegration instead of brittle failure under the boundary restriction.
4.2 Relationship between stress and displacement
Fig.4 shows that, the slopes of curves before reaching peak value vary at the early loading stage, which indicates variation of samples’ stiffness. With the increase of β, the slopes of curves first decrease and then increase. During loading procedure, failure modes consist of slipping along structure plane, cutting through structure and intact rock, which causes the resisting force of sample reaching the maximum value. With differential values of β for each sample, the peak strength is different.
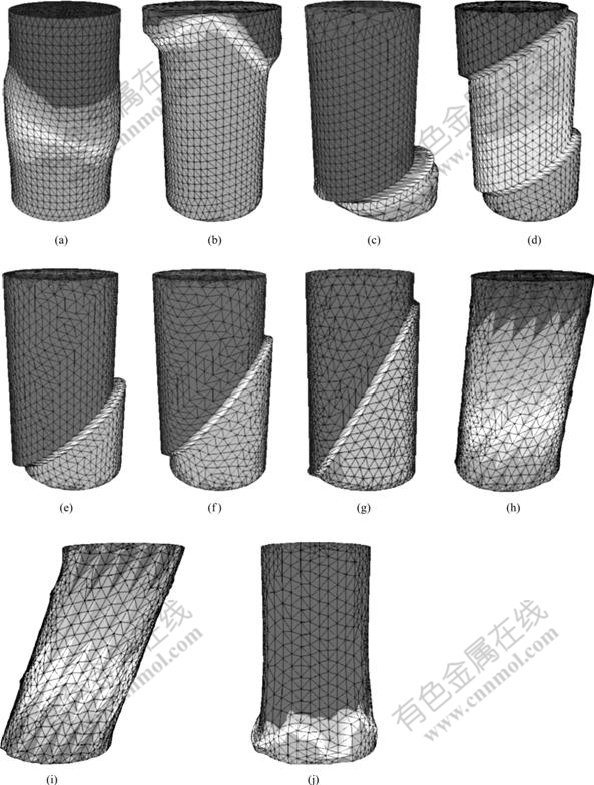
Fig.3 Failure modes of stratified rock mass with different values of β: (a) 0?; (b) 10?; (c) 20?; (d) 30?; (e) 40?; (f) 50?; (g) 60?; (h) 70?; (i) 80?; (j) 90?
When comparing curves of 0?, 90? with others, it can be found that there exists extremum in these two curves, which indicates the brittle failure characteristic resulted from axial splitting through structure plane and intact rock. While other rock samples slip along structure plane or certain plane in intact rock after they reach peak strength, and then dilation takes place and rock sample shows some degree of ductile failure. After reaching peak strength, rock samples go into the stage of residual strength. When comparing curves of 20? and 80?, we can find that there exists obvious difference in peak strength for two samples, but residual strength is almost the same,

Fig.4 Relationship between stress and displacement of rock samples with different values of β: 1―0?; 2―10?; 3―20?; 4―30?; 5―40?; 6―50?; 7―60?; 8―70?; 9―80?; 10―90?
which indicates that the larger the β, the smaller the difference between peak strength and residual strength. Therefore, the samples show typical characteristic of frictional structure. In addition, the declining of stress (20?-80?) can be observed in the curves, which is caused by the axial split. And stress rebounds which are caused by the release of elastic deformation energy.
4.3 Impact of inclination of structure plane on strength
β has great impact on the strength of rock samples, for the reason that failure of rock sample is mainly caused by the characteristic of structure plane under different stress fields. At the moment of failure, great deformation occurs, which will lead to great tensile and shear stress. Fig.5 shows that, with the increase of β, compressive strength of rock sample first decreases and then increases. There exists the worst inclination causing the minimum compressive strength, which is 60? in this work and in accordance with results from tests [5-6]. The curve shows in shape of ‘shoulder’, higher at both sides and lower in the middle. When β locates in the range of 20?-30? and 80?-90?, the variation gradient will be the largest, 1.744 6 MPa/10? and 3.415 9 MPa/10?, respectively, which shows that σc has the largest degree of sensitivity to β; and when β locates in the range of 30?-70?, σc will vary little. When comparing numerical result obtained from FLAC3D with that from theoretical deduction in Section 2 of this paper, we can see that, when <β<90?, their differences are small because the failure mode is slipping along structure in both methods, which is in accordance with the hypothesis of theoretical analysis. When β≤ or β=90?, the differences are great, showing that theoretical analysis gets much higher value than that of numerical analysis because the deduction only takes shear failure into consideration, instead of the compound failure mode like axial split; While numerical simulation method can reflect the whole procedure of deformation failure for rock samples and mechanical behavior. In addition, the result from theoretical analysis shows that compressive strength values for β≤ and β=90? are the same, but test results from Refs.[5-7, 13-15] show the differences of them, validating that the results from numerical simulation are in close accordance with the real situation. And numerical simulation is not the simple repeat of theoretical analysis.

Fig.5 Relationship between structural inclination and compressive strength
5 Conclusions
(1) When inclination of joint plane β=0?, tensile failure will occur in the middle of sample; when β=10? shear failure will occur along structure and non-structure plane; when β=20?-60?, shear failure will occur along one or two structure plane; and when β=70?-90?, the tip-tilt failure of the whole sample takes place with the expansion at the bottom.
(2) With the increase of β, the stiffness before peak strength shows the trend of first decreasing and then increasing. Curves for 0? and 90? show obvious extremum, which are the characteristics of brittle failure. The larger the β, the smaller the difference between peak strength and residual strength. There exist stress declining and rebound phenomena in each curve.
(3) With the increase of β, the compressive strength shows the trend of first decreasing and then increasing. There exists a worst inclination.
(4) Differences between numerical result and theoretical deduction are small under the same assumption, and result from numerical simulation can reflect the difference between the strength of β≤ and β=90?, which is in close accordance with real situation.
References
[1] LI Jiang-teng, CAO Ping. Mechanism analysis on pillar instability induced by micro-disturbance under critical condition [J]. Journal of Central South University of Technology, 2005, 12(3): 346-348.
[2] WANG C D, LIAO J J. Stress influence charts for transversely isotropic rocks [J]. Int J Rock Mech Min Sci, 1998, 35(6): 771-785.
[3] TIEN Y M, KUO M C. A failure criterion for transversely isotropic rocks [J]. Int J Rock Mech Min Sci, 2001, 38(3): 399-412.
[4] LI Jiang-teng, CAO Ping, YUAN Hai-ping. Testing study of subcritical crack growth velocity and fracture toughness of marble [J]. Journal of Coal Science and Engineering, 2005, 11(1): 23-25.
[5] TIEN Y M, TSAO P F. Preparation and mechanical properties of artificial transversely isotropic rock [J]. Int J Rock Mech Min Sci, 2000, 37(6): 1001-1012.
[6] TIEN Y M, KUO M C, JUANG C H. An experimental investigation of the failure mechanism of simulated transversely isotropic rocks [J]. Int J Rock Mech Min Sci, 2006, 43(8): 1163-1181.
[7] KWASNIEWSKI M A. Mechanical behavior of anisotropic rocks [M]. Oxford: Pergamon Press, 1993.
[8] XU Guo-yuan, YAN Chang-bin. Numerical simulation for influence of excavation and blasting vibration on stability of mined-out area [J]. Journal of Central South University of Technology, 2006, 13(5): 577-583.
[9] LIU Jin-zhi, WU Ai-xiang, YANG Bao-hua, JIANG Huai-chun. Dynamic experiment and numerical simulation of solute transmission in heap leaching processing [J]. Journal of Central South University of Technology, 2007, 14(6): 838-841.
[10] Itasca Consulting Group. Theory and background [Z]. Minnesota: Itasca Consulting Group, 2002.
[11] YOU Ming-qing. Strength and deformation failure procedure of rock samples [M]. Beijing: Geology Press, 2000. (in Chinese)
[12] XIAN Xue-fu. Failure mechanism of stratified rock mass [M]. Chongqing: Chongqing University Press, 1989. (in Chinese)
[13] YANG Xiao-li, YIN Jian-hua. Slope stability analysis with nonlinear failure criterion [J]. Journal of Engineering Mechanics, 2004, 130(3): 267-273.
[14] NIANDOU H, SHAO J F, HENRY J P, FOURMAINTRAUX D. Laboratory investigation of the mechanical behavior of Tournemire shale [J]. Int J Rock Mech Min Sci, 1997, 34(4): 3-16.
[15] DAVID C, MENENDEZ B, BERNABE Y. The mechanical behaviour of synthetic sandstone with varying brittle cement content [J]. Int J Rock Mech Min Sci, 1998, 35(6): 759-770.
(Edited by YANG You-ping)
Foundation item: Project (50099620) supported by the National Natural Science Foundation of China
Received date: 2008-09-16; Accepted date: 2008-12-25
Corresponding author: LIU Qun-yi, Doctoral candidate; Tel: +86-15874148675; E-mail: liuqunyicsu2009@126.com

