BGIDB: A fundus ground truth building tool with automatic DDLS classification for glaucoma research
��Դ�ڿ������ϴ�ѧѧ��(Ӣ�İ�)2018���9��
�������ߣ������� �ޱ��� ������ ���� ZHU Cheng-zhang(����) ŷ��ƽ��
����ҳ�룺2058 - 2068
Key words��glaucoma; image database; B-spline; disc damage likelihood scale (DDLS)
Abstract: Taking advantage of the new standard HTML5, we designed an online tool called a browser/server-based glaucoma image database builder (BGIDB) for the demarcation of the optic disk and cup��s ellipse-like boundaries. The B-spline interpolation algorithm is used, and a specially designed algorithm is proposed for classifying the disease grade according to the disc damage likelihood scale criterion, which is correlated strongly with the glaucoma process by quantity. This tool exhibits the best performance with a low overlapping error of 4.34% for the optic disk demarcation and 8.31% for the optic cup demarcation. It also has preferable time-consuming as compared to other tools and is a cross-platform system. This tool has already been utilized in building the ophthalmic image database in the cooperation of Center for Ophthalmic Imaging Research and The Second Xiangya Hospital.
Cite this article as: ZOU Bei-ji, GUO Yun-di, CHEN Zai-liang, HE Qi, ZHU Cheng-zhang, OUYANG Ping-bo. BGIDB: A fundus ground truth building tool with automatic DDLS classification for glaucoma research [J]. Journal of Central South University, 2018, 25(9): 2058�C2068. DOI: https://doi.org/10.1007/s11771-018-3895-4.

J. Cent. South Univ. (2018) 25: 2058-2068
DOI: https://doi.org/10.1007/s11771-018-3895-4

ZOU Bei-ji(�ޱ���)1, 2, GUO Yun-di(������)1, 2, CHEN Zai-liang(������)1, 2, HE Qi(����)1, 2, ZHU Cheng-zhang(����)1, 2, OUYANG Ping-bo(ŷ��ƽ��)2, 3
1. School of Information Science and Engineering, Central South university, Changsha 410083, China;
2. Center for Ophthalmic Imaging Research, Central South University, Changsha 410083, China;
3. The Second Xiangya Hospital, Central South University, Changsha 410011, China
 Central South University Press and Springer-Verlag GmbH Germany, part of Springer Nature 2018
Abstract: Taking advantage of the new standard HTML5, we designed an online tool called a browser/server-based glaucoma image database builder (BGIDB) for the demarcation of the optic disk and cup��s ellipse-like boundaries. The B-spline interpolation algorithm is used, and a specially designed algorithm is proposed for classifying the disease grade according to the disc damage likelihood scale criterion, which is correlated strongly with the glaucoma process by quantity. This tool exhibits the best performance with a low overlapping error of 4.34% for the optic disk demarcation and 8.31% for the optic cup demarcation. It also has preferable time-consuming as compared to other tools and is a cross-platform system. This tool has already been utilized in building the ophthalmic image database in the cooperation of Center for Ophthalmic Imaging Research and The Second Xiangya Hospital.
Key words: glaucoma; image database; B-spline; disc damage likelihood scale (DDLS)
Cite this article as: ZOU Bei-ji, GUO Yun-di, CHEN Zai-liang, HE Qi, ZHU Cheng-zhang, OUYANG Ping-bo. BGIDB: A fundus ground truth building tool with automatic DDLS classification for glaucoma research [J]. Journal of Central South University, 2018, 25(9): 2058�C2068. DOI: https://doi.org/10.1007/s11771-018-3895-4.
1 Introduction
Retinal fundus imaging is an important instrumentality for diagnosing ocular diseases such as glaucoma and diabetic retinopathy. Nowadays an increasing number of computer techniques are being applied to aiding doctors in analyzing retinal fundus images. In order to design and evaluate computer methods related to fundus image processing, ground-truth retinal images are required.
Glaucoma is a class of optic neuropathy associated with a real-time functional visual area disorder. It is the second leading cause of blindness in the world [1]. This disease is mainly caused by an irreversible degeneration of the optic nerve fibers, which leads to structural changes in the optic nerve head. The nerve head is composed of an elliptic region called the optic disk (OD) with a central depression called the optic cup (OC). In general, the vertical cup-to-disk diameter ratio (CDR) is an important indicator for determining glaucoma risk [2]. The higher the value of the CDR, the greater the possibility of the presence of glaucoma in an eye. Moreover, some other parameters related to the shape of the OD and OC, such as rim loss [3], intra-ocular pressure [4], and disc damage likelihood scale (DDLS) [5] are also notable for glaucoma analysis.
There are quite a few retinal fundus image databases that have been built by research institutes. The STARE [6] database is commonly used for blood vessel extraction, and several works have used this dataset for optic nerve head detection. The DRIVE [7] database has been mainly obtained from a diabetic retinopathy screening program and is actually used for the diagnoses of diabetic retinopathy. Some works based on DRIVE are focused on vessel segmentation [8, 9]. Similarly, the MESSIDOR [10] and DIARETDB1 [11] databases are also designed for the analysis of diabetic retinopathy. The RIM-ONE [12] database is utilized for testing the OC segmentation algorithm and consists of more than 100 high-resolution images and five manual reference segmentations of each one. ORIGA-light [13] and ACHIKO-I [14] are datasets used for OD and OC segmentation but are not publicly available. DRISHTI-GS1 [15] is good dataset comprising 50 images and is openly available to researchers.
Although there are a considerable number of fundus image databases in this research area, some of them have been closed for public and some are not yet available now. A few of the databases are still available online and are useful for research. However, they have been built for the creator��s specific research purpose and may be few in number or lack some parameters that other researchers require. In such cases, researchers sometimes wish to build their own database. They may require more images, aim at specific tasks and ethnic groups, or flexibly set more parameters like whether diseases exist and the exact value of some indicators. In cooperation with The Second Xiangya Hospital of Central South University, we intend to build a novel glaucoma fundus image database of Chinese people.
Manually demarcated images of the OD and OC that are used as the ground-truth are necessary for research involving glaucoma screening and diagnosis. However, the available commercial software is always designed for general use and is not quite convenient for specific tasks such as OD/OC demarcation. There are a few OD/OC demarcating tools with some shortcomings in the trade-off among the ease of use, ease of deployment, and accuracy. A good tool should be convenient for professional doctors, who are qualified for demarcation but not very good at using computer tools, as well as computer researchers. At the same time, the accuracy must be guaranteed.
In this study, we designed an online tool called browser/server-based glaucoma image database builder (BGIDB) for the building of a glaucoma image database. This tool is convenient in interactive demarcation and the related data recording. It is specially designed for professional doctors in the glaucoma field in order to quickly mark the boundary of the OD/OC smoothly. It is only necessary to draw 6 to 10 feature points around the OD or OC. The number of feature points depends on the number of irregular parts of the shape. The tool automatically generates a contour that fits the OD/OC shape in real time. With the use of canvas in HTML5, BGIDB is in browser/server (B/S) architecture that cross-platforms perfectly. This tool is designed using an open source framework, which means that it can be easily deployed with little cost. The B-spline [16] algorithm is clear and easy to re-implement. As compared with the existing tools, BGIDB could achieve a better accuracy for the same number of feature points drawn by the user and needs fewer feature points for a specific level of accuracy. In addition, this tool achieved better evaluation by the ophthalmologists.
In particular, a new parameter is in addition to this tool for the assessment of methods that try to quantify the progress of glaucoma. The parameter is DDLS [5] classification. It is automatically calculated according to the demarcated OD and OC. The DDLS is a new quantitative classification for estimating the extent of OD damage in patients with glaucoma. It is implemented by dividing the DDLS into 10 stages based on the OD/OC shape, or more precisely, the neuro retinal rim width for a given disc diameter [17]. The DDLS is used as a method for distinguishing between glaucoma and normal eyes, and it outperformed the CDR [18]. With better OD/OC demarcation performed by using the BGIDB, we can obtain a more accurate DDLS classification. Moreover, the DDLS classification of the BGIDB could also be directly applied to any OD and OC demarcated database and segmentation method without special adjustment, and thus, this tool can also be used in old glaucoma database update and clinical diagnosis assistance.
2 Related works
In glaucoma-related image demarcation, the manual drawing of ellipse-like boundaries to match the OD and OC region is challenging. The OD contour is not a standard ellipse. Drawing the contour directly is time-consuming and difficult. Fitting the contour automatically using some geometry is easy but may be questioned for the qualification as ground truth. Some works have been proposed or referenced in order to solve this issue.
The famous image-processing tool ImageJ [19] has been designed for general use. We can use it in two ways in order to draw the OD contour: by automatically connecting the adjacent points drawn by the experimenter with straight lines, or adjusting a circle to the OD region through Bessel curve control points. Although it is convenient to use, works such as post processing, data loading and saving, and database management for database building require other efforts to be made. It is not specially designed for OC and OD demarcation, the former specified method cannot be used to fit the smooth boundary well, and the latter method requires the user to pick control points outside the target curve, which is not convenient for doctors.
An interactive tool for optic disc and cup segmentation (DCSeg) is developed and used in building the RIM-ONE [12] database. At first, it uses an ellipse to fit the rim of the OD roughly and then divides the circle into 16 equal edges in order to convert it into a polygon. By dragging the vertices, users can obtain a shape that is closer to that of the OD area. However, fitting ellipse-like boundary with strait lines, some regions belonging to OD will be lost.
The marking tool in Ref. [15] is similar to DCSeg. Users are required to drag a circle to the OD area and then drag several free-to-move control points to match the exact shape. Subsequently, the image region is split into 80 equal angular sectors with respect to the disk center, and the average boundary is obtained by averaging the manual markings in the respective sector. More than 30 control points are directly connected in order to fit the OD/OC contour. The use of a greater number of control points provides a better result but is more time-consuming. The optimal number of control points is not known and may depend on the specific shape of the OD/OC area.
ORIGA-GT [13] matches the ellipse-like boundary by first using least-squares fitting method [20] to obtain a rough region of interest. The direct least square fitting algorithm [21] is then used to smooth the boundary. The resulting shape obtained on using ORIGA-GT is an ellipse, but the OD region is usually not a regular ellipse. A simple eclipse cannot describe the boundary of the disk, which has lesions, and its shape may be concave.
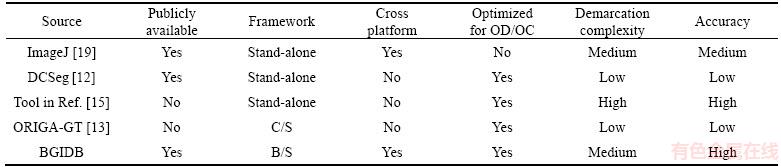
In summary, the existing methods for demarcating the OD/OC boundary have more than one of the following three shortcomings: low accuracy, complex operation, or difficulty in implementation. Furthermore, the tools now available online are all in the client/server (C/S) structure or stand-alone software and are not cross-platform friendly. In order to solve these problems, the tool designed in this study is easy to use and reproduce. The features of various tools used for OD and OC demarcation are shown in Table 1.
3 Tool design
Our objective is to simplify the operation as much as possible and to generate a contour by computer fitting the OD or OC edge sufficiently well.
Table 1 Features of tools used for OD and OC demarcation
3.1 Demarcation method
As the OD contour is not a standard ellipse, drawing the contour directly by hand is time- consuming and difficult. Fitting it automatically by using some combined geometry is straightforward but is not sufficiently convincing for gold standard use. Using a keyboard and mouse, the best method that a user can use to demarcate the boundary is to pick some key points on the boundary. Under the same accuracy, the number of key points should be as few as possible. In this regard, the interpolation curve algorithm is required.
Some more complex segmentation or approximation methods such as the active contour model [22] or even machine learning can also be used to achieve good accuracy. However, the direct use of these completely automatic methods may affect the doctor��s judgment. In addition, they need much more calculating pressure that may loss the requirement of real-time interaction. In practice, ophthalmologists are satisfied with the demarcation results obtained by using the cubic spline. We may consider combining these automatic methods with the interpolation algorithm in a local fitting instead of a global calculation in future works.
The interactive method of BGIDB, in this study, comprises the selection of key points one-by-one. The key points are manually selected without specific restriction. They can have the most prominent positions, vascular inflections, vascular crossing points, etc. whatever ophthalmologists think would better define the shape of the contour. After the first three points are selected, a smooth closed curve is automatically generated and changed in real-time according to the user��s operations. The curve is calculated by using the interpolation curve algorithm. Operations including adding, deleting, or moving a point can be executed.
3.2 B-spline
There are types of interpolation curve algorithms with different mathematical principles according to the different methods of controlling the key points. In order to improve the ease of operation for oculists, it is preferable to allow the shape of the contour to self-adjust locally, in other words, to fit some specially shaped area without affecting the global shape or other areas. In contrast, the result contour should be sufficiently smooth to approximate the OD/OC boundary well.
Considering that the quadratic spline is not sufficiently smooth while the interpolation curve algorithms such as the Bessel and Hermite curves [16] for the local shape adjustment are difficult to calculate, a better alternative that can solve these problems is required.
��B-spline�� is short for basis spline. The feature of B-spline is that the shape of the curve only changes along with the change in the adjacent control points. Thus, the B-spline curve is widely used in interactive free-form surface design [16].
B-spline is a good choice because of two reasons. Firstly, it facilitates local control over the shape of the spline curve. When we move a control point of a B-spline curve, only the area of the section between the last and the next control points is changed. The other areas remain unaffected. Secondly, because of its concise definition and ease of calculation, the code burden is sufficiently less then that it is easy to re-implement for secondary development. Some other cubic splines are also available, and their definition and effectiveness are not quite different from those of B-spline.
High-order splines have the disadvantage of high space complexity and difficulty in the setting of parameters, and thus, we select a closed cubic uniform B-spline curve as the interpolation algorithm.
3.3 Interpolation points�� calculation
The B-spline is defined by a series of control points such as the square points shown in Figure 1. In practice, using control points to fit the OD or OC is difficult for ophthalmologists. The ideal method is to pick feature points as interpolation points on the OD or OC contour directly, as represented by the round points in Figure 1.
Thus, it is necessary to calculate the control points by using directly marked interpolation points. For a closed three-uniform B-spline curve, the relationship between the interpolation points Vi and control points Pi is as follows [23]:
 (1)
(1)
The formula has n sub equations and n+2 unknowns. The boundary condition of the endpoints is required. In order to ensure the entire curve smoothness of the end-to-end stitching, P0=Pn and Pn+1=P1 are added. According to Ref. [23], we obtain the equation group for calculating the control points:
 (2)
(2)
There are n equations and n unknowns and such that the equations have a unique solution. According to the input of Vi (1��i��n), we obtain the control points Pi (0��i��n�C1). By defining P0=Pn and Pn+1=P1, we then obtain all the control points by solving the equations using the traditional math method.
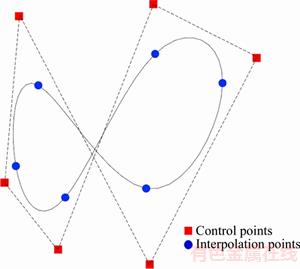
Figure 1 Control points and interpolation points in B-spline (Control points are the real control points of B-spline, and interpolation points are the points calculated from the control points on the curve in order to make the point picking easier)
3.4 Tool��s architecture in HTML5
When using the C/S architecture or stand- alone software, users are required to install a software as a client for local use. In the case of a complicated and different development environment in various operating systems, a perfect cross-platform is difficult to implement. In order to benefit from the new features in HTML5 and its widget canvas, we design the BGIDB with the B/S architecture. The backend of this tool is a traditional MVC frame that uses PHP, Apache, and MySQL. Controlling the front canvas widget in a web page by using JavaScript is the core feature for making the tool perfect cross platform. This means that this tool could be used in any present operating systems such as Windows or Ubuntu, or even mobile systems such as android and IOS. The main interface of the BGIDB is shown in Figure 2.
As shown in Figure 3, all the operation and calculation works are completed in a traditional web browser without any additional software or plug-ins.
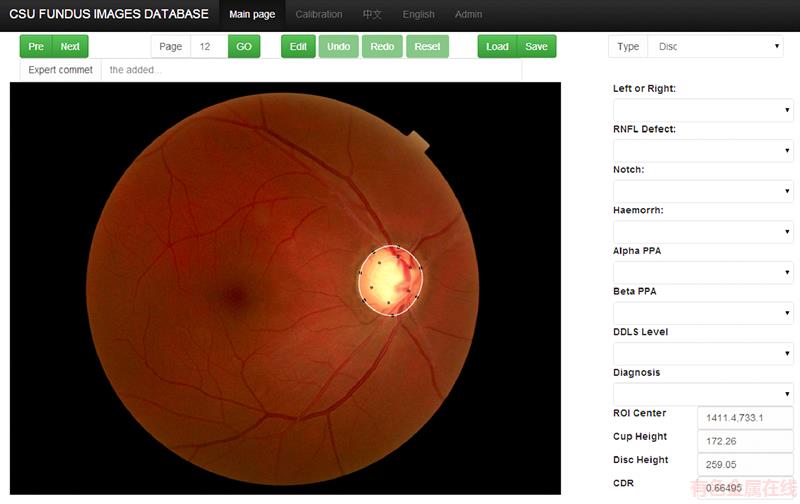
Figure 2 Main interface of BGIDB-tool for manual demarcation and calculation of related parameters or marking (Selecting image, editing, saving, parameters automatically calculating, and manual setting are allowed)
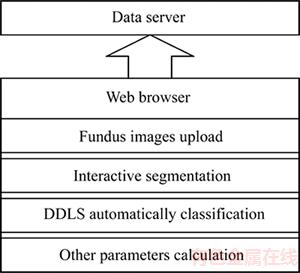
Figure 3 Tool structure (The data server saves the images, demarcated data, and related information; The web browser is the front end of the tool; All the image processing algorithms are conducted using JavaScript)
4 Automatic DDLS calculation
DDLS was proposed by SPAETH et al [5] in order to estimate the amount of OD damage in patients with glaucoma and has been verified to be more useful as a new quantitative analysis method against CDR [17, 18, 24]. In this section, we introduce the method for calculating the DDLS based on the OD and OC demarcation results. The DDLS is a disk damage indicator such as CDR. It is a better indicator that could be taken into consideration together with other indicators for diagnosing. It could reflect the process of glaucoma. A patient would have a greater value of DDLS than a normal person.
According to Ref. [17], the current DDLS definition is shown in Table 2. The fundus image is first divided into three types according to the OD diameter. In each type, if the radial width of the rim as compared to the diameter of the disc in the same axis is above 0 throughout the circumferential, the DDLS is defined as the minimal rim/disc ratio (RDR). Else, the DDLS is defined as the degrees in the circumferential extent where the RDR is 0. To obtain the disc diameter, we apply a simple vertical bounding box to the OD as shown in Figure 4. The thinnest width of the rim and rim loss are illustrated in Figure 5.
Table 2 DDLS definition [17]

4.1 Rim loss testing
We should determine if there is rim loss, which means that the location on the OD��s circumferential with RDR equals 0. We start from an arbitrary point on the OD��s circumferential and then travel through it pixel-by-pixel. As the image is composed of pixels that are not continuous as in the real world, at the 0 RDR site the pixel of the OC may not really touch the pixel of the OD. In order to deal with this situation, we define a threshold rlr such that if there are pixels no more than the rlr distance from any pixels on the OD��s circumferential that belongs to the OC, the fundus image is considered to have rim loss. The rlr value is not very strictly selected according to the image resolution. Here we consider that rlr=5, and 3�C10 are all feasible. The algorithm is shown in Algorithm 1.
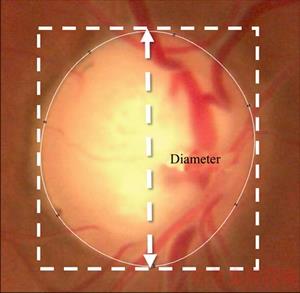
Figure 4 Bounding box used to obtain OD diameter
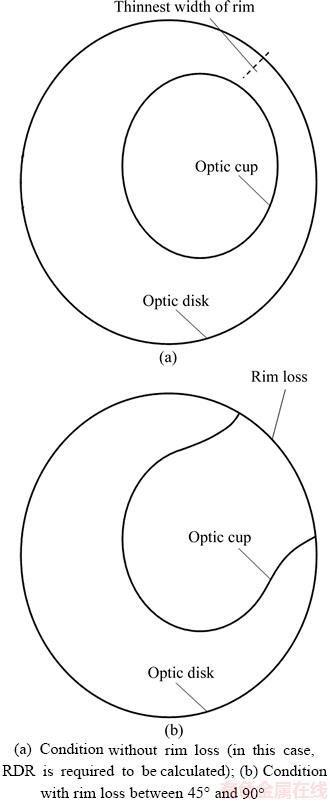
Figure 5 Sample of two DDLS stages:
Algorithm 1: RIM loss testing
for each pixel pa in OD��s circumferential do
for each pixel pb not farther than rlr from pa do
if pb belongs to OC then
return HasRimLoss
end if
end for
end for
return NoRimLoss
4.2 Rim loss degree
If there is rim loss, we need to calculate the rim loss degree in order to determine the DDLS. In order to calculate the degree around an irregular ellipse, we must first determine the geometric center of the OD. The geometric center of the OD gc is calculated by
 (3)
(3)
where n is the number of pixels on the circumference of OD, and pi is the coordinate of the ith pixel. To obtain the rim loss degree, we sum the degree of the central angle of the sector-like sections belonging to each rim loss range. The rim loss degree is then calculated as in Algorithm 2.
Algorithm 2: RIM loss degree
set retdegree = 0
for each interval it in OD��s circumferential and RDR=0 do
retdegree = retdegree + Degree(it.start, gc, it.end)
end for
return retdegree
In the above algorithm, Degree(A, B, C) represents the degree of  which is easily derived using geometric methods. A, B and C are three points that are the parameters of the function Degree().
4.3 Minimal RDR
If there is no rim loss, the minimal RDR is required. By visiting each pixel, e.g., pi on the circumference of the OD, we connect pi and gc as the diameter through this pixel. At this diameter, the distance from pi to the nearest pixel in the OC is the rim width of pi. If the diameter does not intersect with the OC, we simply consider the RDR of pi as 1.0. The algorithm is shown in Algorithm 3.
Algorithm 3: Minimal RDR
set retmRDR = 1
for each pixel pa in OD��s circumferential do
connect pa and gc as OD��s diameter d
set pc as the symmetry point of pa on d
for each pixel pb on d and inside OD from pa do
if pb belongs to OC then
pc = pb
BREAK
end if
end for
retmRDR = min(retmRDR; Length(pa; pc)=d)
end for
return retmRDR
4.4 Determine DDLS
As the DDLS definition, its determination comprises three steps. In the beginning, we classify the fundus into three types according to the OD diameter. Then a test is performed to determine whether there is rim loss. If there is rim loss, we calculate the rim loss degree in order to determine from DDLS 7�C10 if the OD diameter is smaller than 1.50 mm, 6�C10 if the OD diameter is in the range of 1.50�C2.00 mm, etc. If there is no rim loss, we calculate the minimal RDR. Then, we refer to the DDLS definition table in order to identify the exact stage.
5 Experiments
5.1 Data collective
We have tested our tool BGIDB by building a small glaucoma fundus image database with 50 images. The fundus images are obtained from the Ophthalmology Department of The Second Xiangya Hospital of Central South University. We specially selected 25 glaucoma fundus images and 25 healthy ones. They are all 2048��1536 images with 3 RGB channels taken by TOPCON TRC-NEW300.
5.2 Demarcation efficiency and accuracy
We compared our tool with two available tools ORIGA-GT [13] and the marking tool in Ref. [15]. The tool introduced in Ref. [15] is not given a specific name, and it is the tool used to build DRISHTI-GS, and thus, we will call it ��DGTool�� in the following.
To compare the three tools, a higher gold standard was first set by an ophthalmologist. Without any specific demarcation software to eliminate bias, the ophthalmologist directly draws the boundary of the OD and OC using a tablet pen. The tablet pen could be referenced in a product named ��Surface�� of the Microsoft Corporation. It is used like a real pen but on a tablet. During the processing, the picture is enlarged for the ophthalmologists to observe the details and directly draw the outline. This type of operation could be considered to be a pixel-by-pixel operation. In this manner, the best accuracy is achieved but in a time-consuming manner. This method could only be used for a small amount of gold standard to evaluate demarcation tools. The results are assessed by three ophthalmologists and are sufficiently precise to be considered a higher gold standard for evaluating the results of the three tools.
Subsequently, three ophthalmologists are required to demarcate 50 fundus images respectively using all the three tools. Because the ophthalmologists may become familiar with the character of the images leading to an unreasonable result, we conduct the experiment in three days. Each day only one tool is used, and the orders of the tools used through the days are different for the three ophthalmologists. In this case, the bias is reduced as much as possible. Two indicators are compared: 1) The average time is consumed to demarcate the OD/OC of one image of the three ophthalmologists while demarcating the 50 images in each manner. This indicator represents the efficiency of a tool. 2) The average accuracy of the results obtained by using the three tools is evaluated based on a higher gold standard, which was obtained by spending much more time. We use an overlapping error to evaluate the demarcation results:
 (4)
(4)
where S represents the demarcation result, and GS represents the gold standard. This formula indicates how accurate the demarcation result is, where OE=0 indicates perfect, and OE=1 indicates no overlap. This means that the less the OE is, the better the accuracy is achieved.
5.3 Results and discussion
As shown in Table 3, our tool BGIDB requires less time than DGTool to demarcate one image on average. OC is slightly difficult to mark because of its irregular shape and fuzzy boundary. Therefore, it usually takes more time to demarcate the OC.
Table 3 Average time consumed to demarcate by three tools
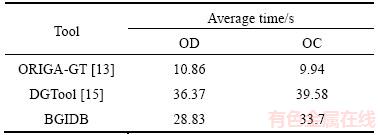
It is not strange that ORIGA-GT takes significantly less time. This is because ORIGA-GT uses a simpler model. The operation is to drag the mouse to fit the boundary with an ellipse. For this reason, the time cost of demarcating the OD and OC is similar on using ORIGA-GT. However, without further shape adjustment, some details are lost.
The DGTool is required to fit an ellipse first and then modify approximately 30 key points to achieve a sufficiently good demarcation goal. The first step takes time close to ORIGA-GT. The second step takes more time because the degenerated polygon requires finer adjustments.
With B-spline, the BGIDB only requires 6�C10 key points to fit the boundary. The exact number of points depends on the number of irregular parts of the OD/OC contour. Users can directly pick points on the aim contour and make some modifications after that. Thus, the BGIDB outperforms most irregular shape-fitting methods in terms of time- consumption.
The average accuracy calculated according to Formula (4) is shown in Figure 6. For the same reason that the OC has an irregular shape and fuzzy boundary, the overlapping error is usually higher than that of the OD. In this comparison, the BGIDB is found to be much more accurate than the two other tools.
Using a simple ellipse, ORIGA-GT cannot achieve a satisfactory result because the OD/OC boundary is usually not a regular ellipse. DGTool converts the shape into a polygon to easily adjust the boundary by dragging the vertices. Although DGTool is with several more key points than tools ever used, straight edges cannot fit a smooth boundary perfectly. An example of the demarcation results is shown in Figure 7.
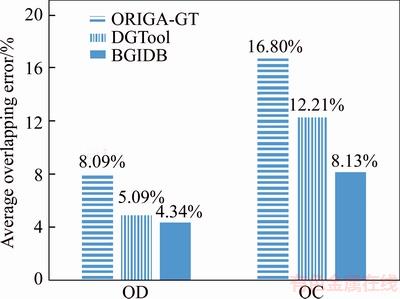
Figure 6 Average accurate results demarcated by three tools
In Figure 7, we observe that the result obtained on using the BGIDB is the closest to the gold standard. The ellipse boundary obtained for ORGIA-GT cannot cover some of the bulges. The polygon result obtained by DGTool is not as smooth as the interpolation method even when several more control points are used. With B-spline, the BGIDB is the most proximal to the gold standard with significantly fewer control points.
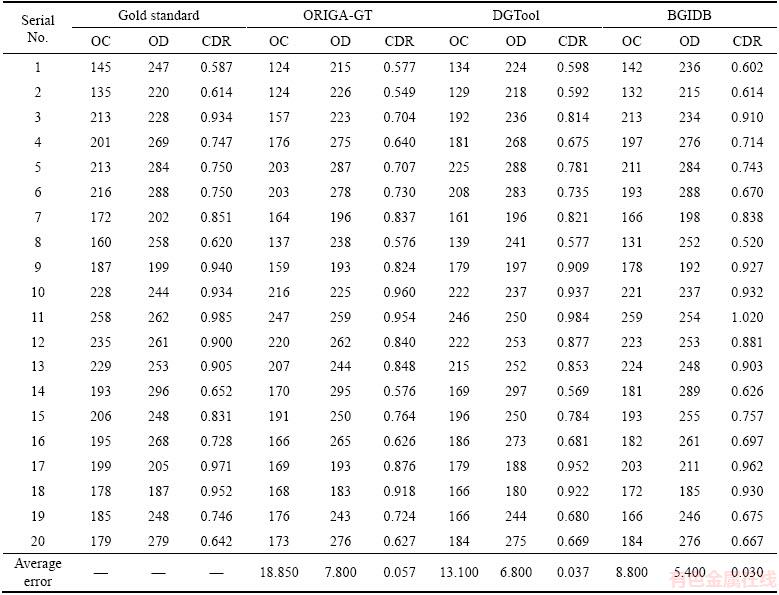
We know that the CDR is now the main evaluation criterion for glaucoma. In the field of glaucoma-related image-processing research, OD segmentation has been well studied. However, because of the low contrast of the OC in a fundus image, the OC segmentation is still an important research topic. In order to build a good image database of the OD and OC, the accuracy of the OD and OC is important. Apart from the overlapping error, we also compared the dimension results of the three tools in Table 4. 20 fundus images are demarcated, and the averaging absolute distance between the results of the tools and the gold standard is shown in the last line.
As shown in Table 4, the diameters of the OC and OD calculated from the demarcation result of the BGIDB are closer to the gold standard.
6 Conclusions
In this paper, we proposed a new tool BGIDB to aid researchers in building their own glaucoma image dataset. This tool is specially designed with the optimization of an interpolation algorithm for professional doctors, who are qualified for demarcation but not good at using computer tools, as well as computer researchers to quickly mark the boundary of the OD/OC smoothly. With the B/C architecture, this tool is well cross-platform. In particular, an automatic calculation of the DDLS is added to the tool, which makes the quantitative analysis more feasible. Moreover, this DDLS classification algorithm can also be directly applied to any OD and OC demarcated database and segmentation method without special adjustment, and thus, this tool can also be used in old glaucoma database updating and clinical diagnosis assistance.
In the future, we intend to add more glaucoma-related parameters to the tool and combine some automatic methods such as active contour along with the interpolation algorithm to allow the demarcated curve to better fit the OD/OC boundary.
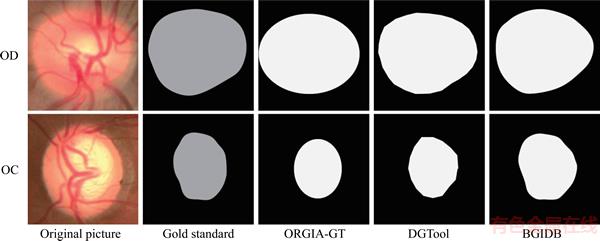
Figure 7 Visual comparison of demarcation results of three tools
Table 4 OC diameter (pixel), OD diameter (pixel), and CDR (ratio) results of three demarcation tools
Acknowledgements
This research used data collected from the Ophthalmology Department of the Second Xiangya Hospital of Central South University. The authors would like to acknowledge the clinicians who provided suggestions for the design of the tool and participated in the testing.
References
[1] PASCOLINI D, MARIOTTI S P. Global estimates of visual impairment: 2010 [J]. British Journal of Ophthalmology, 2012, 96(5): 614�C618.
[2] VEERASENTHILKUMAR G, VASUKI S, RAJKUMAR R. Optic disk and optic cup segmentation for glaucoma screening [J]. Artificial Intelligence and Evolutionary Algorithms in Engineering Systems, 2015, 325: 733�C744. DOI: 10.1007/978-81-322-2135-7_77.
[3] JONAS J B, FERN NDEZ M C, STURMER J. Pattern of glaucomatous neuroretinal rim loss [J]. Ophthalmology, 1993, 100(1): 63�C68.
[4] HOLLOWS F, GRAHAM P. Intra-ocular pressure, glaucoma, and glaucoma suspects in a defined Population [J]. The British Journal of Ophthalmology. 1966, 50(10): 570.
[5] SPAETH G L, HENDERER J, LIU C, KESEN M, ALTANGEREL U, BAYEKR A. The disc damage likelihood scale: Reproducibility of a new method of estimating the amount of optic nerve damage caused by glaucoma [J]. Transactions of the American Ophthalmological Society, 2002, 100: 181�C186.
[6] HOOVER A, GOLDBAUM M. Locating the optic nerve in a retinal image using the fuzzy convergence of the blood vessels [J]. IEEE Transactions on Medical Imaging, 2003, 22(8): 951�C958.
[7] STAAL J, ABR MOFF M D, NIEMEIJER M, VIERGEVER M A, GINNEKEN B V. Ridge-based vessel segmentation in color images of the retina [J]. IEEE Transactions on Medical Imaging, 2004, 23(4): 501�C509.
[8] ZHAO Y, RADA L, CHEN K, HARDING S P, ZHENG Y. Automated vessel segmentation using infinite perimeter active contour model with hybrid region information with application to retinal images [J]. IEEE Transactions on Medical Imaging, 2015, 34(9): 1797�C1807.
[9] AZZOPARDI G, STRISCIUGLIO N, VENTO M, PETKOU N. Trainable cosfire filters for vessel delineation with application to retinal images [J]. Medical Image Analysis, 2015, 19(1): 46�C57.
[10] ANTAL B, HAJDU A. An ensemble-based system for microaneurysm detection and diabetic retinopathy grading [J]. IEEE Transactions on Biomedical Engineering, 2012, 59(6): 1720�C1726.
[11] KAUPPI T, KALESNYKIENE V, KAMARAINEN J K, LENSU L, SORRI I, RANINEN A. DIARETDB1 diabetic retinopathy database and evaluation protocol [C]// British Machine Vision Conference 2007. UK: University of Warwick, DBLP, 2007.
[12] FUMERO F, ALAYON S, SANCHEZ J L, SIGUT J. Rim-one: An open retinal image database for optic nerve evaluation [C]// Proc 24th Int Symp. Computer-Based Medical Systems (CBMS). Bristol, United Kingdom, 2011: 1�C6. DOI: 10.1109/CBMS.2011.5999143.
[13] ZHANG Z, YIN F S, LIU J, WONG D W K. Origa-light: An online retinal fundus image database for glaucoma analysis and research [C]// Proc Annual Int Conf of the IEEE Engineering in Medicine and Biology. 2010: 3065�C3068. DOI: 10.1109/IEMBS.2010.5626137.
[14] YIN F, LIU J, WONG D W K, TAN N M. Achiko-i retinal fundus image database and its evaluation on cup-to-disc ratio measurement [C]// Proc IEEE 8th Conf Industrial Electronics and Applications (ICIEA). Melbourne, Australia, 2013: 224�C227. DOI: 10.1109/ICIEA.2013.6566370.
[15] SIVASWAMY J, KRISHNADAS S, CHAKRAVARTY A, JOSHI G D, UJJWAL. A comprehensive retinal image dataset for the assessment of glaucoma from the optic nerve head analysis [J]. JSM Biomedical Imaging Data Papers, 2015, 2(1): 1004�C1012.
[16] KNOTT G D. Interpolating cubic splines: volume18 [M]. Berlin, German: Springer Science & Business Media, 2012.
[17] HENDERER J. Disc damage likelihood scale [J]. British Journal of Ophthalmology, 2006, 90(4): 395�C396.
[18] DANESH-MEYER H, GASKIN B, JAYUSUNDERA T, DONALDSON M, GAMBLE G D. Comparison of disc damage likelihood scale, cup to disc ratio, and heidelberg retina tomograph in the diagnosis of glaucoma [J]. British Journal of Ophthalmology, 2006, 90(4): 437�C441.
[19] ABRMOFF M D, MAGALH ES P J, RAM S J. Image processing with imageJ [J]. Biophotonics International, 2004, 11(7): 36�C42.
[20] KASA I. A circle fitting procedure and its error analysis [J]. IEEE Transactions on Instrumentation and Measurement, 1976, 1001(1): 8�C14.
[21] FITZGIBBON A, PILU M, FISHER R B. Direct least square fitting of ellipses [J]. IEEE Transactions on Pattern Analysis and Machine Intelligence, 1999, 21(5): 476�C480.
[22] KASS M, WITKIN A, TERZOPOULOS D. Snakes: Active contour models [J]. International Journal of Computer Vision, 1988, 1(4): 321�C331.
[23] HEARE D, BAKER M P. Computer graphics (c version) [M]. New Jersey: Prentice Hall International Inc, 1998.
[24] HENDERER J D, LIU C, KESEN M, ALTANGEREL U, BAYER A, STEINMANN W C. Reliability of the disk damage likelihood scale [J]. American Journal of Ophthalmology, 2003, 135(1): 44�C48.
(Edited by YANG Hua)
���ĵ���
����������о��ľ���DDLS�Զ�����ܵ��۵�ͼ���ע����
ժҪ�������µ�HTML5�������ԣ������һ�����������/�������ܹ��������ͼ�����ݿ⽨��ϵͳ(BGIDB)�����߱�ע���ߣ�������ע�۵�ͼ���ӱ������̱�Ե��ʹ��B��������ϱ�ע���ߣ��������������˶���(DDLS)�����һ���Զ���������ۼ����ȼ����㷨������DDLS����������۽��̵�ָ�ꡣʵ�����������ù��߾��нϺõı�ע���֣������̺��ӱ��ֱ����4.34%��8.31%�ı�ע�ص���������е�������ע���ߣ����������˻������еĺ�ʱҲ�������ơ�Ŀǰ��BGIDB�Ѿ��������ϴ�ѧ�ۿ�ͼ���о����������Ŷ�ҽԺ�����е���������ݿ⽨�衣
�ؼ��ʣ�����ۣ�ͼ�����ݿ⣻B�������������˶���
Foundation item: Projects(61672542, 61573380) supported by the National Natural Science Foundation of China; Project(2016zzts055) supported by Fundamental Research Funds for the Central Universities, China
Received date: 2017-03-25; Accepted date: 2017-10-10
Corresponding author: CHEN Zai-liang, PhD, Associate Professor; Tel: +86�C13875952018; E-mail: xxxyczl@csu.edu.cn; ORCID: 0000-0003-3542-8261

