
Degradation of anthraquinone dyes by ozone
LIU Jia-le(������), LUO Han-jin(����), WEI Chao-hai(����)
College of Environmental Science and Engineering, South China University of Technology,Guangzhou 510640, China
Received 17 November 2006; accepted 25 May 2007
Abstract: The decolorization of three kinds of anthraquinone dyes by ozone was investigated and the residues in the degradation solution were analyzed. The results indicate that the decolorizing effects are obvious with the decolorization efficiency of dyes all above 96% in 40 min. The pH value and TOC concentration decline while the conductivity increases with the lapse of reaction time. The complicated dye molecules are decomposed to simple compounds with ��SO3H, ��Cl in the dye molecules transformed into  Cl-, and nitrogen partially degrades into
  according to the bases of different groups. The organic acids are found in the degradation solutions and dyes with larger relative molecular mass are decomposed into substances with larger relative molecular mass.
Key words: decolorization; anthraquinone dye; ozone; residue
1 Introduction
Wastewater derived from dye industry is characterized by deep color, high chemical oxygen demand(COD) content and pH value varying from 2 to 12��which is very toxic and resistant to physicochemical treatments and not easily biodegradable[1-6]. The color of dye results from conjugated chains or rings that can absorb UV light of different wavelengths. The chromophores of dyes are usually composed of C=C, N=N, C=N, and aromatic and heterocyclic rings containing oxygen, nitrogen or sulfur[7-8]. Some chemicals such as hypochlorite, ozone, and hydrogen peroxide, in the absence and in the presence of UV light and hydrogen peroxide with ferrous ions, have been used for pretreatment of dye-bearing wastewater[9-10].
Ozone is very effective in decolorizing dye wastewater because it attacks conjugated double bonds that are often associated with color[11-12]. Ozone reacts with aqueous compounds in two paths: a direct path corresponding to the action of molecular ozone, and an indirect path resulting from the decomposition of ozone to radicals. Decomposition favored by basic pH is initiated by hydroxyl ions (OH-)[13]. But few studies have been carried out on the comparative research on the decolorization efficiency of different dyes by ozone and the residues of dye aqueous solutions. Therefore, the objective of the present work is to compare the ozonation decolorization efficiency of different types of anthraquinone dyes. Moreover, the variation of pH value, conductivity, TOC in the reaction process, and the residues in the degradation solutions are analyzed for researching the ozone degradation of anthraquinone dyes.
2 Experimental
2.1 Materials
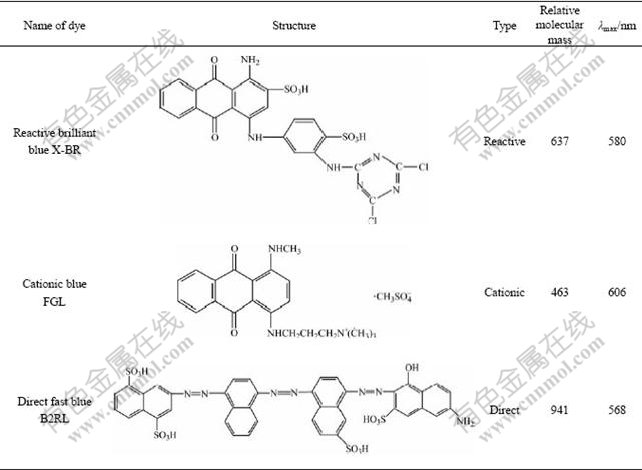
The chemical structures and properties of anthraquinone dyes used were represented in Table 1[14]. The types of dyes used involved direct, cationic and reactive dyes, and the experimental dyes were all analytically pure.
Table 1 Structures and properties of dyes
2.2 Apparatus and experimental methods
The experimental set-up included an oxygen concentrator (Sim O2 plus, China), a HF-3 model ozone generator (Ozonetek Ltd, China) that was used to obtain a maximum producing rate of ozone, 3 g/h, an ozonation chamber with a capacity of 800 mL and two gas absorption bottles. It was provided with a sample port at various times, an ozone gas inlet at the bottom. Excess ozone was passed into two gas absorption bottles containing 2% KI solution.
500 mL of dye solutions at concentration of 300 mg/L were prepared and exposed to ozonation in the ozonation chamber. 5 mL of the solution was sampled at 0, 1, 3, 5, 10, 15, 20, 25, 30 and 40 min, respectively. The pH value and conductivity were measured.
For the preparation of GC-MS samples, the degradation aqueous solutions were extracted three times with 30 mL trichloromethane at pH value of 2 and 11 adjusted by HCl and NaOH, respectively. The extracted phase was purged to 1 mL using pure nitrogen gas at 25 ��, and then adjusted to 5 mL by adding acetone for GC-MS analysis.
2.3 Analytical methods
The samples were determined by testing absorbance at maximum wavelength(��max) of the dyes on Hitachi UV�Cvisible spectrophotometer (U-3210, Japan). The decolorization efficiency was calculated by the equation:
 (1)
(1)
where �� is the decolorization efficiency of dye, A0 is the absorbance of initial aqueous solution, and A1 is the absorbance of sample after decolorizing for certain time.
The O-I-Analytical TOC analyzer (1020A, USA) was used to measure TOC concentration by directly injecting the samples to characterize the mineralization of dyes. The Bruker infrared spectrometric analyzer (Tensor 27, Germany) was used to analyze the variation of dye molecules. Besides, the solutions after ozonation were measured by Dionex ion chromatography (ICS-2000, USA).
The Shimadzu GC-MS spectrometer (QP2010, Japan) was used to confirm the identity of the degradation products. The capillary column used was an HP-5 (cross linked 5% phenyl methyl siloxane, 30.0 m��0.25 mm��0.25 ��m). 1 mL of the solution was chromatographed under the following conditions: injector temperature was 280 ��, the initial column temperature was held constant at 40 �� for 2 min, ramped at 10 ��/min to 150 �� and held constant for 2 min, then ramped further at 5 ��/min to 250 �� and held constant for 2 min, at last ramped at 10 ��/min to 280 �� and held constant for 3 min.
3 Results and discussion
3.1 Comparison of decolorization efficiency
Fig.1 shows the time variation of decolorization efficiency of dyes. It can be seen from Fig.1 that the decolorization efficiencies of all dyes reach over 87.1% in 20 min, indicating that ozone is very effective for decolorizing the anthraquinone dyes. After 20 min, the increase of decolorization rate slows down gradually, while the decolorization efficiencies of reactive brilliant blue X-BR, direct fast blue B2RL and cationic blue FGL are respectively 99.8%, 98.9% and 96.0% in 40 min, which means that the chroma of solution are almost wiped off. Fig.1 also indicates although the experimental dyes are all anthraquinone ones, their decolorization efficiencies are different. This relates to the chemical structure and relative molecular mass of dyes. The larger the relative molecular mass, the smaller the molar concentration, and the larger the decoloriza- tion rate. Reactive brilliant blue X-BR and cationic blue FGL both have one chromophore ( ), and the relative molecular mass of reactive brilliant blue X-BR (637) is larger than that of cationic blue FGL (463), so the decolorization rate of reactive brilliant blue X-BR is higher than that of cationic blue FGL. Although direct fast blue B2RL has two chromophores(
 ), because is easier to be degraded than
  and its relative molecular mass(941) is about twice as large as that of cationic blue FGL, the decolorization rate of direct fast blue B2RL is also higher than that of cationic blue FGL. According to the dynamics of chemical reaction, the decolorization rate is high in 0-20 min, which belongs to the quick reaction step, but it decreases in 21-40 min, causing decrease of decolorization rate with the increase in reaction time.
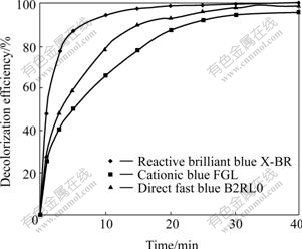
Fig.1 Decolorization efficiency of samples vs reaction time
3.2 Analysis of pH value and conductivity
In order to examine how the solution changes with its properties, its pH value and conductivity were measured.
The time variation of pH value of samples is shown in Fig.2, which indicates that the pH value of the samples decreases with increasing reaction time. The final pH value of reactive brilliant blue X-BR, direct fast blue B2RL and cationic blue FGL are 3.64, 4.21 and 3.61, and ?pH are 1.86, 2.74 and 1.46, respectively. Besides, the higher the pH value of the original solution is, the more steeply it declines. As shown in Fig.2, the downtrend of pH value is obvious when the decolorization rate increases rapidly in 20 min, but it slows down with the decrease in decolorization rate after 20 min, thus it can be considered that the trend of the pH change is consistent with the decolorization efficiency, and that H+ is released in the reaction and the dye molecules can be possibly decomposed to organic acid or inorganic acid in the degrading process.
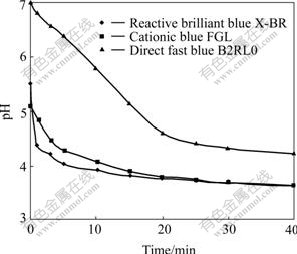
Fig.2 pH value of samples vs reaction time
Fig.3 shows the time variation of conductivity of dyes. It can be seen that the conductivity of dyes increases with increasing reaction time and climbs up more quickly in the first 20 min than after 20 min, and the change trend is consistent with the decolorization efficiency and pH value. After reaction, the increments of conductivity of reactive brilliant blue X-BR, cationic blue FGL and direct fast blue B2RL are 249, 380 and 72 mS/cm, respectively, which means that ions in the solution augment with increasing reaction time and the dye molecules have been decomposed to ions and other substances.
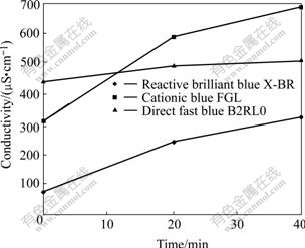
Fig.3 Conductivity of samples vs reaction time
3.3 Analysis of TOC
As shown in Fig.4, TOC concentration decreases with increasing reaction time, reaching over 24.9% in 40 min and the variation trend is consistent with that of the decolorization efficiency and pH value. By comparing Fig.1 with Fig.4, it shows that the variation of TOC is rather large when the change of decolorization efficiency is less, which indicates that besides chromophores, other parts of dye molecules also participate in the reaction, generating CO2 or volatile organic compounds[13,15] that cause the decrease in the TOC concentration. Part of CO2 produced changes into carbonic acid and the rest evaporates from the solution. The downtrend of pH value is more obvious as a whole when the pH value of original solution is larger, showing the possibility of the increase in the concentration of carbonic acid.
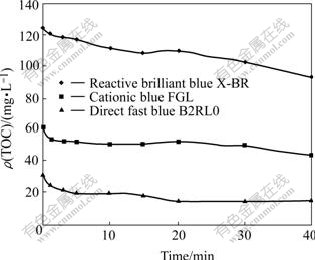
Fig.4 TOC concentration of samples vs reaction time
3.4 Variation of dye molecules
Fig.5 shows the infrared spectra of fore-and-aft degradation of three anthraquinone dyes. As shown in Fig.5, the fore-and-aft degradation variation of dye molecules is obvious by comparing the two curves of fore-and-aft degradation[16]. In the initial aqueous solutions, the strong absorption peak of C=O that is the chromophore of anthraquinone dye is near 1 675 cm-1 and the absorption peak of C��O exists near 1 280 cm-1. Because of the decomposition from cyclic compound to acyclic compound, the IR absorption peak of carbonyl is in the region of 1 650-1 700 cm-1. Similarly, all three anthraquinone dyes contain the complex aromatic structure, thus the bands of aromatic compound in the five regions are seen in Fig.5, but after reaction the characteristic absorption peaks are weakened evidently or disappear, indicating that complicated compounds of benzene ring are decomposed into simple ones. Besides, the peak of free ��OH in the region of 3 400-3 664 cm-1 is lower than that after degradation, probably due to the descent of pH value; and the characteristic absorption peaks of CO2 in the region of 2 360-2 300 cm-1 in the air are generated in the infrared spectra of degradation solutions in Fig.5. So it can be concluded that complicated molecules of anthraquinone dyes are decomposed to simple organic compounds after reaction.
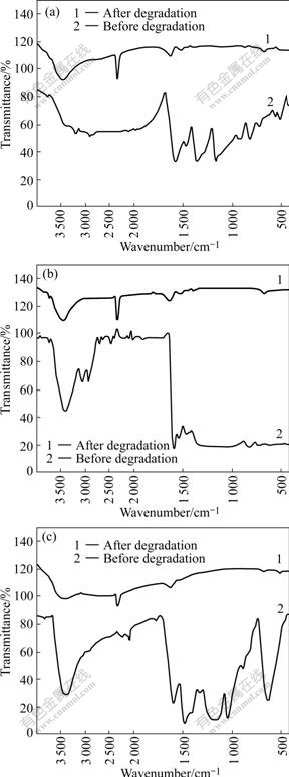
Fig.5 Infrared spectra of fore-and-aft degradation of samples: (a) Reactive brilliant blue X-BR; (b) Cationic blue FGL; (c) Direct fast blue B2RL
3.5 Analysis of inorganic residues
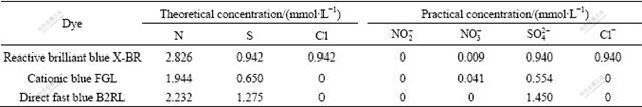
It is considered that the degraded aqueous solutions probably contain inorganic anions of N, S and Cl, because the structural formulas of dyes contain N, S and Cl. As shown in Table 2, by means of comparing the theoretical concentration of N that is calculated by using chemical measuring method with the practical concentration of 
 that measured by using ion chromatography, we can observe that the practical concentration is much less than the theoretical one, indicating that N in the dye molecule is not decomposed to completely, and some other compounds containing N are produced. the practical concentrations of
  in degradation solutions of all dyes are equal to zero, indicating that is oxidized by ozone to. Table 2 shows that only exists in reactive brilliant blue X-BR and cationic blue FGL solutions after degradation, probably because the compounds containing N=N or Ar��NH2 are oxidized by ozone to N2 or Ar�� NO2, whose oxidative products cannot be transformed to
 However,
  is oxidized easily to
  and because of space resistance of R1, R2 and Ar,
  disengages from benzene ring and
then is partially oxidized to. After reaction, ��SO3H and ��Cl in the dye molecules are transformed into and Cl-, respectively. It is deduced that there is organic acid in the degradation solution, because the H+ content in the degraded aqueous solution is much higher than inorganic acid produced by combining H+ with
  and Cl-.
Table 2 Comparison of theoretical concentrations of N, S and Cl elements with practical ones
3.6 Analysis of organic residues
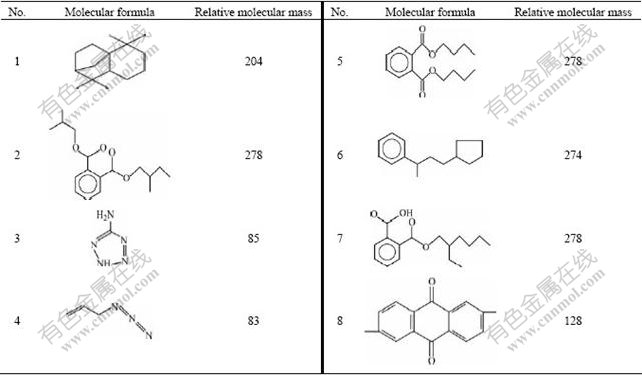
The purpose of GC��MS analysis is to identify some intermediates produced from the degradation processes and organic residues in the degradation solutions. The GC��MS chromatograms of the blank and the samples are displayed in Fig.6, and the organic residues are listed in Table 3. Compared the chromatogram of samples with that of blank, the degradation solutions of three anthraquinone dyes all contain organic residues No.1, 2, 3 and 4. In addition, the degradation solution of reactive brilliant blue X-BR contains organic residues No.5 and 6, direct fast blue B2RL contains organic residue No.7, and cationic blue FGL also contains No.6 and 8, and naphthalin ring. In addition, it is notable that organic residue No.2, 5, 7 are organic acids, so it validates adequately, where there are organic acids in the degradation solution. Through analysis, dyes with larger relative molecular mass are decomposed into other substances with comparatively larger molecular mass.
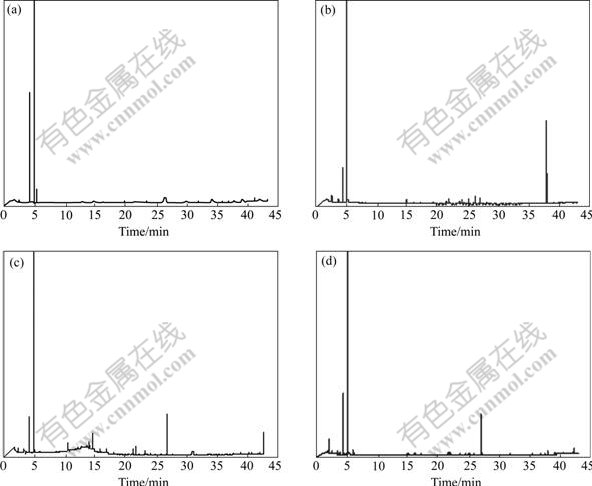
Fig.6 GC��MS spectra of three kinds of blank and anthraquinone dyes: (a) Blank; (b) Reactive brilliant blue X-BR; (c) Cationic blue FGL; (d) Direct fast blue B2RL
Table 3 Organic residues determined by GS��MS
4 Conclusions
1) Ozone treatment is very effective in decolorization of anthraquinone dyes, and the decolorization efficiency reaches over 87.1% in 20 min. Some acids are produced, causing pH value to reduce. The final pH values of reactive brilliant blue X-BR, direct fast blue B2RL and cationic blue FGL are 3.64, 4.21 and 3.61, respectively. The trend of pH change is consistent with that of the decolorization efficiency.
2) In the process of reaction, the conductivities of reactive brilliant blue X-BR, cationic blue FGL and direct fast blue B2RL are increased by 249, 380 and 72 mS/cm, respectively, and they climb up more quickly in the first 20 min than after 20 min. CO2 or volatile organic compounds are produced, causing the decrease of TOC concentration, and the descent rate reaches over 16% in 40 min. Part of CO2 produced changes into carbonic acid and the rest evaporates from the solution. The trends of the conductivity and TOC are consistent with those of the pH value and decolorization efficiency.
3) The complicated dye molecules with ��SO3H and ��Cl are decomposed into the simple organic compounds withand Cl-, while N is partially degraded to but not  There are organic acids in the degradation solutions and the dyes with larger relative molecular mass are decomposed into other compounds with larger relative molecular mass.
References
[1] PERKOWSKI J, KOS L, LEDAOWICZ S. Application of ozone in textile wastewater treatment [J]. Ozone Sci Eng, 1996, 18: 73-85.
[2] NAUMCZKYK J, SZPYRKOWICZ L, ZILIO GRAND F. Electrochemical treatment of textile wastewater [J]. Water Sci Tech, 1996, 11: 17-24.
[3] RANA K S, RAIZADA S. Acute toxicity of tannery and textile dye effluents on common teleost, Lobeo rohita: Histological alteration in liver [J]. J Environ Biol, 1999, 20(10): 33-36.
[4] SZPYRKOWICZ L, JUZZOLINO C, KAUL S N. A comparative study on oxidation of disperse dyes by electrochemical process, ozone, hypochlorite and fenton reagent [J]. Water Research, 2001, 35(9): 2129-2136.
[5] SZPYRKOWICZ L, ZILIO GRANDI F. Performance of a full-scale treatment plant for textile dyeing wastewater [J]. Toxicol Environ Chem, 1996, 56(2): 23-34.
[6] VAGHELA S S, JETHYA A D, MEHTA B B, DAVE S P, ADIMURTHY S, RAMACHANDRAIAH G. Laboratory studies of electrochemical treatment of industrial azo dye effluent [J]. Environmental Science and Technology, 2005, 39(8): 2848-2855.
[7] ZHAO W R, SHI H X, WANG D H. Ozonation of cationic red X-GRL in aqueous solution: Degradation and mechanism [J]. Chemosphere, 2004, 57: 1189-1199.
[8] CHU W, MA C W. Reaction kinetics of UV-decolorization for dye materials [J]. Chemosphere, 1998, 37: 961-974.
[9] LIN S H, CHEN M L. Treatment of textile wastewater by chemical methods for reuse [J]. Water Research, 1997, 31(8): 868-876.
[10] KUO W G. Decolorizing dye wastewater with Fenton��s reagent [J]. Water Research, 1992, 26: 881-884.
[11] MUTHUKUMARA M, SARGUNAMANI D, SELYAKUMAR N, RAO J V. Optimisation of ozone treatment for color and COD removal of acid dye effluent using central composite design experiment [J]. Dyes and Pigments, 2004, 63: 127-134.
[12] SARASA J, ROCHE M P, ORMAD M P, GIMENO E, PUIG A, OVELLEIRO J L. Treatment of a wastewater resulting from dyes manufacturing with ozone and chemical coagulation [J]. Water Research, 1998, 32(5): 2721-2727.
[13] MUTHUKUMARA M, SARGUNAMANI D, SELYAKUMAR N. Statistical analysis of the effect of aromatic, azo and sulphonic acid groups on decolorization of acid dye effluents using advanced oxidation processes [J]. Dyes and Pigments, 2005, 65: 151-158.
[14] HOU M F, ZHU Z H, WANG R Z. Dye Chemistry [M]. Beijing: Chemical Industry Press, 1994. (in Chinese)
[15] KOCH M, YEDILER A, LIENERT D, INSEL G, KETTRP A. Ozonation of hydrolyzed azo dye reactive yellow 84(CI) [J]. Chemosphere, 2002, 46: 109-113.
[16] YAO H W. Spectrum of organic compounds [M]. Beijing: Science Press, 1988. (in Chinese)
Foundation item: Project(50278036) supported by the National Natural Science Foundation of China; Project(2006AA06Z378) supported by the National High-Tech Research and Development Program of China
Corresponding author: LUO Han-jin; Tel: +86-20-87114142; Fax: +86-20-87114142; E-mail: luohj@scut.edu.cn
(Edited by CHEN Wei-ping)

