


Trans. Nonferrous Met. Soc. China 22(2012) 949-957
Electrodeposition of Sb(��) in alkaline solutions containing xylitol
LIU Wei1,2, YANG Tian-zu2, ZHOU Qiong-hua1, ZHANG Du-chao2, LEI Cun-mao2
1. School of Materials Science and Engineering, Henan University of Science and Technology, Luoyang 471003, China;
2. School of Metallurgical Science and Engineering, Central South University, Changsha 410083, China
Received 29 April 2011; accepted 2 June 2011
Abstract: The electrodeposition of antimony in alkaline solutions containing xylitol was investigated using cyclic voltammetry, linear sweep voltammetry and chronoamperometry. The antimony electrodeposition and the chemical stability of xylitol in alkaline solutions were studied by cyclic voltammetric technique. Apparent activation energy, apparent transfer coefficient and exchange current density were obtained by linear sweep voltammetric technique. Initial stages of antimony electrocrystallization were determined by chronoamperometry. Xylitol in alkaline solutions exhibits high chemical stability and there is no redox in solutions when the potential ranges from -1.20 V to +0.60 V (vs Hg/HgO). There is no other redox reaction but hydrolysis occurring on stainless steel in the potential range of -1.75 V to 1.25 V (vs Hg/HgO) while the xylitol decomposition maybe take place on antimony electrode when potential is more negative than -1.70 V (vs Hg/HgO). Cyclic voltammograms with different scan rates indicate that the antimony electrodeposition process is an electrocrystallization which is a completely irreversible electrode process. The apparent activation energy, apparent transfer coefficient and exchange current density were calculated to be 46.33 kJ/mol, 0.64 and 4.40��10-6 A/m2, respectively. The analyses of the chronoamperometric responses support the view of a three-dimensional growth under progressive nucleation. The average diffusion coefficient of antimony was calculated to be 1.53��10-6 cm2/s.
Key words: antimony electrodeposition; xylitol; electrocrystallization; cyclic voltammetry; chronoamperometry
1 Introduction
The hydrometallurgy of antimony in industry consists of three procedures. The antimony ores are first leached with sodium sulfide and then the leaching solution is electrowinned to obtain the crude antimony which is refined by subsequent electrorefining procedure. The electrolyte used in electrorefining is usually a mixture of hydrofluoric acid and sulfuric acid [1,2]. Despite the poor working conditions and the damages to the human body caused by the electrolyte in the present hydrometallurgical industry of antimony, the electro- refining of antimony in hydrofluoric acid and sulfuric acid solutions is no longer steady due to the more complicated compositions of the crude antimony [3,4]. Some recent publications reported that the antimony trioxide (Sb2O3) could be dissolved in alkaline solutions containing polyhydric alcohols (PAs), such as xylitol (C5H12O5), glycerol (C3H8O3) [5-7]. So, leaching and extracting of antimony in alkaline solutions containing PAs may be a new approach in hydrometallurgy of antimony, especially for oxide-bearing ore. In addition, as a food additive, the xylitol is poisonless and harmless [8,9]. The electrowinning and electrorefining of antimony with alkaline solutions containing xylitol will reduce the environmental pollution caused by extraction of antimony.
In recent years, some reports on PAs have been focused on the recovery of lead in exhausted lead-acid batteries [10-14]. However, there were a few researches on applications of PAs in metallurgy of antimony. The electrorefining of antimony in alkaline solutions with xylitol was studied in Russia [1]. After electrorefining and subsequent zone refining, the purity of antimony was higher than 99.99%. PAN et al [6,15] reported the electrowinning process of antimony from the alkaline solutions containing glycerol. ZHANG et al [16] published the study of the electro-separation of gold and antimony in alkaline solutions containing xylitol. It is an effective way of gold-antimony alloy metallurgy. However, the best of our knowledge, there is little electrochemical study on the electrorefining or the electrowinning procedure of antimony. No detailed study has been made so far on the mechanism of antimony electrocrystallization in alkaline solutions containing PAs. The nucleation mechanism of antimony and other metals is little understood, such as the early stages of antimony electro-crystallization on cathode.
In this work, cyclic voltammetric (CV), linear sweep voltammetric (LSV) and chronoamperometry (CA) techniques were employed to investigate the electrodeposition of antimony in alkaline solutions containing xylitol (AX solution), in order to provide better understanding of the underlying nucleation mechanisms and some other information for the application of xylitol in the hydrometallurgy of antimony.
2 Experimental
CV, LSV and CA tests were carried out in a three-electrode cell using the CHI 660C electrochemical analyzer (CH Instrument, Inc.). The working electrode was a 1 cm2 AISI 316 stainless steel (SS316) with one side sealed by insulating binder. The auxiliary electrode was a platinum plate and the reference electrode was a Hg/HgO electrode (Shanghai Shenyuan Science Instrument Co., Ltd.), with standard electrode potential of 0.114 V (vs NHE) at 298 K. Unless specified otherwise, the electrode potentials in the text were referenced to the Hg/HgO electrode. Before each electrochemical measurement, the electrodes were hand-polished with metallographic SiC sand paper. Subsequently, the electrodes were polished with alumina grinding paste and then cleaned ultrasonically in the alcohols and deionizer water, respectively.
The xylitol was food grade (Xylitol content >99.5%), produced in Dalian Xigang Yikang Xylitol Food Co. The antimony trioxide and the sodium hydroxide were analytical regent grade. All the solutions were prepared with deionizer water.
The composition of electrolyte used in electrochemical stability tests of xylitol in alkaline media was 2.00 mmol/L NaOH and 1.00 mmol/L C5H12O5. Solution components in other experiments were 2.00 mmol/L NaOH, 0.50 mmol/L Sb(III) and 1.00 mmol/L C5H12O5.
3 Results and discussion
3.1 Electrochemical stability of xylitol in alkaline solutions
During electrodeposition procedure, besides the antimony electrodeposition in electrolysis, the organic groups may have some redox reactions which would affect the stability of the electrolyte composition, current efficiency, electrolysis costs, product quality, and so on. In order to control the electrolysis procedure within the potential range where the xylitol has no redox, the electrochemical stability of xylitol in AX solution should be studied firstly.
Figure 1 shows the cyclic voltammograms obtained on stainless steel electrode and the antimony electrode in AX solution at different temperatures. The scan started from the open circle potential of about -0.8 V at a scan rate of 10 mV/s. From Fig. 1(a), at the initial stage of scan, the zero current indicated no redox. During the scan towards the negative potentials, the current increased slightly when the potential ��<-1.20 V, meanwhile it could be observed that bubbles appeared on the electrode surface. Subsequently, cathodic current increased rapidly as the potential shifted towards negative direction, then reached the maximum and plateau when ��<-1.60 V. The region from -1.20 V to -1.60 V corresponded to the hydrogen evolution. Reverse sweeping to about -1.20 V, the current returned to 0, and there was no hydrogen evolution reaction on the electrode surface any more. The current remained 0 within the potential range of -1.20 V to 0.60 V, indicating that the electrolyte was stable and no chemical reaction occurred there. When ��>0.60 V, anodic current began to emerge, at the same time it could also be observed that bubbles appeared on the surface of the electrode, current increased at more positive potential and reached its maximum at about 0.85 V. The lower overpotential of hydrogen and oxygen at higher temperature indicated that the hydrolysis became easier at elevated temperature. The smooth curves of cyclic voltammograms in Fig. 1(a) indicate little other redox in the solution but the hydrolysis. MATOS et al [17] investigated the electrooxidation of xylitol on the platinum single crystal electrode by cyclic voltammetry. They found the oxidation current peaks of xylitol ranged from 0.4 V to 0.7 V (vs RHE). JING [18] studied the electrooxidation of glycerol on N7Zr2 electrodes. The Ni7Zr2 electrode showed higher catalytic activities than Ni electrode. The glycerol was oxidized when the overpotential was higher than 0.4 V (vs Hg/HgO). The oxygen evolved when the overpotential was higher than 0.68 V (vs Hg/HgO). Electrochemical oxidation of various polyhydric alcohols on a platinum electrode in alkaline KOH and K2CO3 was studied by MATSUOKA et al [19]. All the polyhydric alcohols tested in the experiment showed high reactivities in both alkaline solutions. Oxidation of xylitol in KOH started at about 0.6 V (vs RHE), and reached a peak at about 0.8 V (vs RHE). However, in this study, there was only oxygen evolution in the anodic scan instead of oxidation of xylitol. It is partly due to the poor catalytic ability of stainless steel to the alcoholic hydroxyl, and partly because the hydrogen atom of the active alcoholic hydroxyl has been substituted by antimony atom in the Sb2O3 dissolution procedure and the C��O��Sb bond is more stable than C��O��H bond.
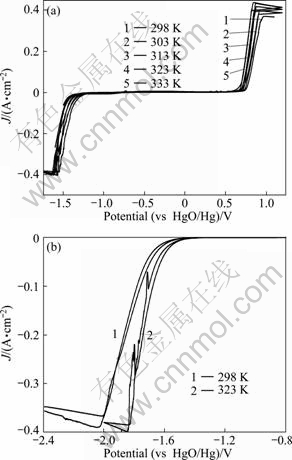
Fig. 1 Cyclic voltammograms obtained on stainless steel electrode (a) and antimony electrode (b) in AX solution
It can be seen from Fig. 1 (b) that, at 298 K, there is no current between -0.80 V and -1.40 V. The hydrogen evolution reaction occurred when ��<-1.40 V and cathode current increased rapidly as the potential moved towards negative direction, and reached peak value at about -2.0 V. The smooth curve and single current peak indicate no other redox but hydrogen evolution. At 323 K, the peak current of hydrogen evolution reaction did not increase for antimony electrode, but at more positive potential. Compared with the limiting current at 298 K, cathodic current increased more rapidly, and then reached a maximum current at about -1.83 V, which shifted about 0.2 V towards positive direction. When ��<-1.70 V, two or three small current peaks appeared, which may indicate decomposition of xylitol in the cathode electrode. Although the alcohols in alkaline media could be oxidized to form aldehydes and resins at anode [20]. At present, there are no reports related to the type and reduction mechanism of alcohols reduction reactions in the cathode. These peaks may be also due to the evolution of the bubbles for there are only ��oxidation peak�� but no ��reduction peak�� couples. The maximum current of hydrogen evolution reaction was about 0.4 A, which was close to that of stainless steel electrode. The overpotential for hydrogen evolution on antimony electrode was higher than that on stainless steel electrode.
Figure 2 presents the typical cyclic voltammogram of antimony deposition in AX solution, obtained in the potential range of -1.15 V to 0.4 V at 298 K. During the forward scan towards the negative potentials, the cathodic current increased sharply, which corresponds to the antimony deposition and a current peak at ��=-1.08 V can be observe. In the reverse sweeping, the antimony dissolution was denoted by the peak occurring at about 0.61 V (ca). As shown in Fig. 1(a), the potential range of antimony electrodeposition was within -1.20 V and 0.60 V where the electrochemical property of electrolyte was stable, and no chemical reaction occurred. Therefore, compared with AX solution without antimony, the alkaline solution containing xylitol is feasible for antimony electrolysis.
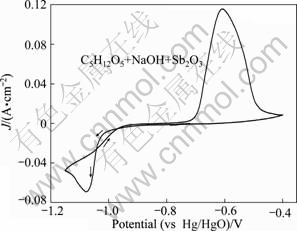
Fig. 2 Typical cyclic voltammogram obtained in AX solution containing antimony (at scan rate of 10 mV/s)
3.2 Determination of kinetic parameters of antimony deposition
3.2.1 Cyclic voltammograms of antimony deposition
A family of cyclic voltammograms under different sweep rates in AX solution are illustrated in Fig. 3. The scan initiated at open circle potential (-0.75 V) in the negative direction. As shown in Fig. 3, before the hydrogen evolution, there was only one reduction peak in each cyclic voltammogram, corresponding to the process of antimony deposition. In the negative scan, the maximum current value increased more sharply with higher sweep speed (shown in Fig. 4) while the potential of the peak moved more negatively. The shape of all the cyclic voltammograms remained almost the same with increasing the sweep speed, and all the polarization peaks were parallel as the potential of the peak shifted towards negative direction. These results revealed that the discharge reaction of antimony in AX solution was irreversible.
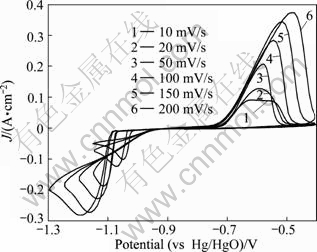
Fig. 3 Cyclic voltammograms of antimony in AX solution at different sweep rates
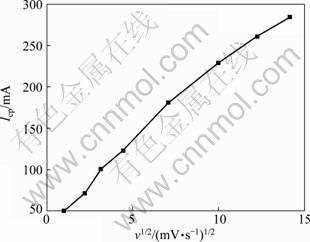
Fig. 4 Cathodic peak current with different sweep rates
In the reverse positive direction, starting from the potential peak of antimony reduction to the open circuit potential, oxidation reaction did not occur. The anodic current was present when ��>-0.75 V and the anodic oxidation peak appeared at a potential range of -0.60 V and -0.48 V. At the initial stages of the anodic process, the current value was nearly the same as the sweep rate changed. The maximum current value and potential of the oxidation peak both increased with increasing the sweep rate, indicating that the anodic oxidation was an electrode process without proceeding chemical reaction [21].
It can also be seen that the potential difference (����) between anodic peak potential and cathodic peak potential rose at higher sweep rate. ���� was larger than 28 mV (56/n, n is the number of electrons transferred in electrode reactions, n=3 in this study). In addition, as shown in Fig. 5, the ratio of oxidation peak current Iap to reduction peak current Icp increased almost linearly with increasing v1/2, which was the performance of the irreversible electrode reaction, and the degree of irreversible electrode was enhanced with increasing the scan rate [22].
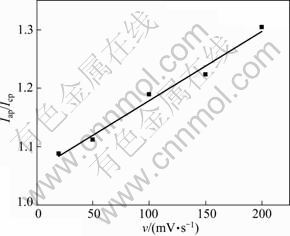
Fig. 5 Ratio of Iap and Icp with different sweep rates
CV at different scan rates is a useful way to giving the electrode mechanistic information [23]. As shown in Fig. 6, the value of Icpv-1/2 decreased rapidly as the v increased and v to a plateau. The cathodic electrode mechanism may be related to an irreversible electrode process with proceeding chemical reaction.
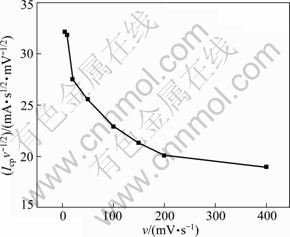
Fig. 6 Curve of Icpv-1/2 vs sweep rate
3.2.2 Apparent activation energy
The value of activation energy for electrode reaction is an important parameter to determine the reaction mechanism. Figure 7(a) shows the cathodic polarization curves of antimony electrodeposition in AX solution at different temperatures. With increasing the temperature, antimony deposition overpotential decreased gradually. Moreover, as the temperature rose, the maximum current value of antimony increased relevantly. This phenomenon indicates that at the same overpotential, there would be a larger discharge current at higher temperature. At the overpotential of 0.015 V, the plot of current density at different temperatures, lgJ-1/T, is shown in Fig. 7(b) and the linear fitting equation is as follows:
 (1)
(1)
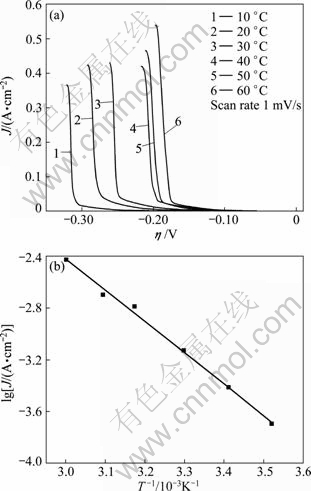
Fig. 7 Cathodic polarization curves of antimony electro- deposition at different temperature (a) and curve of lgJ-1/T (b)
The apparent activation energy is calculated to be 46.33 kJ/mol according.
 (2)
(2)
where J is the current density at the overpotential; B is a constant; A is the apparent activation energy; T is the temperature; R is the gas constant, 8.314 J/(mol��K).
When the electrode reaction is controlled by diffusion, the temperature coefficient for reaction rate is relative low, and the calculated activation energy of electrode reaction is usually in 12-16 kJ/mol. While the controlling step is the electrochemical discharge process, the temperature coefficient of reaction rate is relatively high, and the activation energy is generally larger than 40 kJ/mol [24]. In this work, according to the higher apparent activation energy, it is speculated that the controlled process is the electrochemical discharge process.
3.2.3 Apparent transfer coefficient
Figure 8 shows the steady-state polarization curves of antimony electrodeposition. The Tafel equation obtained by the linear fitting (shown in Fig. 9), from 0.18 to 0.27 V, is as follows:
 (3)
(3)
According to the formula:
 (4)
(4)
where an is apparent transfer coefficient; F is Faraday's constant (96485.3 C/mol); T is temperature; ��c is cathode overpotential; J0 is exchange current density; Jc is cathodic current density.
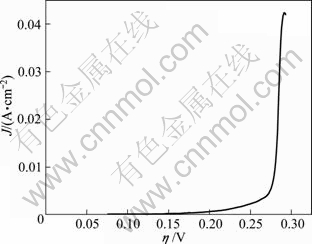
Fig. 8 Steady-state polarization curves of antimony electrodeposition
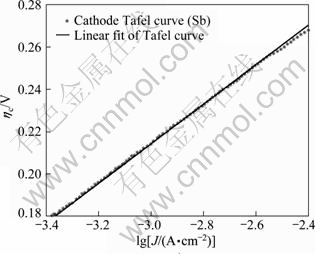
Fig. 9 Tafel curve of cathodic overpotential and lg J
Transforming the cathodic polarization curve (Fig. 8) into �ǡ�lg Jc curve (Fig. 9), by linear fitting, the kinetic parameters an and Jc are calculated to be 0.64 and 4.40��10-6 A/cm2, respectively. Compared with the data in other reports [25], the smaller value of J0 in this work indicates the electrode is of weaker reversibility and the electrode reaction is relatively slow [26].
3.2.4 Chronoamperometry for nucleation modeling
It can be seen from Fig. 2 that, the cathodic current appeared at -0.90 V which was associated to electrodeposition of antimony. At more negative potential, the current increased rapidly, and there was a clear reduction peak at about -1.08 V. During the reverse sweep, two crossovers between cathodic branch currents were observed, which was due to the deposition of metals. This character has been frequently observed in cyclic voltammograms when nucleation processes are involved [27-29].
Figure 10 shows the potentiostatic current transients of the antimony electrodeposition. These curves were obtained by stepping the potentials from -1.06 V to -1.10 V, running in the potential range where the electrodeposition reaction was under diffusion control. As shown in Fig. 10, the shape of the transients is a typical response of electrochemical nucleation and growth process. Moreover, the current in all these curves arises fast in the first few seconds until reaches a maximum value, and then it decreases asymptotically until reaches a constant current value.
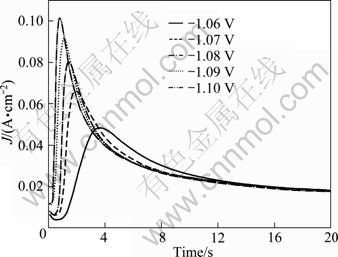
Fig. 10 Chronoamperometry curves of antimony deposition
The current transients consist of the initial fast current decay attributing to the double-layer charging, which is significant for t<1 s [16]. This is shown in Fig. 10 (near the Y axis) where the transient current is downward from a higher starting current. The transient is followed firstly by a rapid growth of current up to a maximum at the time tm, and then followed by a slow decay. The increase of cathodic current is due to the increase of the electroactive area, which includes the growth of each independent nucleus and the number of the nuclei. During this stage, the nuclei develop diffusion zones around themselves and these diffusion zones overlap the hemispherical mass-transfer to give ways for linear mass-transfer to an effectively planar surface [26]. The descending current after this stage relates to the planner electrode diffusion and the function of the declined current is adjusting the Cottrell��s equation. So, the antimony deposition consists of nucleation, overlapping of nuclei, elimination of growth center and initiation of the new growth centers. It also can be found in Fig. 10 that as the potential is set more negative, the maximum current increases and the tm decreases, which are usually found for the nucleation of solid phases produced electrochemically.
It has been reported the that potentiostatic transients could be evaluated through the mathematic models. SCHARIFKER and HILLS [30] developed the model for the three-dimensional (3D) multiple nucleation with diffusion-controlled growth [27,30,31]. According to the assumptions of random distribution of the hemisphere-shaped nuclei, no new nucleus occurred in the growth region of every existing nucleus and the overlapping of the growth zones. The expressions of instantaneous and progressive nucleation with 3D growth are given by Eq. (5) and Eq. (7) in Table 1, respectively [30,32].
In Table 1, z is the number of electrons exchanged; F is Faraday constant, 96485.3 C/mol; D is the diffusion coefficient; C is the bulk concentration of electroactive species; M and �� are the molar atomic mass and density of the electrodeposition phase, respectively; N0 is the number density of active sites; A is the nucleation rate constant; k and k�� are the non-dimensional growth rate constant; Im and tm are the current density and time, as respective peak coordinates. Eqs. (5)-(7) refer to the very fast nucleation on a small number of active sites, while Eqs. (8)-(10) correspond to the slow nucleation on a large number of active sites.
To determine whether the nucleation is instantaneous or progressive, an initial observation diagnostic was done, which involved comparing the experimental and theoretical transients in non-dimensional coordinates. The transients were normalized by their corresponding maximum values of current and time. The non-dimensional expressions of Eqs. (5) and (8) for the instantaneous case and progressive case are listed in Table 1.
Table 1 Expressions for instantaneous and progressive nucleation
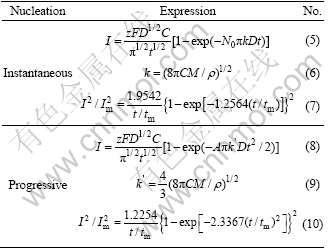
Figure 11 shows the normalized cathodic transients from Fig. 10 together with the theoretical curves which were evaluated from Eqs. (7) and (10) for instantaneous and progressive 3D nucleation and growth. Different shape of the curves was obtained due to different nucleation mechanisms. The peak of instantaneous plots is sharp while the progressive one is relatively gentle. The experimental data show a tendency of progressive nucleation before reaching the maximum points. When t/tm>1, the experimental data deviate from the theoretical model. The deviation may be due to the ideal hypothesis of the Scharifker model that the nuclei grow under diffusion control. Actually, for extending time the nuclei grow and the deposition of antimony is under mixed control (diffusion and charge transfer) [33]. According to RADISIC et al [34] and GRUJICIC et al [28], the deviation may be also due to the hydrogen reduction on the formed nuclei or the morphology change of the nucleus. However, at the beginning of deposition (tm), the deposition data of antimony are in accordance with the theoretical progressive plots. So, in AX solution, the nucleation mechanism of antimony is 3D progressive nucleation and growth under diffusion control at any overpotential applied in this study. XIANG et al [35] reported that the nucleation of antimony from aqueous critic acid and potassium citrate bath followed the progressive nucleation mechanism under low overpotential, which was similar to the results in this study. They also found that the deposition of antimony followed instantaneous nucleation under relative high overpotential, which was not observed here. In addition, as illustrated in Fig. 10 and Table 2, with more negative potential, tm shifts shorter while Im significantly increases. This is typical phenomenon for 3D nucleation under diffusion control.
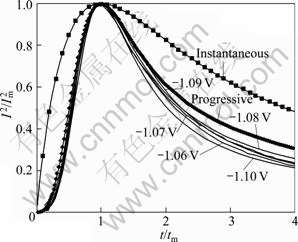
Fig. 11 Comparison of theoretical non-dimensional plots, (I/Im)2 vs (t/tm), for instantaneous and progressive nucleation with experimental data of potentiostatic transients from Fig. 10
The nucleation growth rate k�� which is vertical to the crystal surface could be evaluated according to the following equation:
Im=ZFk�� (11)
Figure 12 shows the plot of lg k�� vs potential. The logarithm of k�� increases with more negative potential. It indicates that the potential has significant effect on the nucleation growth rate. The crystals grow more rapidly at more negative potentials.
According to Eq. (8), at t=tm, Eq. (8) can be transferred to:
 (12)
(12)
By substitution of  into Eq. (12), the diffusion coefficient D could be calculated under every selected potential. The values of D and other parameters are listed in Table 2. The values vary little under different potentials and the average value of D is 1.53��10-6 cm2/s.
While the deposition of antimony follows the progressive nucleation mechanism, the number density of active sites (N0) increases prolonging time. However, N0 continues to increase until a saturated value at long time, namely, after the entire surface had been covered by nucleation exclusion zones [30]. The saturated nucleation number density (Nsat) could be estimated as:
 (13)
(13)
 (14)
(14)
The symbols are defined as the same as in Table 1, where ��=6.89 g/cm3, M=121.75 g/mol, C=0.50��10-3 mol/cm3. The value of Nsat was plotted as a function of potential (shown in Fig. 13). The saturated number density of nucleation active site increases the more negative potentials.
Table 2 Analysis of transients of antimony deposition in Fig. 10
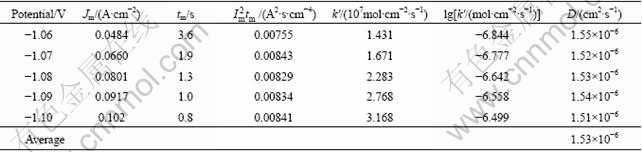
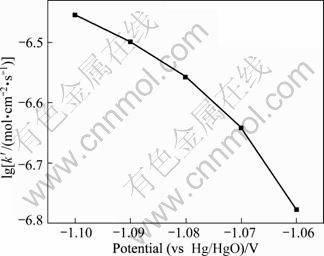
Fig. 12 Plot of nuclei growth rate vs potential
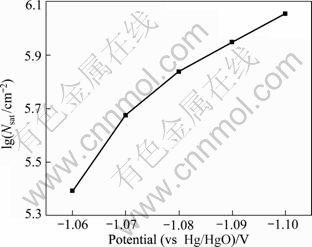
Fig.13 Plot of saturation number density vs potential
4 Conclusions
1) Cyclic voltammograms indicate that xylitol exhibits good electrochemical stability on stainless steel electrode in alkaline solutions and there is no chemical reaction occurring in the potential range of -1.20 V to + 0.60 V (vs Hg/HgO) at temperature range of 298 to 323 K. In the potential range between -1.75 V and 1.25 V (vs Hg/HgO), there are no other chemical reactions but water electrolysis reaction on stainless steel electrode. While at the potential ��<-1.70 V (vs Hg/HgO), xylitol may be decomposed on the antimony electrode.
2) The CV study at different sweep rates shows that the electrodeposition of antimony in alkaline solutions containing xylitol is a nucleation which is a totally irreversible electron transfer procedure. According to lgJ-1/T diagram, the apparent activation energy is calculated to be 46.33 kJ/mol. The large apparent activation energy value reveals that the electrode process may be under control of the electrochemical discharge process. According to the Tafel curve, the apparent transfer coefficient and exchange current density are calculated to be 0.64, and 4.40��10-6A/m2, respectively.
3) The analysis of cathodic current transients, using theoretical growth model, shows that the electrodeposition of antimony in alkaline solution containing xylitol adheres to a 3D growth under progressive nucleation limited by diffusion. The potential has significant effects on the growth rate of nuclei and saturation nuclear number density. The values of these two parameters both increase at more negative potentials. The average value of diffusion coefficient calculated from the current transients is 1.53��10-6 cm2/s.
References
[1] ZHAO Tian-cong. The metallurgy of antimony [M]. Changsha: Central South University of Technology Press, 1988. (in Chinese)
[2] ZHAO Rui-rong, SHI Xi-chang. Metallurgical physical chemistry of antimony [M]. Changsha: Central South University Press, 2006. (in Chinese)
[3] YANG Tian-zu, LIU Wei-feng, JIANG Ming-xi. The separation of precious metals from base metals in gold-antimony alloys by selective chlorination leaching under controlling potential [C]//KONGOLI F, REDDY G R. Sohn International Symposium on Advanced Processing of Metals and Materials. San Diego: TMS, 2006: 279-292.
[4] LIU Wei-feng, YANG Tian-zu, JIANG Ming-xi, LIU Wei, DOU Ai-chun. Practice of separation precious metals from base metals in gold-antimony alloy by selective chlorination leaching under controlling potential [C]//HOWARD S M. EPD Congress. New Orleans, LA: EPD Congress, 2008: 479-485.
[5] LIU Wei, YANG Tian-zu, ZHANG Du-chao, XIA Xing, LIU Wei-feng. Performance on leaching of antimony trioxide with polyhydric organics in alkaline solutions [C]//Supplemental Proceedings. San Francisco: TMS, 2009, V3: 403-411.
[6] PAN Chao-qun, DENG Xian-he, BIN Wan-da, YANG Tian-zu. Study on treating complex materials containing gold and silver by double metal alkoixdes techenic [J]. Gold, 2000, 21(10): 28-31. (in Chinese)
[7] PAN Chao-qun, DENG Xian-he, BIN Wan-da, YANG Tian-zu. Research on mechanism of leaching antimonous oxide aqueous solution of sodium hydroxide and glycerin [J]. Mining & Metallurgy, 2001, 22(2): 50-54. (in Chinese)
[8] LAKSHIMI D, JANICE L, JANET L W, ZEINAB M, JOEL K, JOSEPH Z. Safety assessment of inhaled xylitol in subjects with cystic fibrosis [J]. Journal of Cystic Fibrosis, 2007, 6: 31-34.
[9] de FAVERI D, TORRE P, PEREGO P, CONVERTI A. Optimization of xylitol recovery by crystallization from synthetic solutions using response surface methodology [J]. Journal of Food Engineering, 2004, 61: 407-412.
[10] MORACHEVSKII A G, DEMIDOV A I, VAISGANT Z I, KOGAN M S. Recovery of lead battery scrap using alkali-glycerol electrolyte [J]. Russ J Appl Chem, 1996, 69: 412-414.
[11] LUIZ C F, ABEL E C S, ROGERIO A D, LUIS O R, DANIELE J C, ADILSON R F, ROMEU C R F, SONIA R B, NERILSO B. Lead recovery from a typical Brazilian sludge of exhausted lead-acid batteries using an electrohydrometallurgical process [J]. Hydrometallurgy, 2002, 65: 137-144.
[12] CARLOS I A, MATSUO T T, SIQUEIRA J L P, ALMEIDA M R H. Voltammetric and morphological study of lead electrodeposition on copper substrate for application of a lead�Cacid batteries [J]. Journal of Power Sources, 2004, 132: 261-265.
[13] CARLOS I A, SIQUEIRA J L P, FINAZZI G A, ALMEIDA M R H. Voltammetric study of lead electrodeposition in the presence of sorbitol and morphological characterization [J]. Journal of Power Sources, 2003, 117: 179-186.
[14] CHEN Wei-ping, TIAN Yi-zhuang, BIAN Ke-jun, ZHENG Yue. Basic electrolytic method for recovery of lead from scrap batteries [J]. Transactions Nonferrous Metals Society of China, 1996, 6: 47-51.
[15] PAN Chao-qun, DENG Xian-he, BIN Wan-da, YANG Tian-zu. An new enrichment technology in treating the gold and silver-bearing materials [J]. Precious Metals, 2001, 22(4): 17-22. (in Chinese)
[16] ZHANG Du-chao, YANG Tian-zu, LIU Wei, LIU Wei-feng, XIE Zhao-feng. Electrorefining of gold-bearing antimony alloy in alkaline xylitol solution [J]. Hydrometallurgy, 2009, 99: 151-156.
[17] MATOS J P F, PROENCA L F A, LOPES M I S, FONSECA I T E, RODES A, ALDAZ A. Electrooxidation of xylitol on platinum single crystal electrodes: A voltammetric and in situ FTIRS study [J]. Journal of Electroanalytical Chemistry, 2007, 609: 42-50.
[18] JING Zhi-hong. The electrochemical oxidation of glycerol on Ni7Zr2 electrode [J]. Journal of Yanbian University: Natural Science, 1994, 20(1): 26-29. (in Chinese)
[19] MATSUOKA K, INABA M, IRIYAMA Y, ABE T, OGUMI Z, MATSUOKA M. Anodic oxidation on polyhydric alcohols on a Pt electrode in alkaline solution [J]. Fuel Cell, 2002, 2: 35-39.
[20] MILTON J A. Organic electrode processes [M]. New York: Reinhold Pub Corp, 1958.
[21] LIU Yong-hui. The measurement technology of electrochemistry [M]. Beijing: Beijing University of Aeronautics and Astronautics Press, 1987: 126. (in Chinese)
[22] JIA Zheng, DAI Chang-song, CHEN Ling. The electrochemical measurement [M]. Beijing: Chemical Industry Press, 2006. (in Chinese)
[23] MACDONALD D D. Transient techniques in electrochemistry [M]. New York and London: Plenum Press, 1977.
[24] JIANG Han-ying. Metallurgical electrochemistry [M]. Beijing: Metallurgical Industry Press, 1983. (in Chinese)
[25] WIKSTROM L L, NOBE K. Electrode kinetics of antimony in alkaline solutions [J]. Journal of Applied Electrochemistry, 1984, 14: 257-263.
[26] BARD A J, FAULKNER L R. Electrochemical methods�C Fundamentals and applications [M]. 2nd ed. New York: John Wiley & Sons, Inc, 2001.
[27] FLETCHER S. Some new formulae applicable to electrochemical nucleation/growth/collision [J]. Electrochim Acta, 1983, 28(7): 917-923.
[28] GRUJICIC D, PESIC B. Electrodeposition of copper: the nucleation mechanisms [J]. Electrochimica Acta, 2002, 47: 2901-2912.
[29] YANG Min-li, HU Zhong-bo. Electrodeposition of bismuth onto glassy carbon electrodes from nitrate solutions [J]. Journal of Electroanalytical Chemistry, 2005, 583: 46-55.
[30] SCHARIFKER B, HILLS G. Theoretical and experimental studies of multiple nucleation [J]. Electrochim Acta, 1983, 28(7): 879-889.
[31] MICHAEL E H, RICHARD G C. A review of the analysis of multiple nucleation with diffusion controlled growth [J]. Journal of Electroanalytical Chemistry, 2003, 549: 1-12.
[32] SCHARIFKER B, MOSTANY J. Three-dimensional nucleation with diffusion controlled growth. Part 1: Number density of active sites and nucleation rates per site [J]. J Electroanal Chem, 1984, 177: 13-23.
[33] DANILOV A I, MOLODKINA E B, POLUKAROV Y M, CLIMENT V, FELIU J M. Active centers for Cu UPD�COPD in acid sulfate solution on Pt(111) electrodes [J]. Electrochimica Acta, 2001, 46: 3137-3145.
[34] RADISIC A, LONG J G, HOFFMANN P M, SEARSON P C. Nucleation and growth of copper on TiN from pyrophosphate Solution [J]. Journal of the Electrochemical Society, 2001, 148(1): C41-C46.
[35] XIANG Sheng-chang, ZHU Ze-shan, ZHAO Chong-tao. Study of eletrocrystallization mechanism of Sb on Cu electrode [J]. Fine Chemicals, 2000, 17(s1): 22-24. (in Chinese)
Sb(��)�ڼ���ľ�Ǵ���Һ�е����������
�� ΰ1,2, ������2, ������1, �Ŷų�2, �״�ï2
1. ���ϿƼ���ѧ ���Ͽ�ѧ�빤��ѧԺ, ���� 471003��2. ���ϴ�ѧ ұ���ѧ�빤��ѧԺ����ɳ 410083
ժ Ҫ������ѭ�������������Ե�λɨ�跨�о�ľ�Ǵ��ڼ�����Һ(����)�еĵ绯ѧ�ȶ��Լ�����ľ�Ǵ�������Һ�еij�������ѧ���������ü�ʱ�������о����ڲ���������ϵĵ绯ѧ�ɺ˻�����ѭ���������Խ��������ľ�Ǵ��ڼ�����Һ�е��ȶ��ԽϺã���-1.20 V~+0.60 V(vs Hg/HgO)��Χ����������ԭ��Ӧ�������ڵ�λ����-1.70 V (vs. Hg/HgO)ʱľ�Ǵ�����缫�Ͽ��ܷ����ֽ⡣�ڸ���ϵ�У����������ϵij��������˲������ᾧ���̡��������Ե���ɨ������������Ļ�ܡ����۴���ϵ�������������ܶȵȶ���ѧ�����ֱ�Ϊ46.33 kJ/mol��0.64 �� 4.40��10-6 A/m2����ʱ������ʵ�������������ڼ���ľ�Ǵ���Һ�еijɺ˻���������ɢ�����µ���ά�����ɺ�ģ�ͣ���ӵ�λ�Ծ����������ʺͺ㶨��λ�µı��;����ܶ�������Ӱ�졣ͨ���������λ��Ծ���ߣ�����������ڸ���ϵ�е���ɢϵ��Ϊ1.53��10-6 cm2/s��
�ؼ��ʣ���������ľ�Ǵ�����ᾧ��ѭ����������ʱ����
(Edited by YANG Hua)
Corresponding author: LIU Wei; Tel: +86-739-64231847; E-mail: liuweidavid@yahoo.com.cn
DOI: 10.1016/S1003-6326(11)61269-7

