�����Ƶ��Һ�����õ���������������������̬A356���Ͻ�����Ʊ�����ĥ����ʴͿ��
��Դ�ڿ����й���ɫ����ѧ��(Ӣ�İ�)2017���2��
�������ߣ�л���� ��Ӣ�� ������ �ܽ��� ����
����ҳ�룺336 - 351
�ؼ��ʣ�A356 ���Ͻ������ƣ�����������������ĥ�𣻸�ʴ
Key words��A356 aluminium alloy; sodium aluminate; plasma electrolytic oxidation; wear; corrosion
ժ Ҫ���������Ƶ��Һ�����õ�������������(PEO)��������̬A356�Ͻ���д����Ʊ���ĥ����ʴͿ�㡣����3�ֲ�ͬŨ�ȵ���������Һ(2��16��24 g/L NaAlO2)�Լ���������Һ(���ԱȽ�)�Ʊ�Ϳ�㡣������-��ʽ��Ħ����ĥ������(��ĥ����Ϊ̼����)�͵绯ѧ��������Ϳ���ĥ�����ʴ���ܡ������������24 g/L NaAlO2��Һ �д���480 s �γɵ�����ĤͿ�������ѵı������ܡ���Ϳ����30 N�غ���Ħ��1800 s����ĥ���ʽ�ԼΪ ~4.5��10-7 mm3/(N��m)��ͬʱ����Ϳ����кܵ͵ĸ�ʴ�����ܶ�(ԼΪ8.81��10-9 A/cm2)����ʵ�鷢�֣�����Ĥ���� ��-Al2O3 �����ܵ�, Ϳ������̶ܳȺ͵���ṹ��֤������������ܡ�
Abstract: Plasma electrolytic oxidation of a cast A356 aluminum alloy was carried out in aluminate electrolytes to develop wear and corrosion resistant coatings. Different concentrations of 2, 16 and 24 g/L NaAlO2 solutions and a silicate electrolyte (for comparison) were employed for the investigation. Wear performance and corrosion resistance of the coatings were evaluated by WC (tungsten carbide) ball-on-flat dry sliding tests and electrochemical methods, respectively. The results show that the coating formed for a short duration of 480 s in 24 g/L NaAlO2 solution generated the best protection. The coating sustained 30 N load for sliding time of 1800 s, showing very low wear rate of ~4.5��10-7 mm3/(N��m). A low corrosion current density of ~8.81��10-9 A/cm2 was also recorded. Despite low ��-Al2O3 content of the coating, the compact and nearly single layer nature of the coating guaranteed the excellent performances.
Trans. Nonferrous Met. Soc. China 27(2017) 336-351
Huan-jun XIE, Ying-liang CHENG, Shao-xian LI, Jin-hui CAO, Li CAO
College of Materials Science and Engineering, Hunan University, Changsha 410082, China
Received 20 December 2015; accepted 1 September 2016
Abstract: Plasma electrolytic oxidation of a cast A356 aluminum alloy was carried out in aluminate electrolytes to develop wear and corrosion resistant coatings. Different concentrations of 2, 16 and 24 g/L NaAlO2 solutions and a silicate electrolyte (for comparison) were employed for the investigation. Wear performance and corrosion resistance of the coatings were evaluated by WC (tungsten carbide) ball-on-flat dry sliding tests and electrochemical methods, respectively. The results show that the coating formed for a short duration of 480 s in 24 g/L NaAlO2 solution generated the best protection. The coating sustained 30 N load for sliding time of 1800 s, showing very low wear rate of ~4.5��10-7 mm3/(N��m). A low corrosion current density of ~8.81��10-9 A/cm2 was also recorded. Despite low ��-Al2O3 content of the coating, the compact and nearly single layer nature of the coating guaranteed the excellent performances.
Key words: A356 aluminium alloy; sodium aluminate; plasma electrolytic oxidation; wear; corrosion
1 Introduction
Mass reduction in vehicles is of special concern to reduce fuel consumption and CO2 emission [1]. That is why the lightmass aluminium alloys, with merits such as high specific strength compared with that of steels, capability of being heat-treated to improve their mechanical properties, are widely used in automotive, aeronautic, and aerospace industries [2]. The alloying element Si can improve the fluidity of the molten aluminium, hence, the Al-Si alloys are specially used in automotive industry, due to their good castability to form products with complex geometries [1-8]. However, poor wear and corrosion resistances often decrease the lifetime of the cast Al-Si alloy components [1,9,10]. Thus, some surface engineering techniques on Al�CSi alloys would be indispensable to their applications.
Plasma electrolytic oxidation(PEO), also known as micro arc oxidation (MAO), is a promising technique to coat the so called valve metals, such as aluminium, magnesium, titanium, zirconium and their alloys with thick ceramic coatings of increased wear resistance, corrosion resistance and other desirable properties (e.g., magnetic and catalytic properties) [11-15]. PEO is a technique evolved from conventional anodizing; however, much higher voltages are maintained during the process and plasma discharges occur on the surface of working pieces. The technique is based on electrochemical background; however, the high temperature plasma discharges induced other complex non-Faradaic processes such as plasma assisted deposition [16] and anomalous gas evolution [13] during the PEO treatments.
The electrolytes used for PEO technique are usually dilute alkaline solution of silicate, phosphate and aluminate, which are environmentally friendly and have important influences on the quality of the PEO coatings [17,18]. The PEO of aluminium alloys has long been investigated and well-established industrial processes, such as KeroniteTM process, are available [11,17-35]; however, most of the research works were carried out in silicate electrolytes [18]. The PEO coatings on aluminum alloy obtained from silicate-based electrolytes are believed to be less wear-resistant than the coating formed in aluminate electrolytes [16], since the phases such as silica and mullite, which are associated with the silicate PEO coatings on aluminum alloys, are of lower hardnesses compared with the phases of ��-Al2O3 or ��-Al2O3, which are the main phase compositions of the PEO coatings formed in aluminate electrolytes. As a result, our recent work [16] has found that the coatings formed in a relatively concentrated electrolyte of 32 g/L NaAlO2 solution displayed extremely high wear resistance, which can sustain dry sliding for 1800 s in a reciprocating ball-on-flat configuration under a load of 100 N against a Cr steel ball. The excellent wear performance may be associated with the improved coating microstructure (single- layered) and also higher coating deposition rates when the electrolyte concentration was increased [16]. Overall, the aluminate electrolytes, especially the concentrated ones, were less used for the PEO of aluminium alloys, although the electrolytes have been employed for the deposition of coatings on metals since the early sixties in last century [36,37]; however, these early studies were based on the DC (direct current) electrical regimes, the properties of the coatings are inferior to that of the modern PEO techniques with AC or pulsed electrical regimes [21].
The Si content in the cast Al-Si alloy has been known to be detrimental to the uniform growth of anodic oxide layer in hard anodizing [38], hence, it may also affect the growth of the PEO coatings on such alloys. Compared with other aluminum alloys, the PEO of Al-Si alloys has been less explored; however, there are still quite a few research works, including the coating growth kinetics, morphology and evaluation of the wear and corrosion properties, etc [1-3,9,10,29,30,39-41]. According to these research works, thick coatings with improved wear and corrosion properties can eventually grow on the whole alloy surface; however, the Si content will affect the growth kinetics of coatings, especially at the initial coating growth stage [39,40]. The same as the PEO of common aluminum alloys, the above mentioned works on the Al-Si alloys are mostly based on silicate electrolytes. To the knowledge of the present authors, the PEO of Al-Si alloy in aluminate electrolytes, especially the moderately concentrated ones, has not been investigated yet. As a result, it will still be of interest to know the PEO behavior of Al-Si alloy in such electrolytes and the properties of the associated coatings.
In the present work, the PEO of a cast A356 aluminum alloy from an automotive wheel was carried out in aluminate electrolytes with different concentrations and the wear resistance and the corrosion resistance of the resultant coatings were evaluated by ball-on-flat dry sliding wear tests and electrochemical tests, respectively. The results show that the coatings formed in an electrolyte of 24 g/L NaAlO2 solution display an excellent combination of wear resistance and corrosion resistance, showing its potential application in areas such as automotive industry. Furthermore, it was normally believed that the ��-Al2O3 phase is highly desired for the PEO coatings on aluminum alloys [33,34,42]; however, the present study demonstrates that the single-layered coatings with the predominant phase of ��-Al2O3 also has superior wear resistance, showing that the microstructure is also determinative for the wear performance.
2 Experimental
Small blocks of specimen were cut from a cast A356 aluminium alloy (a hypoeutectic Al-Si alloy) automotive wheel, and then the specimens were mounted in epoxy resin to provide working areas of 10 mm �� 20 mm. The composition (mass fraction) of the alloy is: 7.014% Si, 0.293% Mg, 0.011% Sr, 0.128% Ti, 0.005% Zn, 0.108% Fe, 0.002% Cu, 0.002% Mn, 0.002% Cr, 0.004% Ni, 0.001% Pb, 0.001% Ca, 0.001% Sn, and balance Mg. The specimens were successively polished to a 2000-grit SiC finish, degreased in ethanol, rinsed in distilled water, and finally dried in a stream of warm air. During the PEO, the specimen was used as the anode and a stainless steel plate was used as the cathode. A 5 kW pulsed power source was used in this work. The detail of the experimental setup and power supply can be found in our previous paper [16].
Aqueous solutions containing 2, 16 and 24 g/L NaAlO2 solutions respectively, each with the addition of 1 g/L KOH solution, were employed in this work. Coatings were also prepared in a silicate electrolyte (8 g/L Na2SiO3��9 H2O + 1 g/L KOH) for comparison. For the PEO treatment of the A356 alloy in 16 and 24 g/L NaAlO2 solutions, the alloy was first PEO-treated in 2 g/L NaAlO2 solution for 1 min to form a precursor coating. The reason for the application of a precursor coating is to avoid the field-assisted dissolution phenomenon during the PEO of aluminum alloy in alkaline solutions which have a tendency to attack the aluminium alloy substrate [18]. A cooling system equipped with magnetic stirring was employed to cool the electrolyte below 40 ��C. Pulsed bipolar constant current regimes, using average positive and negative current densities of ~0.20 and 0.13 A/cm2 respectively, a frequency of 1000 Hz and a duty cycle of 20% are employed in the present study. An oscilloscope (Tektronix TDS 1002C-SC) was used to monitor the current waveforms.
An eddy current thickness gauge (TT260, Time Group, Beijing) was used to measure the coating thickness. The morphology of the surface or cross section of the coatings was determined by scanning electron microscopy (SEM, QUANTA 2000 or Nova NanoSEM 230, FEI, USA) assisted by energy dispersive spectroscopy (EDS). The surface roughness of the coatings was measured by a stylus profilometer (Mitutoyo SJ-210). Phase compositions of the coatings were determined by X-ray diffraction (XRD) with a Rigaku D/MAX 2500 diffractometer (Cu K�� radiation, Bragg-Brentano geometry, 40 kV, 250 mA, step size 0.02��, count time 1 s). Both the PEO-treated samples (with substrate) and chemically stripped coatings were examined by XRD. For the stripping of the coatings, the PEO-treated samples were immersed in a concentrated sodium hydroxide solution at room temperature, and the coatings were collected and ground into powers for the subsequent XRD examination.
The tribological tests of specimens were evaluated on a CETR UMT-3 test system. A WC (tungsten carbide) ball (composition: 94% WC, 6% Co; diameter 9.525 mm) was used to slide against the flat PEO-treated specimen in a linear, reciprocating motion. The hardness of the ball is about HRA 91, which is equivalent to about HV 1500. The load for the tests was 30 N, with a stroke length of 7.2 mm and a frequency of 5 Hz. The profiles of the wear scars were examined by the same stylus profilometer. Microhardness measurements were made on the cross section of a coating formed for 480 s in 24 g/L NaAlO2 solution, using an MHV-2000 digital microhardness tester with load of 25 g and dwell time of 10 s.
Electrochemical measurements were performed in 3.5% NaCl (mass fraction) solution at room temperature (~25 ��C) to evaluate the corrosion resistance of the coatings. A CHI660 electrochemical workstation was used for the measurements, employing a 3-electrode configuration, with the specimens as the working electrode, a platinum plate as the counter electrode, and a saturated calomel electrode as the reference electrode, respectively. Open circuit potential (OCP) of the samples was first recorded for an immersion time of 1 h, then potentiodynamic polarization curve was performed at a scan rate of 0.5 mV/s from -0.5 V below the OCP towards more anodic potentials.
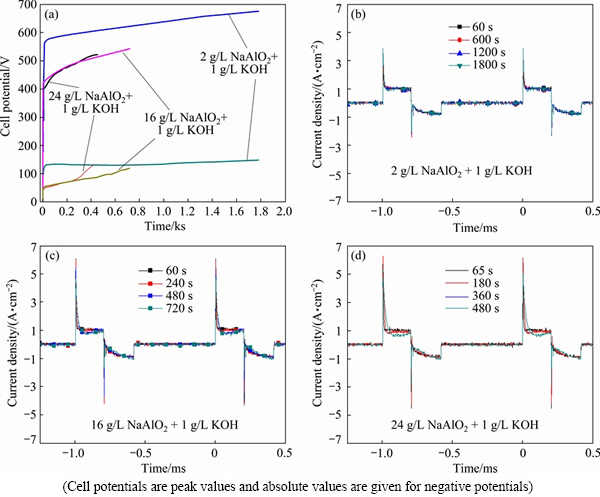
Fig. 1 Cell potential-time responses (a) and real time waveforms of current densities (b-d) during PEO of A356 alloy in aluminate electrolytes with different concentrations
3 Results and discussion
3.1 Cell potential-time responses, current waveforms and coating growth kinetics during PEO processes
Figure 1 shows the cell potential-time responses and real time waveforms during the PEO treatments of the cast A356 alloy in different aluminate electrolytes. The positive cell potential-time responses of all samples show a rapid initial rise, after which an inflexion appears and cell potential rises slowly to the final potential. The positive potential attained for the PEO in dilute electrolyte is higher than that in the more concentrated electrolytes, which is attributed to fact that the lower conductivity of the dilute electrolyte causes a higher potential drop on the electrolyte [16]. The current waveforms are shown in Figs. 1(b)-(d), which are nearly overlapped during the PEO processes, showing the stable output of the power supply. The average positive and negative current densities for the PEO process have been determined by integration of the waveforms, showing values of ~0.20 and 0.13 A/cm2 for the positive and negative current densities, respectively.
Figure 2 shows the dependence of coating thickness on the time of PEO at different concentrations of sodium aluminate, using thicknesses determined by thickness gauge. The coating formed in 2 g/L NaAlO2 solution grows at a lower rate to 600 s, after which the coating shows an increased growth rate, forming a ~47 ��m thick coating at 1800 s (an average growth rate of ~1.6 ��m/min). The coating growth rate increases significantly with the increase of the concentration of electrolyte, and a 41 ��m coating, following a treatment time of 720 s, was formed in 16 g/L NaAlO2 solution, compared with a 38 ��m coating in 24 g/L NaAlO2 solution after 480 s. The growth rates in the two latter electrolytes are ~3.4 and 4.8 ��m/min, respectively. The results are similar to those found for the PEO of an Al-Cu-Li alloy [16]. It is believed that more electrolyte species are decomposed by the high temperature plasma during PEO, contributing to the higher coating growth rate when the electrolyte concentration is increased [16].
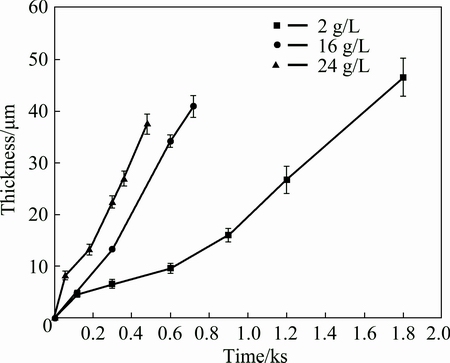
Fig. 2 Dependence of coating thickness on time of PEO for A356 aluminium alloy in alkaline electrolytes of sodium aluminate with different concentrations
3.2 Surface and cross-sectional morphologies of coatings formed in different concentrations of NaAlO2
Figure 3(a) shows the backscattered electron image of the substrate of the present A356 alloy. The alloy is a hypoeutectic Al-Si alloy which consists of a dendritic ��(Al) primary phase separated by Al-Si eutectic, and the eutectic consists of fine silicon crystals, forming a network with connected branches or large patches along the primary ��(Al) phase grain boundaries [2,39]. The microstructure in Fig. 3(a) is similar to that of the Al-Si alloys reported in Refs. [2,39]: light colored fine silicon particles, normally in the size of ~10 ��m, are clearly seen in the network of eutectic. Figures 3(b)-(h) show the evolution of the surface morphology for the PEO coating formed in the dilute aluminate electrolyte (2 g/L NaAlO2). The morphologies of the coatings formed for 40 s are displayed in Figs. 3(b)-(d), which correspond to a time shortly after the inflexion in the cell potential-time curve (Fig. 1(a)). The most evident feature is the presence of a network of white materials in the lower magnification image, and at higher magnifications, the network appears in long strips, nodulars or patches of loosely piled materials. Obviously, these features should be a result of the oxidation of the Al-Si eutectic of A356 alloy. It is also noticed that these features protrude above the background of the coating materials and many cracks are found with them. The protruding of oxide film on the Si phase has also been observed by other researchers, it is thought that the lower melting points of Si (~1410 ��C) , SiOx (<1800 ��C) and Al��Si��O compounds [39], and the higher Pilling- Bedworth ratio of Si (2.22) to Al (1.28) [9] resulted in the preferential oxidation of the Al-Si eutectic and a greater volume expansion of the oxidized product, respectively. Apart from these features from the oxidation of Al-Si eutectic, the sample surface is dominated by patches of oxides with an undulating topography at higher magnifications, which originate from the oxidation of the primary ��(Al); however, the original polished metal surfaces still remain in some particular regions (see Figs. 3(c) and (d)). The boxed areas for different features in Fig. 3(c) were analyzed by EDS, and the results are listed in Table 1. The results show that Al and O are the main compositions for the different features; however, increased contents of Si are found in boxed areas of B and D for the oxidized Al-Si eutectic. The EDS spectrum for the highest Si content (area D) is presented in Fig. 3(e). Compared with the PEO of Al-Si alloy in silicate electrolytes [9,39], the EDS spectrum on the oxide of Al-Si eutectic of the present coating shows significantly lowered Si content. The difference may indicate that silicon species from the electrolyte have contributed to the coatings of the previous researchers. The EDS spectrum performed on the protruding materials indicates that both the silicon crystals in the eutectic and their adjacent Al matrix must have been oxidized to form the product of Al��Si��O, accompanied by greater volume expansion. The Si/Al mass ratio for the boxed area D is ~0.1:1, which is lower than the Si/Al mass ratios (0.3:1-1.5:1) for the Al��Si��O stiochiometry in Ref. [27]. However, Al��Si��O compounds with very low Si/Al mass ratios did exist, for example, Al1.7Si0.15O2.85 (PDF No. 29-0086, Si/Al mass ratio of ~0.09:1) and Al1.96Si0.05O2.95 (PDF No. 37-1483, Si/Al mass ratio of ~0.03:1). A coating formed for a shorter time of 20 s at the forming potential of 570 V, which corresponds to the inflexion of the curve of cell potential-time in Fig. 1, was also examined, revealing the same features as the coating formed at 40 s. It was observed during the PEO of the cast A356 alloy in 2 g/L NaAlO2 solution that visible sparks and distinct acoustic emission occurred after ~13 s at a cell potential of ~512 V. It was suggested by WANG and NIE [39] that the tip/corner effect of the electrical field concentration caused the first appearing of the sparks at the interface of Si crystals and Al matrix, leading to the preferential oxidation of the Al-Si eutectic. The preferential oxidation of the Al-Si eutectic may also be related with the passivation tendency or conductivity difference between the Si phase and the substrate of ��(Al) phase.
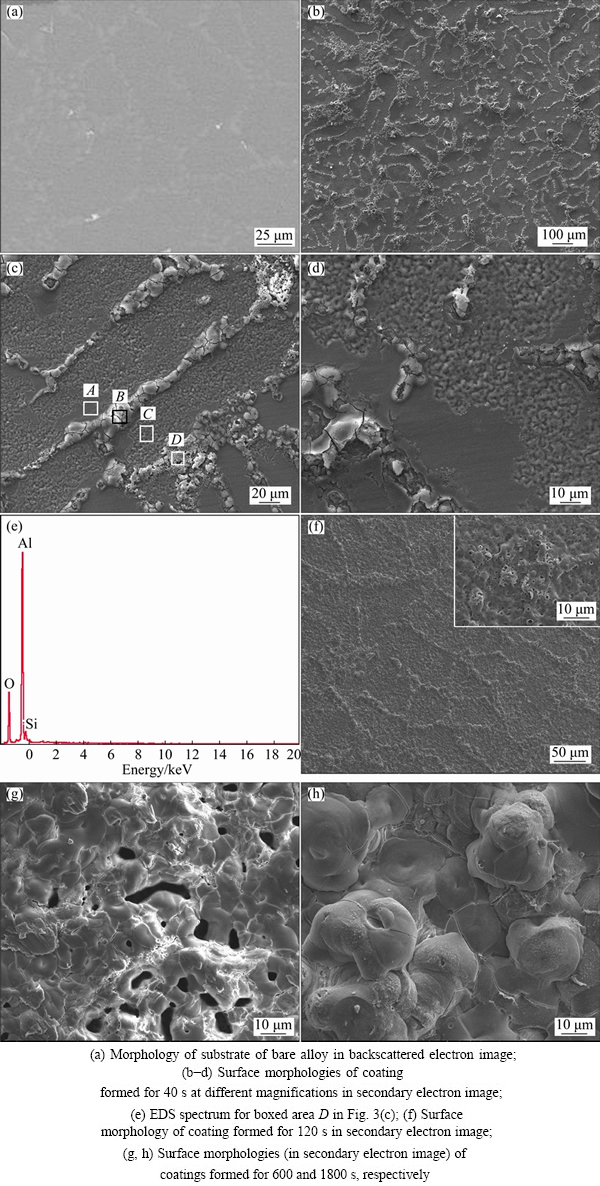
Fig. 3 SEM images showing A356 aluminium alloy substrate and coatings formed in 2 g/L NaAlO2 + 1 g/L KOH solution for different time
Table 1 EDS analyses of boxed areas in Fig. 3(c)
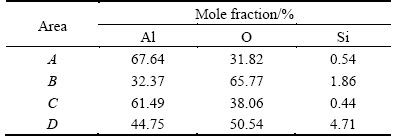
Figure 3(f) shows the morphology of the coating following a treatment time of 120 s. At this time, the sample surface was uniformly covered by oxides; however, the feature from the previous network of oxidized Al-Si eutectic was still visible. When the oxidation time extended to 600 s, the morphology of the coating was featured by pancakes with diameters of ~10 ��m along with small pores and elongated pores (~20 ��m in length). The influence of the Al-Si eutectic on the coating morphology can hardly be discerned at this stage (see Fig. 3(g)). Figure 3(h) shows the morphology of the coating formed for 1800 s, which is featured by large pancake structures, with diameters more than 20 ��m. Different features on PEO coatings were believed to be related to types of discharges. HUSSEIN et al [43] proposed that there are three types of discharge during PEO: types A or C, which occur at the oxide/electrolyte interface and within pores and cracks in the outer coating, respectively, and a strong discharge type of B, which occurs from the substrate and penetrates the coating. Types A or C result in coating features that contain relatively large amounts of electrolyte-derived species, while type B corresponds to the features with a relatively great amount of substrate species. The pancakes revealed here are of typical feature of the PEO coatings of certain valve metals, which is thought to be caused by types of strong discharges, i.e., the type B discharge which leads to coating/substrate interface [43], or type E discharge which penetrates the coating outer layer and leads to the large internal pores [21]. Our recent work suggests that the high electrical resistance of the oxide (in this case, alumina) favors the occurrence of the strong discharge types [13].
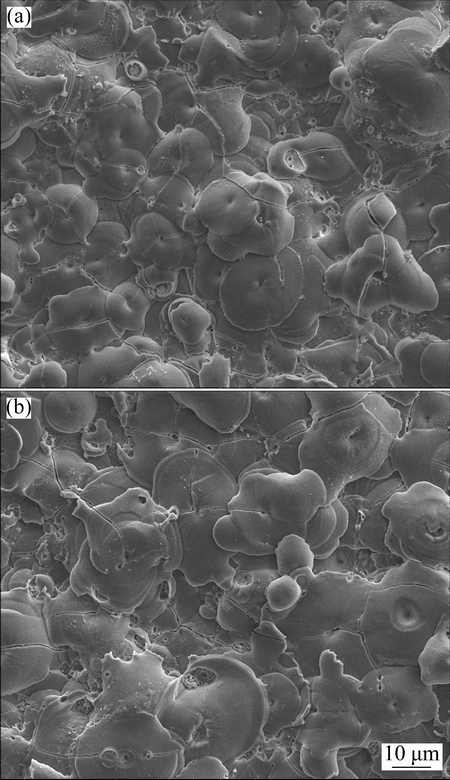
Fig. 4 SEM images (secondary electron images) showing surfaces of coatings formed in 16 g/L NaAlO2 solution for 720 s (a) and in 24 g/L NaAlO2 solution for 480 s (b)
The evolution of the coating morphology in 2 g/L NaAlO2 solution shows that the Si content only affects the morphology at earlier stage of PEO, whereas the effect of Si content can hardly be found from the morphology of the thicker coatings. The result is similar to that of the PEO of such alloys in silicate electrolytes [9,39]. For the PEO treatment in 16 and 24 g/L NaAlO2 solutions, the coatings were grown on the alloy which was covered by a thin precursor coating formed in the dilute electrolyte for 60 s. The surface morphologies of a coating formed for 720 s in 16 g/L NaAlO2 solution and a coating formed for 480 s in 24 g/L NaAlO2 solution are displayed in Figs. 4(a) and (b), respectively. Both coatings are featured by pancakes, which resembles the coating formed for longer time in dilute electrolyte (Fig. 3(h)). However, the average diameter of those pancakes in Fig. 4 seems to be somewhat smaller than that in Fig. 3(h). The reduced size of the pancake may indicate a lowered intensity of the types B or E discharges. The surfaces of the coatings formed in more concentrated electrolytes also seem to be flatter than the coating formed in the dilute electrolyte. The surface roughness values (Ra) of the coatings formed in 2, 16 and 24 g/L NaAlO2 solutions for different time of 1800, 720 and 480 s are (5.79��0.73), (2.89��0.31) and (3.22��0.12) ��m, respectively. The results verified the suggestion from SEM observation.
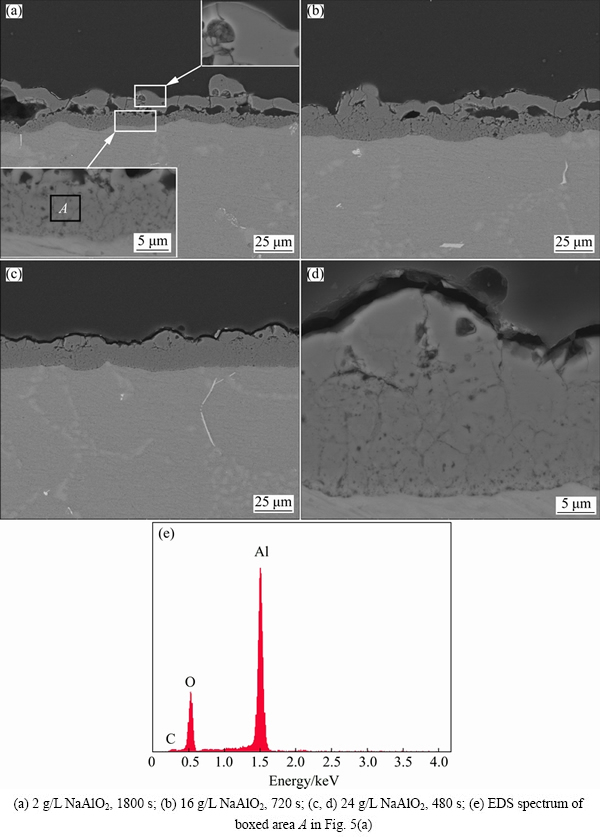
Fig. 5 SEM images (backscattered electron images) and EDS spectrum of cross sections of coatings formed in different aluminate electrolytes for different time
The cross sections of the coatings formed in different concentrations of NaAlO2 solutions are presented in Fig. 5. The coating formed in 2 g/L NaAlO2 solution for 1800 s displays a bi-layered structure (Fig. 5(a)), showing a denser outer layer and a less compact but adherent inner layer (see the insets). Large, lateral pores exist between the outer and inner layers. This kind of coating structure is typical for the PEO of aluminum alloys [21,25] and zirconium alloys [44] under pulsed current regimes in dilute silicate or aluminate electrolytes. In this work, the development of this bi-layered structure with large internal pores has been ascribed to the gas evolution associated with the strong types of E discharge during PEO [45]. It should be pointed out that the present discussion on the coating structure disregards the barrier layer at the coating/substrate interface. A barrier layer at the coating/substrate interface is usually revealed for the PEO coatings on aluminium alloys by transmission electron microscopy (TEM) [33,46] and the layer has an amorphous nature, which is thought to be caused by the rapid cooling at that interface [16]. The existence of a barrier layer at the coating/substrate interface for the present coatings is also possible; however, the resolution of the SEM images in Fig. 5 cannot verify this point. The thickness of the coating formed in 16 g/L NaAlO2 solution seems to be higher than the coating formed in the dilute electrolyte, even though the former is formed with much shorter duration of 720 s. The coating formed in 16 g/L NaAlO2 solution also shows an increased thickness in inner layer, and a reduced number and size of the lateral pores. Figures 5(c) and (d) show the cross section of the coating formed in 24 g/L NaAlO2 solution for 480 s. The homogeneity of the coating is much improved and the coating could be viewed as a sing layered one. However, a closer examination shows that the outer part of the coating still has a compacter nature and a few larger cracks could be occasionally found between the compact outer part and inner coating (Fig. 5(d)). Plenty of fine cracks can be found with the inner part of all the coatings, they are possibly the grain boundaries of the coating materials, since these fine cracks are difficult to find in secondary electron images. The EDS analyses at different locations of the cross section for both the coatings formed in dilute (2 g/L) and concentrated (24 g/L) electrolytes were made. The results show that the coatings almost consist of Al and O only, very little or no Si is detected. Figure 5(e) shows a representative EDS spectrum performed on the inner layer of the coating formed in 2 g/L NaAlO2 solution.
3.3 Phase compositions of coatings
The XRD patterns for the PEO-coated A356 alloy in 2, 16 and 24 g/L NaAlO2 electrolytes for 1800, 720 and 480 s, respectively, are presented in Fig. 6(a). The phase compositions of the different coatings are similar, with ��-Al2O3 as the main phase component and a small amount of ��-Al2O3 (the relative content of ��-Al2O3 and ��-Al2O3 in the coatings can be represented by the integrated intensities of the (113) ��-Al2O3 and (400) ��-Al2O3 peaks, respectively [16]). Strong peaks of Al and peaks of Si (from silicon crystals of the eutectic) are presented in the XRD patterns of the coatings, which indicate that the coatings are penetrable to the X-ray. In order to avoid the peaks from the substrate, XRD test for the chemically stripped coatings was performed. The results are presented in Fig. 6(b). The patterns are nearly the same as those in Fig. 6(a), except for the absence of the peaks from the substrate. An additional alumina phase (��-Al2O3, PDF No. 00-056-1186), which are more evident with 16 g/L NaAlO2 solution, was also clearly detected besides the ��- and ��-Al2O3.
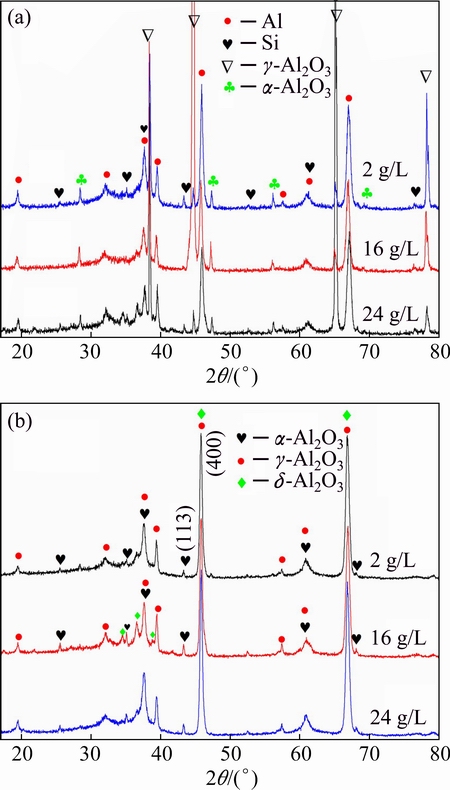
Fig. 6 XRD patterns for PEO-coated alloys (a) and stripped coatings (b) formed in 2, 16 and 24 g/L NaAlO2 solutions for 1800, 720 and 480 s, respectively
The phase compositions of the present coatings are significantly different from those coatings formed on an Al-Cu-Li alloy in electrolytes of different concentrations of NaAlO2 [16]. For the Al-Cu-Li alloy, ��-Al2O3 is one of the major phases in the coatings, and its content increases with the increase of the concentration of NaAlO2 [16]. The lower ��-Al2O3 content in the present coatings indicates that the alloying elements from the substrate have a great influence on the mass ratio of ��-Al2O3 to ��-Al2O3. Previous studies showed that the alloying elements of Mg [33,34], Zn [35] and Si [3] had the ability to suppress the formation of ��-Al2O3. In the present study, Si is the main element that affects the phase transformation, since the compositions of Mg and Zn are very little in the A356 alloy. It is assumed that the alloying elements such as Si can diffuse into the ��-Al2O3 crystal lattice, substitute Al atoms and change the phase transformation kinetics of alumina phases [3]. However, more details about the phase suppression mechanism still need to be explored. It should be pointed out that Si can hardly be detected by the previous EDS analyses on the coating cross sections, which implies that the Si content in the coatings is low. The XRD pattern of the stripped coating also shows the absence of Si in the coatings. Hence, the phase transformation of ��-Al2O3 to ��-Al2O3 should be sensitive to the trace amount of Si element in the coatings.
3.4 Microhardness of coating formed in 24 g/L NaAlO2 solution
The microhardness of the coating formed for 480 s in 24 g/L NaAlO2 solution was measured. Figure 7 shows a typical indent on the cross section of the coating. Seven test points were made on the cross section, showing the highest and the lowest hardness values of HV 1737 and HV 1119, respectively. The average hardness value of the coating is HV (1352��251), which is equivalent to ~15 GPa. The result shows that the microhardness of the present coating is close to the theoretical hardness value of ��-Al2O3, which is 17 GPa [16]. Considering the fact that the main phase of present coatings is ��-Al2O3, the hardness value implies that the coating is quite compact. The hardness values of other coatings formed in less concentrated electrolytes were not measured; however, they are likely similar to that of the coating formed in 24 g/L NaAlO2 solution, since the phase composition and local SEM images of these coatings are similar, although large pores are found with the coatings formed in less concentrated electrolytes.
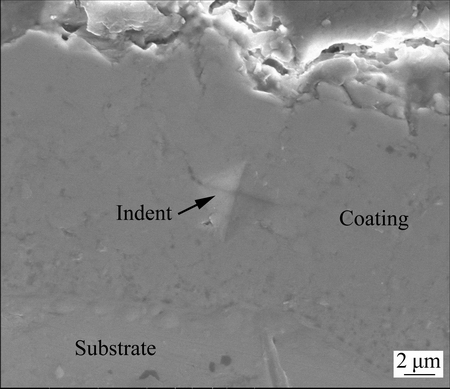
Fig. 7 SEM image showing indent after microhardness test on cross section of coating formed in 24 g/L NaAlO2 solution for 480 s
3.5 Wear performance of coatings
It has been well known that ��-Al2O3 is the most stable and hardest phase among various polymorphs of alumina; its presence will be beneficial to the wear performance of the coatings. The lack of a sufficient amount of ��-Al2O3 in the present coatings may be a disadvantage to their wear performances. However, the present coatings with the main phase of ��-Al2O3 still have quite good mechanical properties, showing a high hardness value of ~15 GPa by the microhardness tests. Furthermore, the microstructure of the coating may also be important for the wear performance of the coatings. For example, the increased porosity in a coating formed in 56 g/L NaAlO2 solution, though with higher ��-Al2O3 content, reduced the wear resistance of the coated Al-Cu-Li alloy [16].
The wear performances of the previous coatings formed in 2, 16 and 24 g/L NaAlO2 electrolytes for 1800, 720 and 480 s respectively and a 38 ��m thick silicate coating formed for 1200 s under the same electrical condition were evaluated by WC ball-on-flat dry sliding wear tests under a higher load of 30 N. Figure 8(a) shows the coefficient of friction as a function of sliding time for the coating formed in 2 g/L NaAlO2 solution. The coefficient of friction rose from ~0.37 to ~0.69 between 0 and 134 s, after which the coefficient firstly decreased slightly, reaching ~0.62 at ~154 s and then decreased more rapidly to the lowest point of ~0.48 at ~170 s. The point at ~154 s corresponds to the ��transition point��, which means the end of coating life [47]. After ~170 s, the coefficient of friction began to exhibit large fluctuations between ~0.52 and ~0.75. The test was terminated at a time of ~320 s, since the coating was heavily worn as observed by naked eye. The overall behaviors of the coefficient of friction for the coating formed in 16 g/L NaAlO2 solution and the coating formed in silicate electrolyte are similar to those of the coating formed in 2 g/L NaAlO2 solution; however, the transition point for different coatings occurred at different time, which was delayed to ~265 s for the coating formed in 16 g/L NaAlO2 solution but happened at an earlier time of ~80 s for the silicate coating. The tests for the above coatings were stopped at a similar sliding time of ~320 s. The different transition time implies that the coating formed in 16 g/L NaAlO2 solution is the most wear resistant among the three coatings, while the silicate coating has a lowest wear resistance. In contrast, the coating formed in 24 g/L NaAlO2 solution for 480 s displays a different behavior during the dry sliding test. The coefficient of friction for the coating rose from the highest initial value of ~0.61 at 0 s to ~0.69 at 114 s, after which the coefficient decreased in a very low rate to a final value of ~0.63 at 1800 s. No transition point was observed for this coating.
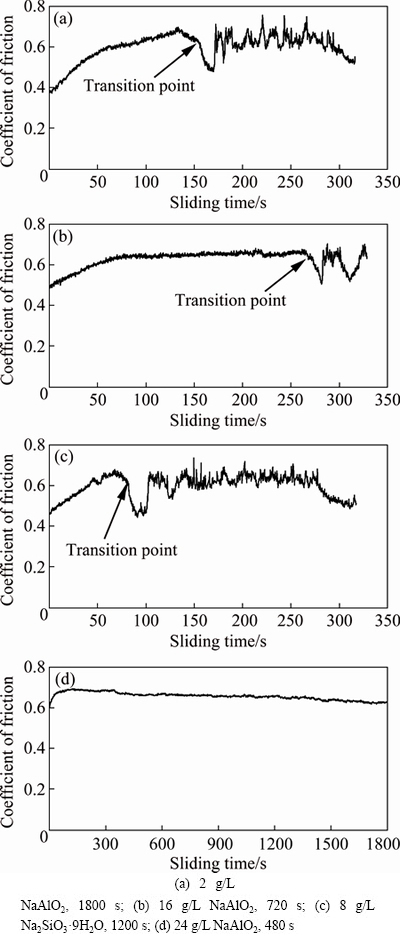
Fig. 8 Coefficient of friction as function of sliding time under 30 N for coatings formed in different electrolytes for different time (Coatings possessing similar thicknesses)
The morphologies of the coatings after dry sliding tests are presented in Fig. 9. It is clearly shown in Figs. 9(a)-(c) that the silicate coating and the coatings formed in 2 and 16 g/L NaAlO2 solutions are penetrated by the WC ball, following a short sliding time of ~320 s. The silicate coating shows the widest wear scar of ~2.6 mm, followed by ~2.1 mm wear scar for the coating formed in 2 g/L NaAlO2 solution. The underlying substrate is heavily ploughed, suggesting a wear mechanism of microcutting. The wear scar on the coating formed in 16 g/L NaAlO2 solution is narrower, showing a width of ~1.3 mm; however, the top coating is also removed and a deep trench appears. Unlike the former coatings, the coating formed in 24 g/L NaAlO2 solution displays a much improved wear resistance, showing the narrowest wear scar of ~0.8 mm after sliding time of 1800 s. The morphologies of the wear scars are presented in Figs. 9(d)-(f). The wear scar exhibits a relatively smooth, but flaky morphology at higher magnifications. The flaky morphology is caused by the distribution of numerous microcracks on the surface of the wear track. The microcracks, normally between 10 and 50 ��m, may extend to any direction; however, they are usually found in the transverse direction or parallel to the sliding direction. EDS analyses performed on the wear track show the presence of a small amount of W (~3.8% to ~7.8%, mass fraction) in the surface layer (see Fig. 9(g)). The transfer of the components from the ball indicates that a transfer layer is formed on the wear track. The transfer layers are often found with the tribological tests of PEO coatings; they are formed by tribo-oxidation of the materials of the counterface under the combined action of mechanical stresses and friction heating [47].
The cross sectional profiles of the wear scars for the coatings formed in 16 and 24 g/L NaAlO2 solutions, following sliding time of 320 and 1800 s, respectively, are compared in Fig. 10. Although the coating formed in 16 g/L NaAlO2 solution was tested for only a short time of 320 s, a wear scar depth of ~198 ��m was formed on the sample. In contrast, the coating formed in 24 g/L NaAlO2 solution only shows a negligible depth of ~13 ��m. The wear rates for the two coatings are calculated according to the wear depth profiles and other testing parameters such as length of wear scar (7.2 mm) and frequency of the sliding (5 Hz). The coating formed in 16 g/L NaAlO2 solution shows a higher wear rate of ~1.7��10-3 mm3/(N��m). However, the higher wear rate mostly resulted from the failure of the coating after the transition point; the low mechanical properties of the underlying A356 substrate cannot resist the high load of 30 N. In contrast, a very low wear rate of ~4.5��10-7 mm3/(N��m) was recorded for the coating formed in the concentrated aluminate electrolyte. The wear rate was only ~1/3800 that of the former coating formed in 16 g/L NaAlO2 solution. This value is also lower than the wear rates of the PEO coatings on aluminum alloys reported elsewhere, for example, the wear rates of the PEO coatings on 6082-T6 aluminium alloy, formed with or without the incorporation of ��-Al2O3 nanoparticles in a silicate electrolyte, and tested under a WC ball-on-disc configuration at the loads of 2, 5 and 10 N, have been shown to be within the range of 1.2��10-5-9.3��10-6 mm3/(N��m) [42].
The excellent wear resistance of the coating formed in 24 g/L NaAlO2 solution shows that the lower ��-Al2O3 content in the coating has not too much influence on the performance of the coating. In contrast, the present experimental results show that the microstructures of the coatings strongly affected the wear performance. The low wear resistances of the coatings formed in less concentrated aluminate electrolyte could be attributed to their less compact nature (see Fig. 5). The large pores between the outer and inner layers were detrimental to the mechanical properties of coatings at the local positions. Under the load from the sliding ball, the outer layers above those pores were broken, which damaged to the integrity of the coatings, and moreover, the broken debris may be trapped in the wear track, which provided an additional microcutting effect on the underlying coating, leading to the fast failure of the coatings. More and larger pores were found with the coating formed in dilute aluminate (2 g/L NaAlO2 solution); hence, an earlier transition point and lower wear resistance of the coating were found compared with the coating formed in 16 g/L NaAlO2 solution. The lowest wear resistance of the silicate coating may result from the incorporation of Si into the coating, which will lower the mechanical properties of the coating materials as discussed previously [16].
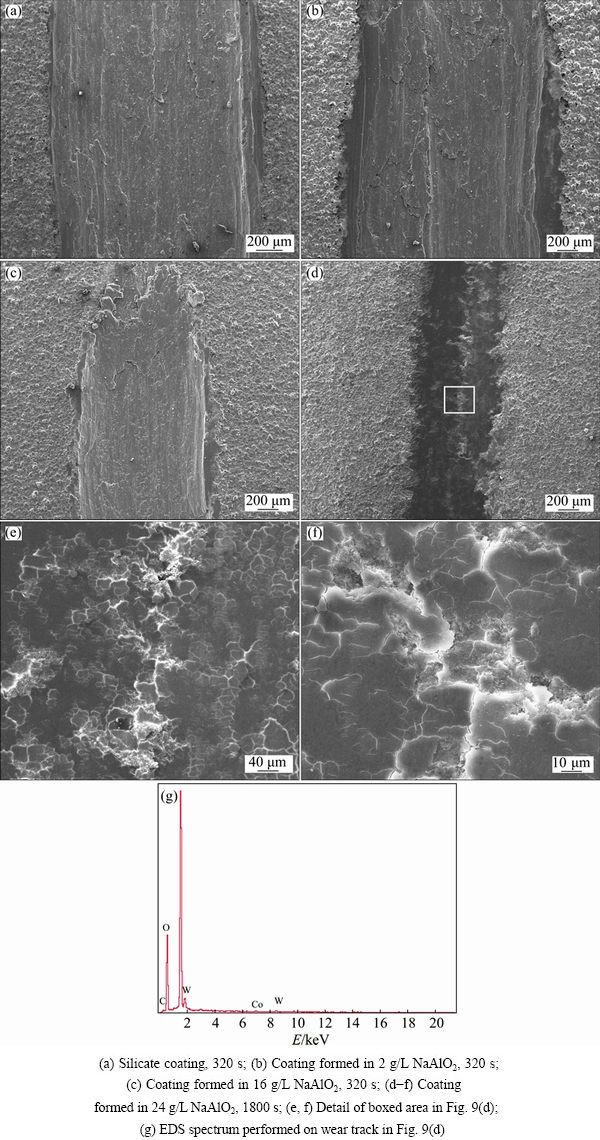
Fig. 9 SEM images (secondary electron images) and EDS spectrum of wear scars on different coatings after dry sliding tests
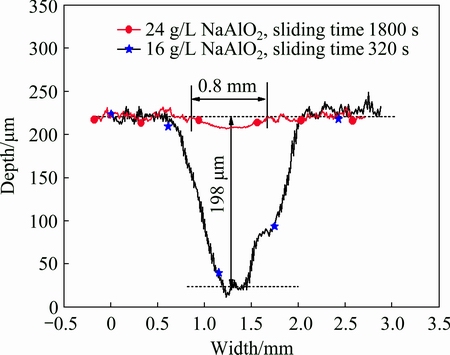
Fig. 10 Cross sectional profiles of wear scars after dry sliding tests under load of 30 N on coatings formed in 16 and 24 g/L NaAlO2 respectively
In this investigation, the wear performances of the coatings formed in higher concentrations of NaAlO2 solutions, such as in 32 and 56 g/L, were not performed, since the coating formed in 24 g/L NaAlO2 solution possessed quite good wear resistance. According to our experience, the wear performance of the coatings would be further increased, however, not too much. Furthermore, a very high electrolyte concentration will lead to some disadvantages, such as the high cost and a higher tendency of decomposition of the electrolyte [16]. It is difficult to compare the wear resistances of the present coatings with those coatings reported in our previous work in Ref. [16], due to the different configurations of wear test. A coating formed on Al-Cu-Li alloy in 32 g/L NaAlO2 solution can sustain a load of 100 N for 1800 s [16]; however, the couterface was a Cr steel ball, whose hardness is lower than the present WC ball. Even though, the best coating in Ref. [16] has also been evaluated using the present WC ball, the result shows that the coating can sustain a sliding time of 1800 s under a load of 50 N, but it failed under 80 N. The results justified our above views about the wear performance of the present coatings.
3.6 Corrosion tests
The corrosion protections afforded by the above coatings were also measured using electrochemical methods. Open circuit potentials (OCP) of the uncoated alloy and PEO coated alloy immersed in 3.5% NaCl (mass fraction) solution for 3600 s are recorded in Fig. 11. The OCP of the uncoated A356 was kept at a relatively negative level during the whole immersion process, typically between ~-0.84 and -0.71 V. Moreover, fluctuations were usually found with the OCP, showing the largest amplitude of ~110 mV. The fluctuations of OCP have also been found with other types of aluminium alloy during the corrosion in NaCl solution, for example, an AA7075 aluminium alloy [48]. The fluctuation is sometimes treated as a kind of electrochemical noise (EN), which can be analyzed for the corrosion mechanism [48-50]. The fluctuations in OCP can be explained by Evans diagram, which is related with the balance between the anodic process and cathodic process of the corrosion reactions [48]. The fluctuations in the OCP possibly imply that the alloy experiences the repeating processes of activation- repassivation for pitting corrosion. It is noted in Fig.11 that the fluctuation in OCP was significantly reduced after being coated with PEO coatings, which shows improved corrosion resistances. The OCP of the coating formed in 2 g/L NaAlO2 solution shows an initial potential value of ~-0.55 V and it decreases gradually to ~-0.69 V at 1520 s, after which the OCP is relatively stable, to a final potential of ~-0.70 V. The sample with the silicate PEO coating shows an initial potential of ~-0.64 V, then the OCP decreases slightly to ~-0.71 V at ~645 s, after which it fluctuates around that value, except for a short duration which surges to higher value of ~-0.6 V before reaching a final potential of ~-0.72 V. The OCP behavio of the sample coated in 16 g/L NaAlO2 solution resembles that of the silicate coating, showing small fluctuations and similar initial and final potential values. The coating formed in 24 g/L NaAlO2 solution displays the highest initial potential of ~-0.35 V; however, it decreases to ~-0.4 V at 363 s and then a sudden drop is observed on the OCP-time curve, after which its OCP behavior is similar to that of the silicate coating, reaching a final value of ~-0.65 V.
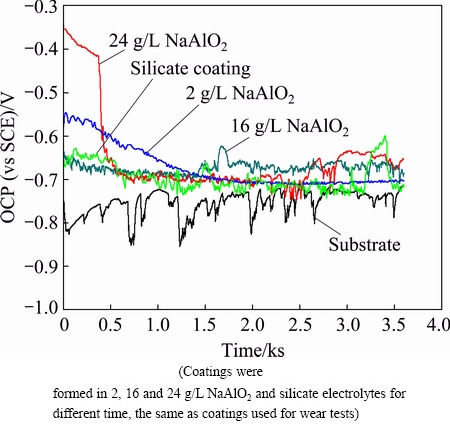
Fig. 11 OCP-time responses recorded in 3.5% NaCl solution for uncoated and coated A356 aluminium alloy
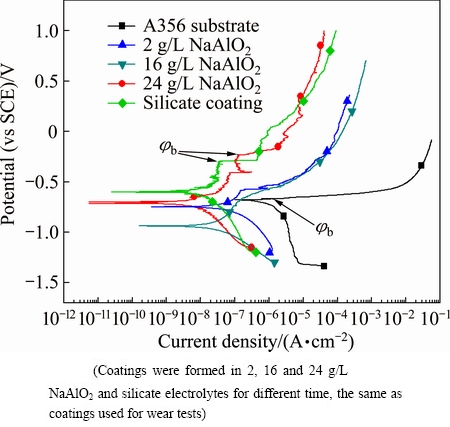
Fig. 12 Potentiodynamic polarization curves recorded in 3.5% NaCl solution after OCP tests for uncoated and coated A356 aluminium alloy
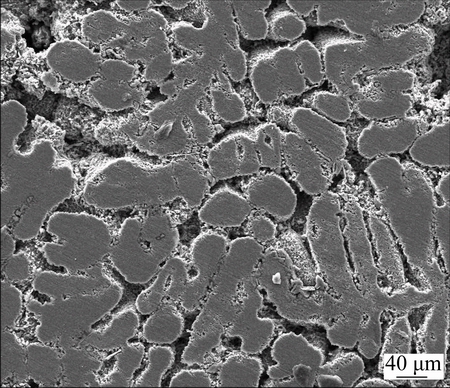
Fig. 13 SEM image (secondary electrons) of surface of untreated A356 aluminium alloy after potentiodynamic polarization test
The potentiodynamic polarization curves performed after the OCP measurement are presented in Fig. 12. The uncoated substrate shows high current density values at the cathodic branch of the polarization curve and a corrosion potential of -0.674 V. At a potential of -0.665V, which is close to the corrosion potential, the anodic current density suddenly shifts to higher values. Simultaneously, several pits appear on the electrode, with fine bubbles rising above them. The potential can be designated as the breakdown potential (jb) or pitting potential, which can be used to evaluate the pitting corrosion resistance of materials [51]. Figure 13 shows SEM image of the surface of the A356 alloy after the potentiodynamic polarization test. It is found that the Al-Si eutectic between the ��-Al dendrites is dissolved. An EDS analysis performed on the remaining materials at the dissolved grain boundaries shows a composition of 4.34% O, 86.28% Al and 9.38% Si (mole fraction); hence, it is possible that the component of Al in the eutectic is preferentially dissolved. All the polarization curves of the coated samples were shifted to the left side to that of the uncoated alloy. The breakdown potential is still present to the coated samples; however, it occurs at much higher potentials relative to the corrosion potential. The corrosion parameters obtained from the polarization curves in Fig. 12 are listed in Table 2. The corrosion current densities for the samples were obtained by the Tafel extrapolation method.
Table 2 Parameters of corrosion obtained from Fig. 11 for uncoated and coated A356 alloy
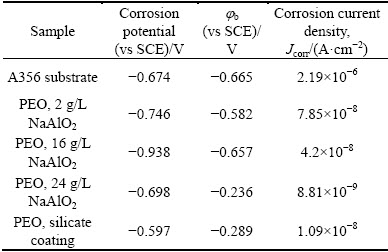
It is evident in Table 2 that the coating formed in 24 g/L NaAlO2 solution shows the lowest corrosion current density (8.81��10-9 A/cm2) and highest pitting potential (jb=-0.236 V). The corrosion current density is reduced to ~1/250 that of the untreated A356 alloy, and the current density also seems to be smaller than the corrosion current densities of the PEO coatings on aluminum alloys obtained in silicate electrolytes by the other researchers [52]. The corrosion current densities for the coatings formed in 2, 16 and 24 g/L NaAlO2 solutions decrease in a sequential order. This phenomenon may be related to the microstructure of these coatings. The coating formed in 2 g/L NaAlO2 solution has a bi-layered structure, showing an inner layer of ~10 ��m (Fig. 5). It is possible that the corrosion resistance of the coating is mainly afforded by this layer, since the ingress of electrolyte into the large pores between the outer and inner layers may be easily accomplished after immersion in the corrosion medium due to the microcracks in the outer layer (see Fig. 5(a)). Opening pores, which are usually found in the center of pancake structures with PEO coatings [45] and thought to be the quenched discharge channels [32], may be another short cut for the ingress of electrolyte. The inner layer for the coating formed in 16 g/L NaAlO2 solution has increased to ~18 ��m, and the coating formed in 24 g/L NaAlO2 solution almost shows only a single compact layer, which is similar to the previous inner layers of the coatings formed in less concentrated electrolytes (see Fig. 5). The magnification of the inner layer of the coatings shows that the presence of grain boundaries or micro cracks in the inner layer, which may be the path for the ingress of the corrosive medium. The improvement of the thickness of this layer will undoubtedly increase the corrosion resistance of the related coatings, which explains the order of the observed corrosion current densities for the present coatings.
4 Conclusions
1) During the plasma electrolytic oxidation (PEO) of A356 alloy, the Al-Si eutectic is preferentially oxidized at the initial stage of PEO, forming a network structure; however, the influence of the Al-Si eutectic on the morphology of the coatings is negligible as the coating thickens.
2) ��-Al2O3 is the main phase of the present coatings formed in different aluminate electrolytes, accompanied by a small amount of ��-Al2O3 and ��-Al2O3 solution.
3) Bi-layered coatings are formed in 2 and 16 g/L NaAlO2 solutions. In contrast, single-layered coatings with higher growth rate are formed in 24 g/L NaAlO2 solution. The single-layered coatings exhibit excellent wear and corrosion resistance.
4) Coating microstructure plays a critical role in determining the wear performance of the coatings.
5) The coatings reported in the present research have potential applications in the protection of A356 aluminium alloy.
References
[1] SU J F, NIE X, HU H, TJONG J. Friction and counterface wear influenced by surface profiles of plasma electrolytic oxidation coatings on an aluminium A356 alloy [J]. Journal of Vacuum Science & Technology A, 2012, 30: 061402.
[2] AGUIRRE-DE LA TORRE E, AFELTRA U, GOMEZ-ESPARZA C D, CAMARILLO-CISNEROS J, PEREZ-BUSTAMANTE R, MARTINEZ-SANCHEZ R. Grain refiner effect on the microstructure and mechanical properties of the A356 automotive wheels [J]. Journal of Materials Engineering and Performance, 2014, 23: 581-587.
[3] GULEC A E, GENCER Y, TARAKCI M. The characterization of oxide based ceramic coating synthesized on Al-Si binary alloys by microarc oxidation [J]. Surface & Coatings Technology, 2015, 269: 100-107.
[4] WANG S R, MA R, WANG Y Z, WANG Y, YANG L Y. Growth mechanism of primary silicon in cast hypoeutectic Al-Si alloys [J]. Transactions of Nonferrous Metals Society of China, 2012, 22: 1264-1269.
[5] CAMICIA G, TIMELLI G. Grain refinement of gravity die cast secondary AlSi7Cu3Mg alloys for automotive cylinder heads [J]. Transactions of Nonferrous Metals Society of China, 2016, 26: 1211-1221.
[6] AMNE ELAHI M, SHABESTARI S G. Effect of various melt and heat treatment conditions on impact toughness of A356 aluminum alloy [J]. Transactions of Nonferrous Metals Society of China, 2016, 26: 956-965.
[7] DANG B, LIU C C, LIU F, LIU Y Z, LI Y B. Effect of as-solidified microstructure on subsequent solution-treatment process for A356 Al alloy [J]. Transactions of Nonferrous Metals Society of China, 2016, 26: 634-642.
[8] LIN C, WU S S,  S L, ZENG J B, AN P. Dry sliding wear behavior of rheocast hypereutectic Al-Si alloys with different Fe contents [J]. Transactions of Nonferrous Metals Society of China, 2016, 26: 665-675.
[9] XU F, XIA Y, LI G. The mechanism of PEO process on Al-Si alloys with the bulk primary silicon [J]. Applied Surface Science, 2009, 255: 9531-9538.
[10] XUE W, SHI X, HUA M, LI Y. Preparation of anti-corrosion films by microarc oxidation on an Al-Si alloy [J]. Applied Surface Science, 2007, 253: 6118-6124.
[11] XUE W, DENG Z, LAI Y, CHEN R. Analysis of phase distribution for ceramic coatings formed by microarc oxidation on aluminum alloy [J]. Journal of the American Ceramic Society, 1998, 81: 1365-68.
[12] YU L, CAO J, CHENG Y. An improvement of the wear and corrosion resistances of AZ31 magnesium alloy by plasma electrolytic oxidation in a silicate-hexametaphosphate electrolyte with the suspension of SiC nanoparticles [J]. Surface & Coatings Technology, 2015, 276: 266-278.
[13] CHENG Y, PENG Z, WU X, CAO J, SKELDON P, THOMPSON G E. A comparison of plasma electrolytic oxidation of Ti-6Al-4V and Zircaloy-2 alloys in a silicate-hexametaphosphate electrolyte [J]. Electrochimica Acta, 2015, 165: 301-313.
[14] RUDNEV V S, LUKIYANCHUK I V, ADIGAMOVA M V, MOROZOVA V P, TKACHENKO I A. The effect of nanocrystallites in the pores of PEO coatings on their magnetic properties [J]. Surface & Coatings Technology, 2015, 269: 23-29.
[15] RUDNEV V S, YAROVAYA T P��BOGUTA D L, TYRINA L M, NEDOZOROV P M, GORDIENKO P S. Anodic spark deposition of P, Me(II) or Me(III) containing coatings on aluminium and titanium alloys in electrolytes with polyphosphate complexes [J]. Journal of Electroanalytical Chemistry, 2001, 497: 150-158.
[16] CHENG Y, CAO J, MAO M, PENG Z, SKELDON P, THOMPSON G E. High growth rate, wear resistant coatings on an Al-Cu-Li alloy by plasma electrolytic oxidation in concentrated aluminate electrolytes [J]. Surface & Coatings Technology, 2015, 269: 74-82.
[17] YEROKHIN A L, LVUBIMOV V V, ASHITKOV R V. Phase formation in ceramic coatings during plasma electrolytic oxidation of aluminium alloys [J]. Ceramics International, 1998, 24: 1-6.
[18] CHENG Y, MAO M, CAO J, PENG Z. Plasma electrolytic oxidation of an Al-Cu-Li alloy in alkaline aluminate electrolytes: A competition between growth and dissolution for the initial ultra-thin films [J]. Electrochimica Acta, 2014, 138: 417-429.
[19] NOMINE A, TROUGHTON S C, NOMINE A V, HENRION G, CLYNE T W. High speed video evidence for localized discharge cascades during plasma electrolytic oxidation [J]. Surface & Coatings Technology, 2015, 269: 125-130.
[20] ARRABAL R, MATYKINA E, HASHIMOTO T, SKELDON P, THOMPSON G E. Characterization of AC PEO coatings on magnesium alloys [J]. Surface & Coatings Technology, 2009, 203: 2207-2220.
[21] CHENG Y, XUE Z, WANG Q, WU X, MATYKINA E, SKELDON P, THOMPSON G E. New findings on properties of plasma electrolytic oxidation coatings from study of an Al-Cu-Li alloy [J]. Electrochimica Acta, 2013, 107: 358-378.
[22] MOON S, JEONG Y. Generation mechanism of microdischarges during plasma electrolytic oxidation of Al in aqueous solutions [J]. Corrosion Science, 2009, 51: 1506-1512.
[23] MECUSON F, CZERWIEC T, BELMONTE T, DUJARDIN L, VIOLA A, HENRION G. Diagnostics of an electrolytic microarc process for aluminium alloy oxidation [J]. Surface & Coatings Technology, 2005, 200: 804-808.
[24] CURRAN J A, CLYNE T W. Porosity in plasma electrolytic oxide coatings [J]. Acta Materialia, 2006, 54: 1985-1993.
[25] DEHNAVI V, LUAN B L, LIU X Y, SHOESMITH D W, ROHANI S. Correlation between plasma electrolytic oxidation treatment stages and coating microstructure on aluminium under pulsed DC mode [J]. Surface & Coatings Technology, 2015, 269: 91-99.
[26] YUREKTURK Y, MUHAFFEL F, BAYDOGAN M. Characterization of micro arc oxidized 6082 aluminium alloy in an electrolyte containing carbon nanotubes [J]. Surface & Coatings Technology, 2015, 269: 83-90.
[27] VOEVODIN A A, YEROKHIN A L, LYUBIMOV V V, DONLEY M S, ZABINSKI J S. Characterization of wear protective Al-Si-O coatings formed on Al-based alloys by micro-arc discharge treatment [J]. Surface & Coatings Technology, 1996, 86: 516-521.
[28] KRISHNA L R, SOMARAJU K R C, SUNDARARAJAN G. The tribological performance of ultra-hard ceramic composite coatings obtained through microarc oxidation [J]. Surface & Coatings Technology, 2003, 16: 484-490.
[29] HWANG I J, HWANG D Y, KIM Y M, YOO B, SHIN D H. Formation of uniform passive oxide layers on high Si content Al alloy by plasma electrolytic oxidation [J]. Journal of Alloys and Compounds, 2010, 504(S): s527-s530.
[30] HE J, CAI Q Z, LUO H H, YU L, WEI B K. Influence of silicon on growth process of plasma electrolytic oxidation coating on Al-Si alloy [J]. Journal of Alloys and Compounds, 2009, 471: 395-399.
[31] FADAEE H, JAVIDI M. Investigation on the corrosion behaviour and microstructure of 2024-T3 Al alloy treated via plasma electrolytic oxidation [J]. Journal of Alloys and Compounds, 2014, 604: 36-42.
[32] KRISHNA L R, GUPTA P S V N B, SUNDARARAJAN G. The influence of phase gradient within the micro arc oxidation (MAO) coatings on mechanical and tribological behaviors [J]. Surface & Coatings Technology, 2015, 269: 54-63.
[33] OH Y, MUN J, KIM J. Effects of alloying elements on microstructure and protective properties of Al2O3 coatings formed on aluminum alloy substrates by plasma electrolysis [J]. Surface & Coatings Technology, 2009, 204: 141-148.
[34] TARAKCI M. Plasma electrolytic oxidation coating of synthetic Al-Mg binary alloys [J]. Materials Characterization, 2011, 62: 1214-1221.
[35] GENCER Y, GULEC A E. The effect of Zn on the microarc oxidation coating behavior of synthetic Al-Zn binary alloys [J]. Journal of Alloys and Compounds, 2012, 525: 159-165.
[36] BROWN S D, KUNA K J, VAN T B. Anodic spark deposition from Aqueous solutions of NaAlO2 and Na2SiO3 [J]. Journal of the American Ceramic Society, 1971, 54 : 384-390.
[37] MCNEILL W, GRUSS LEONARD L. Anodic film growth by anion deposition in aluminate, tungstate, and phosphate solutions [J]. Journal of the Electrochemical Society, 1963, 110: 853-855.
[38] FOM A, PICAS J A, BAILE M T, MARTIN E, GARCIA V G. Microstructure and tribological properties of anodic oxide layer formed on Al-Si alloy produced by semisolid processing [J]. Surface & Coatings Technology, 2007, 202: 1139-1143.
[39] WANG L, NIE X. Silicon effects on formation of EPO oxide coatings on aluminum alloys [J]. Thin Solid Films, 2006, 494: 211-218.
[40] SABATINI G, CESCHINE L, MATINI C, WILLIAMS J A, HUTCHINGS I M. Improving sliding and abrasive wear behaviour of cast A356 and wrought AA7075 aluminium alloys by plasma electrolytic oxidation [J]. Material & Design, 2010, 31: 816-828.
[41] WANG P, LI J, GUO Y, WANG J, YANG Z, LIANG M. Effect of zirconia sol on the microstructures and thermal-protective properties of PEO coating on a cast Al-12Si piston alloy [J]. Journal of Alloys and Compounds, 2016, 657: 703-710.
[42] ARRABAL R, MOHEDANO M, MATYKINA E, PARDO A, MINGO B, MERINO M C. Characterization and wear behaviour of PEO coatings on 6082-T6 aluminium alloy with incorporated ��-Al2O3 particles[J]. Surface & Coatings Technology, 2015, 269: 64-73.
[43] HUSSEIN R O, NIE X, NORTHWOOD D O, YEROKHIN A, MATTHEWS A. Spectroscopic study of electrolytic plasma and discharging behaviour during the plasma electrolytic oxidation (PEO) process [J]. Journal of Physics D: Applied Physics, 2010, 43: 105203.
[44] CHENG Y, CAO J, PENG Z, WANG Q, MATYKINA E, SKELDON P, THOMPSON G E. Wear-resistant coatings formed on zircaloy-2 by plasma electrolytic oxidation in sodium aluminate electrolytes [J]. Electrochimica Acta, 2014, 116: 453-466.
[45] CHENG Y, CAO J, MAO M, XIE H, SKELDON P. Key factors determining the development of two morphologies of plasma electrolytic coatings on an Al-Cu-Li alloy in aluminate electrolytes [J]. Surface & Coatings Technology, 2016, 291: 239-249.
[46] ZHU L, GUO Z, ZHANG Y, LI Z, SUI M. A mechanism for the growth of a plasma electrolytic oxide coating on Al [J]. Electrochimica Acta, 2016, 208: 296-303.
[47] MARTINI C, CESCHINI L, TARTERINI F, PAILLARD J M, CURRAN J A. PEO layers obtained from mixed aluminate- phosphate baths on Ti-6Al-4V: Dry sliding behaviour and influence of a PTFE topcoat [J]. Wear, 2010, 269: 747-756.
[48] CHENG Y L, CHEN Z H, WU H L, WANG H M. The corrosion behaviour of the aluminum alloy 7075/SiCp metal matrix composite prepared by spray deposition [J]. Materials and Corrosion, 2007, 58: 280-284.
[49] SHI Y, ZHANG Z, SU J, CAO F, ZHANG J. Electrochemical niose study on 2024-T3 aluminium alloy corrosion in simulated acid rain under cyclic wet-dry condition [J]. Electrochimica Acta, 2006, 51: 4977-4986.
[50] CAO F, ZHANG Z, SU J, SUI Y, ZHANG J. Electrochemical noise analysis of LY12-T3 in EXCO solution by discrete wavelet transform technique [J]. Electrochimica Acta, 2006, 51: 1359-1364.
[51] WEI B M. The theory of metal corrosion and its applications [M]. Beijing: Chemical Industry Press, 1984. (in Chinese)
[52] NIE X, MELETIS E I, JIANG J C, LEYLAND A, YEROKHIN A L, MATTHEWS A. Abrasive wear/corrosion properties and TEM analysis of Al2O3 coatings fabricated using plasma electrolysis [J]. Surface & Coatings Technology, 2002, 149: 245-251.
л��������Ӣ���������ȣ��ܽ��ͣ��� ��
���ϴ�ѧ ���Ͽ�ѧ�빤��ѧԺ����ɳ 410082
ժ Ҫ���������Ƶ��Һ�����õ�������������(PEO)��������̬A356�Ͻ���д����Ʊ���ĥ����ʴͿ�㡣����3�ֲ�ͬŨ�ȵ���������Һ(2��16��24 g/L NaAlO2)�Լ���������Һ(���ԱȽ�)�Ʊ�Ϳ�㡣������-��ʽ��Ħ����ĥ������(��ĥ����Ϊ̼����)�͵绯ѧ��������Ϳ���ĥ�����ʴ���ܡ������������24 g/L NaAlO2��Һ�д���480 s �γɵ�����ĤͿ�������ѵı������ܡ���Ϳ����30 N�غ���Ħ��1800 s����ĥ���ʽ�ԼΪ ~4.5��10-7 mm3/(N��m)��ͬʱ����Ϳ����кܵ͵ĸ�ʴ�����ܶ�(ԼΪ8.81��10-9 A/cm2)����ʵ�鷢�֣�����Ĥ���� ��-Al2O3 �����ܵ�, Ϳ������̶ܳȺ͵���ṹ��֤������������ܡ�
�ؼ��ʣ�A356 ���Ͻ������ƣ�����������������ĥ�𣻸�ʴ
(Edited by Wei-ping CHEN)
Foundation item: Projects (51071066, 51671084) supported by the National Natural Science Foundation of China; Project (NCET-12-0172) supported by the Program for New Century Excellent Talents in University, Ministry of Education, China
Corresponding author: Ying-liang CHENG; Tel: +86-731-88821727; Fax: +86-731-88823554; E-mail: chengyingliang@hnu.edu.cn
DOI: 10.1016/S1003-6326(17)60038-4

