Effects of loading waveforms on rock damage using particle simulation method
��Դ�ڿ������ϴ�ѧѧ��(Ӣ�İ�)2018���7��
�������ߣ����� ����ǿ
����ҳ�룺1755 - 1765
Key words��rock damage; failure process; crack initiation and propagation; loading waveform; cycle loading; particle simulation method
Abstract: The particle simulation method is used to study the effects of loading waveforms (i.e. square, sinusoidal and triangle waveforms) on rock damage at mesoscopic scale. Then some influencing factors on rock damage at the mesoscopic scale, such as loading frequency, stress amplitude, mean stress, confining pressure and loading sequence, are also investigated with sinusoidal waveform in detail. The related numerical results have demonstrated that: 1) the loading waveform has a certain effect on rock failure processes. The square waveform has the most damage within these waveforms, while the triangle waveform has less damage than sinusoidal waveform. In each cycle, the number of microscopic cracks increases in the loading stage, while it keeps nearly constant in the unloading stage. 2) The loading frequency, stress amplitude, mean stress, confining pressure and loading sequence have considerable effects on rock damage subjected to cyclic loading. The higher the loading frequency, stress amplitude and mean stress, the greater the damage the rock accumulated; in contrast, the lower the confining pressure, the greater the damage the rock has accumulated. 3) There is a threshold value of mean stress and stress amplitude, below which no further damage accumulated after the first few cycle loadings. 4) The high-to-low loading sequence has more damage than the low-to-high loading sequence, suggesting that the rock damage is loading-path dependent.
Cite this article as: XIA Ming, GONG Feng-qiang. Effects of loading waveforms on rock damage using particle simulation method [J]. Journal of Central South University, 2018, 25(7): 1755�C1765. DOI: https://doi.org/10.1007/ s11771-018-3866-9.

J. Cent. South Univ. (2018) 25: 1755-1765
DOI: https://doi.org/10.1007/s11771-018-3866-9

XIA Ming(����)1, 2, GONG Feng-qiang(����ǿ)3
1. Hunan Key Laboratory of Geomechanics and Engineering Safety, Xiangtan University,Xiangtan 411105, China;
2. College of Civil Engineering and Mechanics, Xiangtan University, Xiangtan 411105, China;
3. School of Resources and Safety Engineering, Central South University, Changsha 410083, China
 Central South University Press and Springer-Verlag GmbH Germany, part of Springer Nature 2018
Abstract: The particle simulation method is used to study the effects of loading waveforms (i.e. square, sinusoidal and triangle waveforms) on rock damage at mesoscopic scale. Then some influencing factors on rock damage at the mesoscopic scale, such as loading frequency, stress amplitude, mean stress, confining pressure and loading sequence, are also investigated with sinusoidal waveform in detail. The related numerical results have demonstrated that: 1) the loading waveform has a certain effect on rock failure processes. The square waveform has the most damage within these waveforms, while the triangle waveform has less damage than sinusoidal waveform. In each cycle, the number of microscopic cracks increases in the loading stage, while it keeps nearly constant in the unloading stage. 2) The loading frequency, stress amplitude, mean stress, confining pressure and loading sequence have considerable effects on rock damage subjected to cyclic loading. The higher the loading frequency, stress amplitude and mean stress, the greater the damage the rock accumulated; in contrast, the lower the confining pressure, the greater the damage the rock has accumulated. 3) There is a threshold value of mean stress and stress amplitude, below which no further damage accumulated after the first few cycle loadings. 4) The high-to-low loading sequence has more damage than the low-to-high loading sequence, suggesting that the rock damage is loading-path dependent.
Key words: rock damage; failure process; crack initiation and propagation; loading waveform; cycle loading; particle simulation method
Cite this article as: XIA Ming, GONG Feng-qiang. Effects of loading waveforms on rock damage using particle simulation method [J]. Journal of Central South University, 2018, 25(7): 1755�C1765. DOI: https://doi.org/10.1007/ s11771-018-3866-9.
1 Introduction
Study of rock damage involving microscopic crack initiation, propagation and coalescence is of both important scientific value and engineering practical significance [1, 2]. During the past few decades, this field has gained a great attention, while most of them are concentrated on the static loading [3, 4]. Although many load or stress applied on the rock, which caused the rock failure, is static load in a relatively long time, it should be viewed as a cyclic (i.e., dynamic) loading. For example, the rock material of many engineering structures, such as underground tunnels, reservoir dams, civil buildings or the Earth, is always subjected to cyclic loading, such as blasting, railway vibrating, and earthquake. Obviously, the rock damage subjected to cyclic loading, which is a very important factor that should be considered in the engineering design or service, has different mechanism with that static loading. For this reason, a large amount of experimental researches have been carried out for attempting to understand the rock properties from a macroscopic aspect subjected to cyclic loading at sample-length scale [5-13]. In contrast, the numerical simulation method can be used to capture the stress state in rock and its failure processes from a mesoscopic aspect [14]. However, little research has been done using the numerical simulation method, especially involving the microscopic crack initiation, propagation and coalescence. From the continuum mechanics point of view, rock is often treated as a continuum [14, 15]. However, such a treatment cannot simulate the predominant mechanism of the rock damage associated with microscopic crack initiation, propagation and coalescence [16].
In terms of simulating the rock damage associated with failure process problems, it is natural to use the particle simulation method that is a branch of the discrete element method. Since the particle simulation method can naturally track the microscopic crack initiation, propagation and coalescence in brittle material without re-meshing or using any constitutive laws. For this reason, it has been widely used to study the rock mechanical behavior under both isothermal and non-isothermal conditions at both laboratory and geological length scales [16-25]. Nevertheless, the particle simulation of rock damage subjected to cyclic loading is, especially considering its influencing factors, if not available, rather limited in open literatures. Therefore, the main purpose of the present study is to deal with the above-mentioned problem using the particle simulation method, because it is not possible to derive purely analytical solutions for such a complex and complicated problem involving different loading stress level and loading sequence. On the other hand, the experiment can not trace the rock damage from a microscopic point of view.
The objectives of this work are: 1) to deal with the rock damage at mesoscopic scale subjected to cyclic loading with three different loading waveforms, namely square, sinusoidal and triangle waveforms, using the particle simulation method;2) to investigate the effects of some influencing factors, such as loading frequency, stress amplitude, mean stress, confining pressure and loading sequence of the sinusoidal waveform on the rock damage at the mesoscopic scale subjected to cyclic loading using the particle simulation method.
2 Brief introduction of particle simulation method and loading waveforms
2.1 Brief introduction of particle simulation method
The particle simulation method treats the material as an assembly of particles, which interacts each other through contacts. The motion of the particle is controlled by Newton��s second law, while the contact force is governed by the force-displacement law. Since the microscopic crack initiation and propagation can be expressed as a progressive breakage of contact bonds, the particle simulation method allows the user to explicitly model fracture and damage directly [16, 17]. Furthermore, the crack pattern is automatically determined without need for re-meshing and can be visualized directly during the simulation. As a result, the micromechanical damage can progressively evolve.
2.2 Brief introduction of loading waveforms
Waveform means the periodic stress-excitation function, with the most common types being square, sinusoidal and triangle. Figure 1 shows the three different loading waveforms, namely square, sinusoidal and triangle waveforms. The loading force with sinusoidal waveform is given by the following equation:
 (1)
(1)
where Fm is the mean loading force; Fa is the amplitude loading force; f is the loading frequency, which is defined as f=1/T; T is the loading period; t is the time.
3 Particle simulation method on rock damage subjected to cyclic loading with different loading waveforms
In order to test whether or not the particle simulation method can be used to simulate the rock damage subjected to cyclic loading, three different loading waveforms are used to simulate the rock failure processes. It needs to be pointed out that there are two cyclic loading fatigue types [26]: one is the high-cycle loading, which results from a very large number of load cycles (>10000) at a relatively low stress level; the other is the low-cycle loading, which results from relatively few load cycles (<10000) at a high stress level. Since there are great computational expense and storage needed for simulating the high-cycle loading, they also should be considered in the future study. For the first step of using the particle simulation method for modeling rock damage problems, the main purpose of this investigation is concentrated on the low-cycle loading.
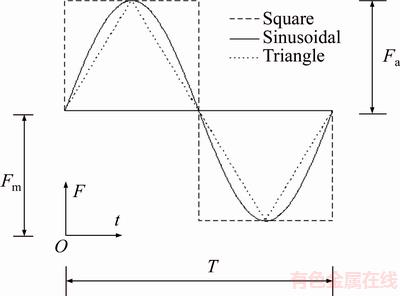
Figure 1 Loading waveform
3.1 Description of particle simulation models
Figure 2 shows the conceptual particle simulation model with a height of 2 m and a width of 1 m. This model contains 5242 randomly distributed particles of the same size, and the radius of each particle is 0.0155 m. Since the brittle rock is widely used for comparison and demonstration, the following parameters are chosen from a typical brittle rock, such as marble and granite. The density of the particle material is 3000 kg/m3 and the friction coefficient of the particle material is 0.5. To match macroscopic parameters and microscopic ones directly, the value of the contact stiffness of a circular particle should be equal to twice that of the macroscopic elastic modulus of the material, while the contact bond strength of a circular particle is directly proportional to both the tensile/shear strength of the particle material and the diameter of the circular particle. The macroscopic elastic modulus of the particle material is 10 GPa, resulting in the particle stiffness (in both the normal and the tangential directions) of 20 GN/m in the particle simulation model. The macroscopic tensile strength of the particle material is 10 MPa, while the macroscopic shear strength of the particle material is 100 MPa for the particle simulation model. The time step used in the particle simulation is 1.5��10�C5 s. There are two types of bonds to joining two contacting particles in the particle simulation models: the contact bond and the parallel bond. These bonds have finite strengths in tension and shear. In this study, the contact bond is adopted and applied to all the particle simulations. For the particle simulation test, the top and bottom walls acted as loading platens. The velocities of two lateral walls were controlled with the servo-control technique [17], so that a specified confining pressure could be maintained, while the confining pressure is assumed to be 1 MPa in the following particle simulations. To insure the uniform normal stress application, two loading plates with a thickness of 0.2 m is modeled with 1000 particles. Particles composing these two plates are then all incorporated into two clumps, so the plate itself can move like a rigid body transferring the boundary normal force to the sample. It should be noted that the particles in the clumps have the same microscopic parameters, which can exclude the unmatched between specimen and loading plate. On the other hand, to realistically conduct the simulation in the particle model, the friction of the balls in the particle model, which contact with the clumped platens, is set to zero. As stated in the brief introduction of the particle simulation method, the microcrack initiation and propagation can be expressed as a progressive breakage of the contact bonds. The contact bond is defined by tensile and shear strengths, which are directly proportional to both the tensile/shear strength of the particle material and the diameter of the circular particle. While the contact force between a pair of particles is directly proportional to both contact stiffness and distance of the two contacting particles. When the contact force exceeds either the tensile or shear strengths of a contact bond at the contact between two particles, the contact bond will be broken and therefore, a microcrack is generated at the contact. For the cyclic loading test, the axial loading is specified as the three different loading waveforms (i.e., square, sinusoidal and triangle waveforms), while the loading frequency is 10 Hz. After the particle simulation model reaches a static equilibrium state, a set of particles which lie around the vertical axis of the specimen was identified as the monitoring particles.
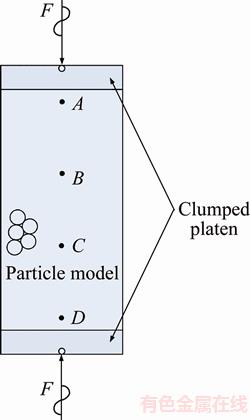
Figure 2 Particle model with loading waveform
The simulation processes can be divided into two stages: 1) a pre-loading process, at which the loading wall applied to the clumped loading plates, is set to the designed velocity, so that the axial stress is gradually increased from zero to the designed mean stress (40 MPa in this study); 2) a cyclic loading process, at which the normal force to the particle which is located at the center of the clumped platen (Figure 2), is set to the designed force, so that the specimen is subjected to cyclic loading with different waveforms. While the loading force path is illustrated in Figure 1. The stress amplitude in this study is 28 MPa. To monitor the vertical displacement change during the particle simulations, four monitoring particles (marked as A, B, C and D) are assigned in the particle simulation model (Figure 2). All these four particles are located at the y axis, the coordinates of which are (0, 0.9 m), (0, 0.3 m), (0, �C0.3 m) and (0, �C0.9 m), respectively. In addition, a stress monitoring circles with a radius of 0.4 m is assigned at the center of the particle model before the start of running the particle simulation. The time associated with the start of applying the cyclic loading force to the central particle in the clumped platens is defined as the start time, which is used to describe the evolution processes of the microscopic cracks in the particle simulation model.
3.2 Particle simulation of rock damage under three different loading waveforms
Figure 3 shows the time-history variation of microscopic cracks in the particle simulation model with three different loading waveforms. It can be concluded that the loading waveform has strongly effects on rock damage. As shown in Figure 3, the square waveform caused the greatest number of microscopic cracks in these waveforms, while the triangle waveform caused less number of microscopic cracks than sinusoidal waveform. The reason for this is that the influence of loading waveform, in natural, is the influence of loading rate [10, 26]. Besides, the effect of square waveform can be equivalent to the transient dynamic impact loading on rock material, which is always higher than the effect of sinusoidal waveform and triangle waveform with stepwise loading on rock material. This result agrees well with the theoretical and experimental results [10]. Furthermore, it is interesting to note that the number of microscopic cracks increases in a stepwise manner within all these three loading waveforms. In each cycle, the number of microscopic cracks increases in the loading stage, while it nearly keeps constant in the unloading stage. Taken the first cycle as an example (i.e., t=0-0.1 s), the number of microscopic cracks increases in the loading stage with t=0-0.05 s for square waveform and t=0�C0.025 s for sinusoidal and triangle waveforms (see Figure 1), while in the unloading stage with t=0.05-0.1 s for square waveform and t=0.025-0.1 s for sinusoidal and triangle waveforms, almost no microscopic cracks are generated. There is also a different phenomenon with the number of microscopic crack generation in each cycle due to three loading waveforms. With the sinusoidal and triangle waveforms, the number of microscopic cracks generated is almost the same, while it is not the same for the square waveform in each cycle. A large number of microscopic cracks (306 microscopic cracks) are generated at the first cycle (t=0-0.1 s), while with an average value of 130 microscopic cracks generated in the following each cycle (t=0.1-1.0 s). This indicates that the rock subjected to the first impact loading can experiences much more cracking than the following impact loading for square waveform.
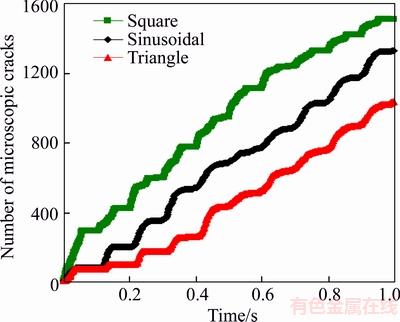
Figure 3 Time-history variation of microscopic cracks in particle simulation model with different loading waveforms.
Figure 4 shows the evolution processes of microscopic cracks with different loading waveforms. It can be seen from Figure 4 that, at the first cycle (t=0.1 s), a great number of microscopic cracks are, in general, initiated and concentrated along an inclined plane with the square waveform, while few microscopic cracks are initiated and random distributed through the specimen with both the sinusoidal and square waveforms. As the cycle increases (t=0.4 s), microscopic cracks continue to increase, grow and coalesce at the local place with the square waveform. The damage caused by the square waveform is the greatest within these three loading waveforms. While with the sinusoidal waveform, the microscopic cracks tend to form an inclined plane and its number is larger than that of triangle waveform. When the specimen experience seven cycles (t=0.7 s), most of the microscopic cracks can be found around the inclined plane, resulting in the width of the shear band with the square waveform. Meanwhile, some microscopic cracks are random distributed through the particle model. At the end of the cyclic loading (t=1.0 s), microscopic cracks tend to propagate and interact, and the macroscopic fracture is formed by the growth and coalescence of tension-induced microcracks. Although, the failure modes of the particle simulation model under three different loading waveforms are all shear failure, the time when the shear failure are formed is totally different. It can be seen that the shear band forms firstly with the square waveform, secondly with sinusoidal waveform and thirdly with triangle waveform. Compared with other two waveforms, the shear band is wider with square waveform. Furthermore, besides the shear band area, greater number of microscopic cracks generated through other area of the particle model with the square waveform, while less microscopic cracks generated through the particle model with the sinusoidal waveform, and the least microscopic cracks generated with the triangle waveform.
It is interesting to examine how the stresses vary within the measurement circle during the cyclic loading process that is simulated by the particle simulation method. It should be pointed that the stress within a measurement circle is determined using the average concept, which was originally derived for quasi-static problems [17]. Using these results, it is possible to investigate the effect of the loading waveform on the stress distribution within the particle sample. For the sake of saving space, the evolution of the vertical stress is not shown in this investigation.
Figure 5 shows the time-history variation of stresses (including horizontal stress and shear stress) at the center of the initial model with different loading waveforms. Note that compressive forces produce negative average stresses, while tensile forces produce positive average stresses within the measure circle during the particle simulation. It is obvious that the loading waveform has a significant influence on the stress distribution within the particle simulation model. For example, in the case of square waveform, the maximum horizontal stress in compression is 32.3 MPa, which takes place at t=0.95 s. Comparatively, in the case of sinusoidal waveform, the maximum horizontal stress in compression is 26.6 MPa, which takes place at t=0.84 s, whereas in the case of triangle waveform, the maximum horizontal stress in compression is 21.5 MPa, which takes place at t=0.83 s. This indicates that the effect of square waveform with the maximum horizontal stress is the greatest among these three waveforms, while the effect of triangle waveform is less than that of sinusoidal waveform. As for shear stress, its maximum value is clearly dependent on the loading waveform. For instance, the maximum shear stresses are 75.2, 68.6 and 67 MPa for square, sinusoidal and triangle waveforms, respectively. In the loading stage within each cycle, the stress (both horizontal stress and shear stress) increases, whereas in the unloading stage within each cycle, the stress decreases.
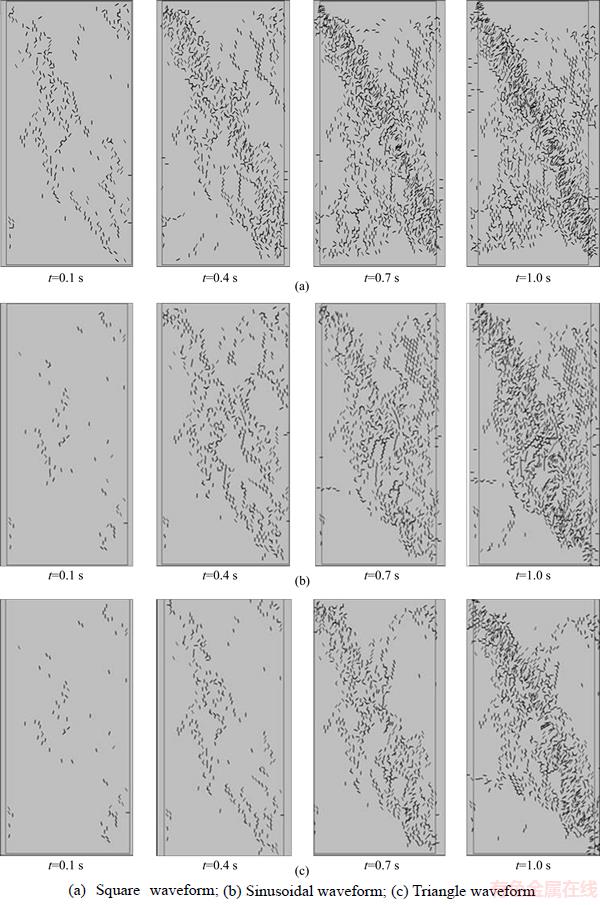
Figure 4 Evolution processes of microscopic cracks with different loading waveforms:
Figure 6 shows the time-history variation of axial and lateral strain in the particle simulation model with different loading waveforms. It can be seen that in the first few cycles both the axial and lateral strains increase a little, after that both of them increase with the increasing cycles within these different waveforms. Compared the axial strain with the lateral strain, it can be found that the lateral strain develops faster than the axial strain, which result in the rock dilation subjected to the cyclic loading. This is consistent with the experimental results [5]. On the other hand, both axial and lateral strains caused by the square waveform are the largest, while their values caused by the sinusoidal waveform are greater than that of the triangle waveform.
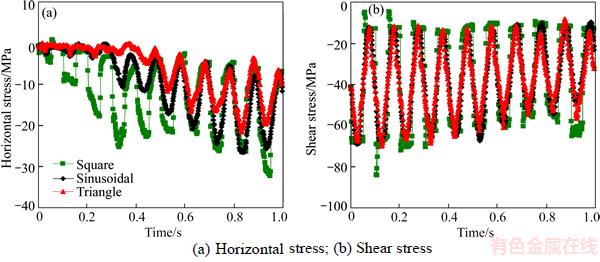
Figure 5 Time-history variation of stresses at center of initial model with different loading waveforms:
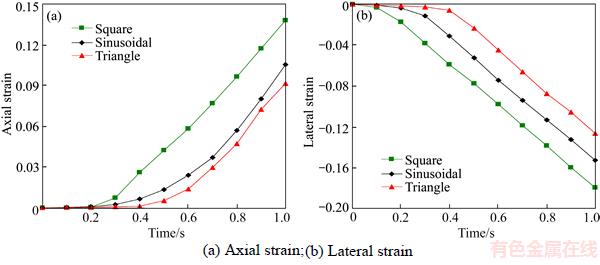
Figure 6 Time-history variation of strain in particle simulation model with different loading waveforms:
Figure 7 shows the vertical displacements at different position in the particle model within three different loading waveforms. It is interesting to note that the shape of the vertical displacement has the same tendency with its corresponding loading waveform. In the loading stage within each cycle, the vertical displacement increases, while in the unloading stage within each cycle, the vertical displacement decreases. The vertical displacement changes a little in the first two cycles (t=0-0.2 s), in the following cycles, it increases, which results in the total displacement accumulated.
4 Influencing factors of rock damage with sinusoidal waveform
Using the above sinusoidal waveform in the previous section, which is a typical waveform in the actual circumstances, some influencing factors on rock damage, such as loading frequency, stress amplitude, mean stress, confining pressure and loading sequence, are investigated using the particle simulation method in this section. Except for the use of different values of each influencing factors, other mechanical properties used in each sub-section are exactly the same as those used in the previous section. In this section, the degree of the damage with the rock accumulated is represented by the number of the microscopic cracks. That is to say the more microscopic cracks are generated, the more damaging with rock experience.
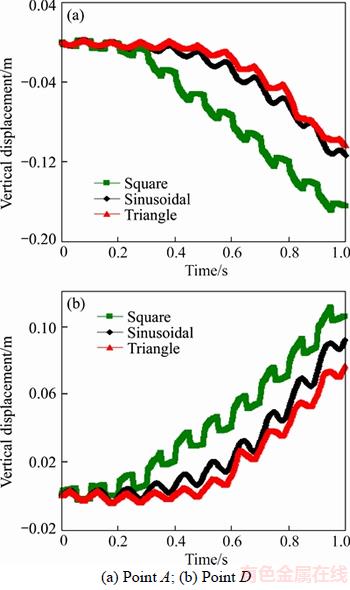
Figure 7 Vertical displacements of different position in particle model with different loading waveforms:
4.1 Effects of frequency
In order to investigate the effect of the frequency of the sinusoidal waveform on the rock damage, four different frequencies, namely 1, 5, 10 and 50 Hz, are considered. Figure 8 shows the effect of the loading frequency on rock damage. It indicates that the damage increased with the loading frequency increases at the same applied stress level. The previous theoretical results have demonstrated that the influence of loading frequency on the rock mechanical behavior can be regarded as the influence of loading rate, while the loading rate is directly propertied to the loading frequency [10]. When the loading frequency reaches some critical value (f=50 Hz in this study), the number of microscopic cracks will not increase in a stepwise manner, it will display the linear increasing with the cycle increasing.
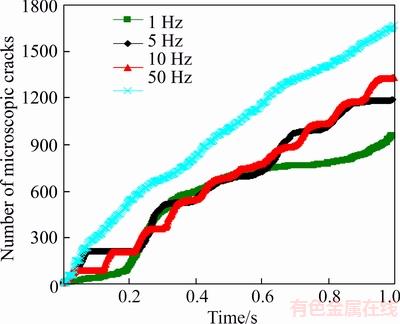
Figure 8 Effects of loading frequency on rock damage
4.2 Effects of stress amplitude
For the purpose of studying the effects of the stress amplitude of the sinusoidal waveform on rock damage, four different stress amplitudes, namely 25, 27, 28 and 30 MPa are chosen. Figure 9 shows the effect of loading amplitude on the rock damage. The number of microscopic cracks increases with the increasing stress amplitude. When the stress amplitude is 25 MPa, few microscopic cracks are generated in the first cycle. After that, there is almost no further damage because almost no microscopic cracks generated in the following nine cycles, as indicated by the number of microscopic cracks. This demonstrates that there is a threshold value of stress amplitude, below which no further damage accumulated after the first few cycle loadings. When the stress amplitude is greater than 27 MPa, its number increases as the cycle increases in a stepwise manner.
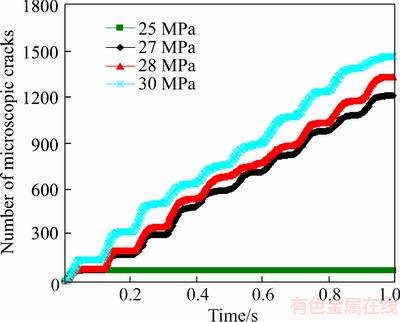
Figure 9 Effects of stress amplitude on rock damage
4.3 Effects of mean stress
In this sub-section, four different mean stresses, which are 35, 40, 45 and 50 MPa, respectively, of the sinusoidal waveform are considered to examine their effects on rock damage. Figure 10 shows the effect of mean stress on the rock damage. The number of microscopic cracks increases with the increase of the mean stress. When the mean stress is 35 MPa, few microscopic cracks generated in the first cycle, while no further microscopic cracks generated in the following night cycles. This demonstrates that there is also a threshold value of mean stress, below which no further damage accumulated after the first few cycle loadings. When the mean stress is greater than 40 MPa, its number increases as the cycle increases in a stepwise manner. Both stress amplitude and mean stress has a similar effect on the rock damage.
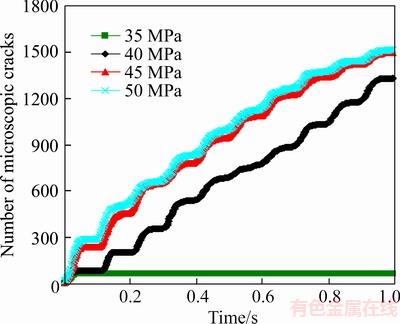
Figure 10 Effects of mean stress on rock damage
4.4 Effects of confining pressure
Keeping the other parameters of the rock constant, four different confining pressures, which are 0.1, 1, 2 and 5 MPa, respectively, are considered. Figure 11 shows the effect of confining pressure on rock damage. The number of microscopic cracks increases with the increasing confining pressure. When the confining pressure is less than 5 MPa, the number of microscopic cracks increases with the cycle increases in a stepwise manner. The lower the confining pressure, the greater damage the rock has accumulated. When the confining pressure is 5 MPa, few microscopic cracks generated in the first cycle, while no further microscopic cracks generated in the following night cycles. This demonstrates that there is also a threshold value of confining pressure, over which no further damage accumulated after the first few cycle loadings. This can be explained that the confining pressure suppress the microscopic crack initiation and propagation. The higher the confining pressure, the more energy needed for the microscopic crack initiation. On the other hand, in the conventional triaxial compression test, the higher the confining pressure, the greater the compressive strength.
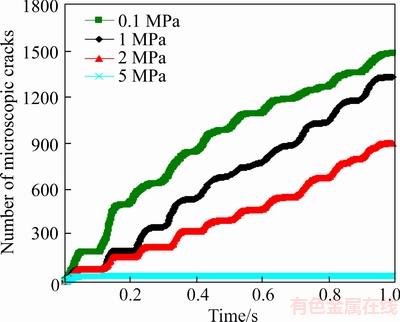
Figure 11 Effects of confining pressure on rock damage
4.5 Effects of loading sequence
Since the loading sequence in reality such as earthquake or railway vibration is random loading. For this reason, two simple step-loading sequences (i.e., high-to-low and low-to-high loading sequences) are considered in this sub-section. The loading sequence is divided into three levels, each level cycle three times. The minimum stress in each cycle is fixed at 20 MPa. The maximum stresses in the three levels are 60, 70 and 80 MPa for low-to- high loading sequence, resulting in the mean stress of 40, 45 and 50 MPa, respectively. While the maximum stresses in the three levels are 80, 70 and 60 MPa for high-to-low loading sequence, resulting in the mean stress of 50, 45 and 40 MPa, respectively. As shown in Figure 12, it indicates that the loading sequence has a strong influence on the rock damage. Generally, the high-to-low loading sequence results in greater number of microscopic cracks than the low-to-high loading sequence. After the first level with mean stress of 50 MPa in the high-to-low loading sequence, 721 microscopic cracks were generated, which account for 50% of the total number of microscopic cracks generated in all three levels. Especially in the first loading level, a great number of microscopic cracks generated (364) in the first cycle, and the number of microscopic cracks increases gently in the following two cycles. It can be deduced that the rock damage is mainly formed during the first loading level for the high-to-low loading sequence. For the low-to-high loading sequence, it can be seen that few microscopic cracks were generated in the first level with mean stress of 40 MPa. This further demonstrates that there is a threshold level of stress, below which few microscopic cracks generated. In the following two levels as mean stress of 45 MPa and 50 MPa, the number of microscopic cracks increases as the cycle increases in a stepwise manner. This suggests that the present mean stress or stress amplitude reaches the critical value, the rock damage accumulated progressively at all stages for low-to-high loading sequence. It can be concluded that the high-to-low loading sequence has more damage than the low-to-high loading sequence, suggesting that the rock damage is loading-path dependent.
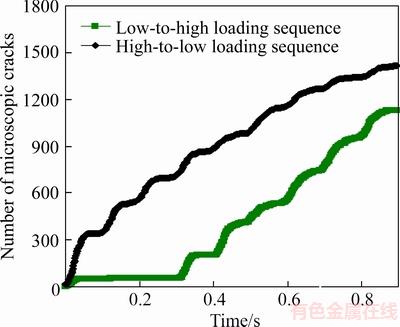
Figure 12 Effects of loading sequence on rock damage
5 Conclusions
1) The loading waveform has a certain effect on the rock damage. The square waveform has the most damage within these waveforms, while the triangle waveform has less damage than sinusoidal waveform. In each cycle, the number of microscopic cracks increases in the loading stage, while it nearly keeps constant in the unloading stage.
2) The loading frequency, stress amplitude, mean stress, confining pressure and loading sequence have considerable effects on the rock damage subjected to cyclic loading. The higher the loading frequency, stress amplitude and mean stress, the greater damage the rock accumulated, while the lower the confining pressure, the greater damage the rock has accumulated.
3) There is a threshold value of mean stress and stress amplitude, below which no further damage accumulated after the first few cycle loadings.
4) The high-to-low loading sequence has more damage than the low-to-high loading sequence, suggesting that the rock damage is loading path dependent.
References
[1] BIENIAWSKI Z T. Mechanism of brittle fracture of rock: Part I��Theory of the fracture process [J]. International Journal of Rock Mechanics and Mining Sciences, 1967, 4(4): 395-404.
[2] PATERSON M S, WONG T F. Experimental rock deformation��The brittle field [M]. 2nd Ed. Berlin: Springer, 2005.
[3] SCHOLZ C H, KOCZYNSKI T A. Dilatancy anisotropy and the response of rock to large cyclic loads [J]. Journal of Geophysical Research, 1979, 84(B10): 5525-5534.
[4] TANG C. Numerical simulation of progressive rock failure and associated seismicity [J]. International Journal of Rock Mechanics and Mining Sciences, 1997, 34(2): 249-261.
[5] TAO Z, MO H. An experimental study and analysis of the behaviour of rock under cyclic loading [J]. International Journal of Rock Mechanics and Mining Sciences & Geomechanics Abstracts, 1990, 27(1): 51-56.
[6] LI N, CHEN W, ZHANG P, SWOBODA G. The mechanical properties and a fatigue-damage model for jointed rock masses subjected to dynamic cyclical loading [J]. International Journal of Rock Mechanics and Mining Sciences, 2001, 38: 1071-1079.
[7] LI N, ZHANG P, CHEN Y S. Fatigue properties of cracked, saturated and frozen sandstone samples under cyclic loading [J]. International Journal of Rock Mechanics and Mining Sciences, 2003, 40: 145-150.
[8] BAGDE M N, PETROS V. Waveform effect on rock fatigue properties of intact sandstone in uniaxial cyclical loading [J]. Rock Mechanics and Rock Engineering, 2005, 38(3): 169-196.
[9] BAGDE M N, PETROS V. Fatigue and dynamic energy behaviour of rock subjected to cyclical loading [J]. International Journal of Rock Mechanics and Mining Sciences, 2009, 46: 200-209.
[10] XIAO J Q, DING D X, XU G, JIANG F L. Waveform effect on quasi-dynamic loading condition and the mechanical properties of brittle materials [J]. International Journal of Rock Mechanics and Mining Sciences, 2008, 45: 621-626.
[11] XIAO J Q, FENG X T, DING D X, JIANG F L. Investigation and modeling on fatigue damage evolution of rock as a function of logarithmic cycle [J]. International Journal for Numerical and Analytical Methods in Geomechanics, 2011, 35: 1127-1140.
[12] LIU E, HE S, XUE X, XU J. Dynamic properties of intact rock samples subjected to cyclic loading under confining pressure conditions [J]. Rock Mechanics and Rock Engineering, 2011, 44: 629-634.
[13] LIU E, HE S. Effects of cyclic dynamic loading on the mechanical properties of intact rock samples under confining pressure conditions [J]. Engineering Geology, 2012, 125: 81-91.
[14] ZHU W C, BAI Y, LI X B, NIU L L. Numerical simulation on rock failure under combined static and dynamic loading during SHPB tests [J]. International Journal of Impact Engineering, 2012, 49: 142-157.
[15] CHEN E P. Non local effects on dynamic damage accumulation in brittle solids [J]. International Journal for Numerical and Analytical Methods in Geomechanics, 1999, 23(1): 1-21.
[16] XIA M, ZHOU K. Particle simulation of failure process of brittle rock under triaxial compression [J]. International Journal of Minerals, Metallurgy and Materials, 2010, 17(5): 507�C513.
[17] POTYONDY D O, CUNDALL P A. A bonded-particle model for rock [J]. International Journal of Rock Mechanics and Mining Sciences, 2004, 41(8):1329�C1364.
[18] O��SULLIVAN C, CUI L, O��NEILL S C. Discrete element analysis of the response of granular materials during cyclic loading [J]. Soils and Foundations, 2008, 48(4): 511-530.
[19] INDRARATNA B, THAKUR P, VINOD J. Experimental and numerical study of railway ballast behavior under cyclic loading [J]. International Journal of Geomechanics, 2010, 10(4): 136-144.
[20] XIA M, ZHAO C. Simulation of rock deformation and mechanical characteristics using clump parallel-bond models [J]. Journal of Central South University, 2014, 21(7): 2885-2893.
[21] XIA M. Thermo-mechanical coupled particle model for rock [J]. Transactions of Nonferrous Metals Society of China, 2015, 25(7): 2367-2379.
[22] XIA M. Thermo-mechanical coupling particle simulation of three-dimensional large-scale non-isothermal problems: A comprehensive upscale theory [J]. Engineering Computations, 2017, 34(5): 1551-1571.
[23] ZHANG X P, WONG L N Y. Crack initiation, propagation and coalescence in rock-like material containing two flaws: A numerical study based on bonded-particle model approach [J]. Rock Mechanics and Rock Engineering, 2013, 46(5): 1001-1021.
[24] JIANG M J, CHEN H, CROSTA G B. Numerical modeling of rock mechanical behavior and fracture propagation by a new bond contact model [J]. International Journal of Rock Mechanics and Mining Sciences, 2015, 78: 175-189.
[25] YANG S Q, HUANG Y H, RANJITH P G, JIAO Y Y, JI J. Discrete element modeling on the crack evolution behavior of brittle sandstone containing three fissures under uniaxial compression [J]. Acta Mechanica Sinica, 2015, 31(6): 871-889.
[26] GONG M, SMITH I. Effect of waveform and loading sequence on low-cycle compressive fatigue life of spruce [J]. Journal of Materials in Civil Engineering, 2003, 15(1): 93-99.
(Edited by HE Yun-bin)
���ĵ���
���ز��ζ���ʯ����Ӱ��Ŀ�����ģ���о�
ժҪ�����IJ��ÿ�������ϸ�۳߶��о���ͬ���ز��Σ�����β������Ҳ������Dz�������ʯ���˵�Ӱ�졣֮��������Ҳ�����ϸ�о���ϸ�۳߶���ʯ���˵�Ӱ�����أ��磺����Ƶ�ʡ�Ӧ����ֵ��ƽ��Ӧ��������·���������ֵ���������1�����ز��ζ���ʯ�����кܴ��Ӱ�졣��Щ�����У����β�����ʯ����Ӱ��������Ҳ���֮�����Dz�Ӱ����С����ÿ��ѭ���У�������Ŀ�ڼ��ض�����������ж�ضλ������ֲ��䡣2����ѭ�������£�����Ƶ�ʡ�Ӧ����ֵ��ƽ��Ӧ����Χѹ�ͼ���·������ʯ�����кܴ��Ӱ�졣����Ƶ�ʡ�Ӧ����ֵ��ƽ��Ӧ��Խ����ʯ���ۼƵ�����Խ�ࡣ�෴��ΧѹԽС����ʯ���ۼƵ�����Խ�ࡣ3��ƽ��Ӧ����Ӧ����ֵ����һ����ֵ�����������ֵ����֮ǰ��һЩѭ�����ز�����ʯû�������ۼơ�4���Ӹ�Ӧ������Ӧ�����رȴӵ�Ӧ������Ӧ�������ܶ���ʯ��ɸ�������ˣ�������ʯ���˾���·������ԡ�
�ؼ��ʣ���ʯ���ˣ����ѹ��̣�������������չ�����ز��Σ�ѭ�����أ�������
Foundation item: Projects(11702235, 51641905, 41472269) supported by the National Natural Science Foundation of China; Project(2017JJ3290) supported by the Natural Science Foundation of Hunan Province, China; Project(17C1540) supported by the Scientific Research Foundation of Education Department of Hunan Province, China; Project(16GES07) supported by the Open Research Fund of Hunan Key Laboratory of Geomechanics and Engineering Safety, China
Received date: 2017-01-17; Accepted date: 2017-04-30
Corresponding author: XIA Ming, PhD, Associate Professor;Tel: +86�C731�C58293084; E mail: xiaming105@126.com

