J. Cent. South Univ. Technol. (2010) 17: 79-84
DOI: 10.1007/s11771-010-0014-6 
Effect of substrate concentration on stability of anammox biofilm reactors
TANG Chong-jian(�Ƴ��)1, ZHENG Ping(֣ƽ)1, MAHMOOD Q2, CHEN Jian-wei(�½�ΰ)1
1. Department of Environmental Engineering, Zhejiang University, Hangzhou 310029, China;
2. Department of Environmental Sciences, COMSATS University, Abbottabad, Pakistan
? Central South University Press and Springer-Verlag Berlin Heidelberg 2010
Abstract: Ammonium and nitrite are two substrates of anammox bacteria, but they are also inhibitors under high concentrations. The performance of two anaerobic ammonium-oxidizing (anammox) upflow biofilm (UBF) reactors was investigated. The results show that anammox UBFs become unstable under nitrogen loading rate (NLR) applied higher than 1.0 g/(L��d). The consumptions of acidity in the anammox reaction lead to the increase of pH, which is as high as 8.70-9.05. Free nitrous acid concentration is accompanied to be lower than the affinity constant of anammox bacteria, and then starvation effect appears. Moreover, free ammonia concentration increases to 57-178 mg/L, resulting in inhibitory effect on the anammox bacteria. Both negative effects contribute to the instability of the anammox bioreactors.
Key words: anammox biofilm bioreactor; pH; free ammonia; free nitrous acid; nitrogen removal
1 Introduction
Anaerobic ammonium oxidation (anammox) is a new promising biological technique that was first discovered in a denitrification reactor in Delft, Netherlands [1]. In this process, Planctomycete-like bacteria consumed ammonium and nitrite to produce dinitrogen gas under anoxic condition [2]. Anammox process in combination with a preceding nitrification system named SHARON (single reactor high activity ammonium removal over nitrite) was implemented in Rotterdam, Netherlands to treat sludge liquor [3-4]. The nitrogen removal rate (NRR) achieved was as high as 9.5 kg/(m3��d) [4] with a significant reduction at operational costs for aeration and exogenous electron donor, leading to a decrease as compared to the conventional nitrification-denitrification process [3]. The biochemical reactions of anaerobic ammonium oxidation can be represented as follows [5]:
NH4++1.32NO2-+0.066HCO3-+0.13H+��1.02N2+
0.26NO3-+0.066CH2O0.5N0.15+2.03H2O (1)
A drawback in the application of the anammox process is longer start-up period taken due to low cellular yield and growth rates of anammox bacteria [4-5] (the doubling time reported by STROUS et al [6] is approximately 11 d). Furthermore, the working of anammox bioreactors is not stable mainly due to substrate inhibition if high nitrogen loading rates are applied [7-8].
It is well-known that the hydrophobic molecules can diffuse passively into the cell [9]. KADAM and BOONE [10] elucidated that ammonia molecule can enter cells as the unprotonated form (NH3), which diffuses readily across the cell membrane, equilibrating the intracellular and extracellular concentrations of NH3. On the other hand, ammonium (NH4+) does not readily diffuse through lipid membranes. Many researches support the hypothesis that non-ionized molecules are true substrates or actual inhibitors to the microorganisms. It has been demostrated that the substrate of ammonia-oxidizing bacteria is represented by free ammonia (NH3) rather than ionized ammonium (NH4+) [11-12]. HULLE [11] also proposed that the substrate of nitrite-oxidizing bacteria is represented by molecule nitrogen form (HNO2). VADIVELU et al [13] demonstrated that free ammonia and free nitrous acid can affect the anabolic and catabolic process of an enriched Nitrosomonas culture. However, they become inhibitors under high concentrations. The objectives of this work are therefore to demonstrate the relationship between the stability and substrate concentrations and to analyze the instability mechanisms for anammox bioreactors.
2 Experimental
2.1 Anammox bioreactor
Two upflow biofilm reactors (reactors UBF1 and UBF2) were operated in parallel (Fig.1). Both reactors had an inner diameter of 50 mm, a height of 750 mm and a working volume of 1.1 L. They were covered with black cloth to avoid the light inhibition and operated at (35��1) ��. Influent pH control was implemented to maintain the influent pH at 6.8.

Fig.1 Schematic diagram of UBF system: 1��Influent bottle; 2��Peristaltic pump; 3��UBF reactor; 4��Gas-liquid-solid separator; 5��Effluent collector; 6��Gas outlet
The UBFs were operated continuously and packed with string shaped three-dimensional-plastic media (Yixing, China) as support materials for biofilms. The specific area of the string is about 400 m2/m3 [8].
2.2 Seeding sludge
The two UBFs were inoculated with anaerobic granular sludge from a paper mill (UBF1) and denitrifying flocculent sludge from a denitrifying process (UBF2), respectively. The characteristics of the two inocula are illustrated in Table 1.
Table 1 Characteristics of seeding sludges
2.3 Synthetic wastewater
Ammonium and nitrite were supplemented to mineral medium as required in the form of (NH4)2SO4 and NaNO2, respectively. The composition (g/L except for trace element solution) of the mineral medium was: NaH2PO4 0.05, CaCl2��2H2O 0.3, MgSO4��7H2O 0.3, KHCO3 0.5, FeSO4 0.006 25, EDTA 0.006 25 and 1.25 ml/L of trace elements solution. The trace element solution contained (g/L) (adapted from GRAAF et al [2]): EDTA 15, H3BO4 0.014, MnCl2��4H2O 0.99, CuSO4��5H2O 0.25, ZnSO4��7H2O 0.43, NiCl2��6H2O 0.19, NaSeO4��10H2O 0.21, NaMoO4��2H2O 0.22 and NaWO4��2H2O 0.050.
2.4 Experiment process
Both reactors were stated at fixed hydraulic retention time (HRT) after start-up, i.e. 9.1 and 15.3 h for UBF1 and UBF2, respectively. The nitrogen loading rate (NLR) was increased stepwise by raising approximately equimolar concentrations of NH4+-N and NO2--N after every 2-4 d. The molar ratios of NO2--N to NH4+-N in the influent were kept at 1.0-1.2 (lower than the theoretical value by Eq.(1)), in order to reduce the inhibitory effect caused by nitrite [4, 8].
2.5 Analytical methods
The influent and effluent samples were collected on daily basis and analyzed immediately or stored in a refrigerator at 4 �� until the analyses were carried out. The determination of NH4+-N, NO2--N and NO3--N, pH, SS and VSS concentrations was performed according to the standard methods [14]. pH meter was calibrated every 2 d according to the meter instruction.
3 Results
3.1 Stable operation
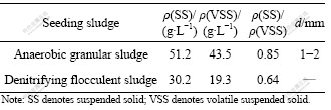
The operation of UBF1 started up by using anaerobic granular sludge lasted for 60 d during the loading test (Fig.2). The HRT was kept at 9.1 h. When the influent ammonium and nitrite concentrations were 80 mg/L each, the effluent ammonium concentration was 29 mg/L and the nitrite was completely depleted (Fig.2(a)). The ammonium and nitrite removal efficiencies were 64% and 100%, respectively. The effluent pH was 8.15. While NLR increased to 0.963 g/(L��d) (178 mg/L NH4+-N and 188 mg/L NO2--N in the inlet), and the ammonium and nitrite removal efficiencies were 89% and 100%, respectively, with NRR of 0.916 g/(L��d). Correspondingly, effluent pH increased to 8.31. Thereafter, NRR of 1.663 g/(L��d), ammonium and nitrite removal efficiencies of 94% and nearly 100% respectively were observed when NLR was increased to 1.711 g/(L��d) (300 mg/L NH4+-N and 350 mg/L NO2--N in the inlet). Effluent pH progressively rose to 8.78.
During the normal operation period of UBF1, the molar ratios of ammonium conversion to nitrite removal and to nitrate production were 1?(1.21��0.07)?(0.04��0.08). The maximum nitrogen removal rate (MNRR) was 1.731 g/(L��d) (Fig.2(b)).
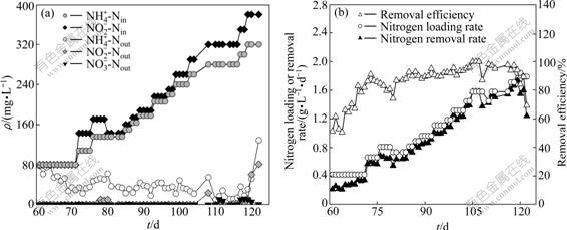
Fig.2 Performance of UBF1 during substrate elevation test: (a) Nitrogen concentration; (b) Nitrogen removal performance
The average values (S0) and standard deviations (Sd) of NRR, nitrogen removal efficiency, effluent substrate (NH4+-N+NO2--N) concentrations and pH value with different NLRs are listed in Table 2. Relative standard deviation (��) was calculated by the following equation.
Table 2 Stability analysis of UBF1 and UBF2

 ��100% (2)
UBF2 was transited from denitrifying sludge. During the 54 d of loading test operation (Fig.3 and Table 2), the molar ratios of NH4+-N conversion to NO2--N removal and to NO3--N production were 1?(1.30��0.11)?(0.15��0.03) with the MNRR as high as 1 041 mg/(L��d). Compared to UBF1, the stoichiometric ratios are closer to those of the anammox reaction (Eq.(1)).
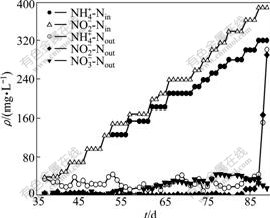
Fig.3 Performance of UBF2 during substrate elevation test
3.2 Performance deterioration
In practice, the maximum conversion capacity of anammox bioreactors will reach when high NLR is applied. If NLR surpasses the maximum conversion capacity, deterioration of reactor performance may occur accordingly [7]. Previously, no specific standard was available to judge the destabilization of anammox process. Therefore, nitrogen removal efficiency of 70% is considered as the standard based on the operational performance of the two UBFs.
In the case of UBF1, the influent ammonium and nitrite concentrations during days 119-122 were further increased to 320 and 380 mg/L, respectively. Effluent ammonium and nitrite concentrations went up to 129 mg/L and 80 mg/L, respectively (Fig.2(a)). Accordingly, ammonium, nitrite and nitrogen removal efficiencies decreased to 60%, 79% and 69%, respectively. Based on the standard mentioned above, destabilization of the reactor performance was observed. NRR decreased to 1.240 g/(L��d) with effluent pH as high as 9.05. During this period, the molar ratios of NH4+-N to NO2--N removal and to NO3--N production were 1?(1.33��0.12)?(0.015��0.016). The lower ratio of nitrate production to ammonium removal suggests that denitrification happens due to the cell lysis [15].
Likewise, for UBF2 in days 87-89, the NLR was increased to 1.117 g/(L��d) (influent ammonium and nitrite concentrations were 320 and 390 mg/L, respectively). Effluent ammonium and nitrite concentrations significantly increased to 301 mg/L and 290 mg/L, respectively (day 89, see Fig.3). As a consequence, ammonium, nitrite and nitrogen removal efficiencies declined sharply to 6%, 23% and 15%, respectively. Reactor performance deteriorated significantly at NRR of 171 mg/(L��d).
The molar ratios of NO3--Nproduced to NH4+-Nremoved for both UBFs are much lower than their normal operational values. As described by JIN et al [8], the output of anammox organisms can be estimated indirectly by the amount of nitrate produced in the reactors. Therefore, the lower molar ratios showed a pronounced lower growth rate of anammox bacteria during this period.
The relative standard deviations (��) of NRR, nitrogen removal efficiency and effluent substrate (NH4+-N+NO2--N) concentration for UBF1 are lower than the corresponding values for UBF2 (Table 2), indicating that the stability of UBF1 is better. However, using effluent substrate concentration as effectiveness index, the values of UBF1 and UBF2 are (48��52) mg/L and (108��181) mg/L, and the relative standard deviations (��) are as high as 108% and 168%, respectively, which suggests that both reactors display weak stability.
4 Discussion
4.1 pH increase
From Table 2 and Fig.4, the effluent pH values in both reactors increased to 8.70-9.05 when the applied NLR was higher than 1.0 g/(L��d). The phenomenon of pH increase in anammox process was also observed by LIU et al [16] and ZHONG et al [17].
Based on the stoichiometry of anammox reaction (Eq.(1)), 0.13 mol H+ is consumed when 1 mol of ammonium is converted. GRAAF et al [2] also predicted that 0.09 mol OH- is produced when 1 mol of ammonium was consumed, resulting in an increase of effluent pH in the anammox process. During the normal operation period, the effluent pH increases with the rise of NRR (Fig.4). Regression analysis reveals that there is a linear relationship between effluent pH and NRR (Eq.(3) and Eq.(4)).
y1=7.91+5.13��10-4 x1 (3)
y2=7.87+8.35��10-4 x2 (4)

Fig.4 Relationship between effluent pH and nitrogen removal rate: (a) UBF1; (b) UBF2
where x is NRR, mg/(L��d); y is the effluent pH; and subscripts 1 and 2 represent UBF1 and UBF2, respectively.
4.2 Effect of substrates
pH has indirect effects on the NH3/NH4+ and HNO2/NO2- equilibrium [19-20]. Free ammonia and free nitrous acid concentrations at various steps of the process can be calculated as follows [20]:
 (5)
(5)
 (6)
(6)
where ��(FA) is the free ammonia concentration, mg/L; ��(NH4+-N) is the total ammonium concentration, mg/L; ��(FNA) is the free nitrous acid concentration, mg/L; ��(NO2--N) is the total nitrite concentration, mg/L; and t is the temperature, ��.
According to Ref.[21], the flow pattern of anammox UBF is similar to that of a continuously stirred tank reactor (CSTR) mainly due to the dinitrogen gas produced in the reactor. No difference of substrate concentrations was observed along with the height of the reactor when the applied NLRs were 0.921 and 1.300 g/(L��d) (HRT was 14.4 h without recycling). Therefore, effluent substrate concentrations can be used to evaluate the sufficiency and deficiency of free ammonia and free nitrous acid inside the reactor as the NLRs applied in this work are comparable to the values mentioned above.
During the days when NRR increased progressively, free ammonia concentrations of UBF1 and UBF2 were (7��5) mg/L (Fig.5(a)) and (5��4) mg/L (Fig.5(b)), respectively, which are higher than the affinity constant of free ammonia (KS, FA) for anammox mixed culture, i.e., 3 mg/L [22], indicating that free ammonia is sufficient in both UBFs. However, free nitrous acid concentrations were only (2��4)��10-5 mg/L (Fig.5(a)) and (2��3)��10-5 mg/L (Fig.5(b)) for UBF1 and UBF2, respectively, mainly due to the high pH, both of which are lower than the affinity constant of free nitrous acid (KS, FNA) for anammox mixed culture (3��10-4 mg/L) [22], suggesting that relative deficiency of free nitrous acid presented in both reactors. Therefore, anammox bacteria in both reactors are in the condition of starvation.
Fig.5 Variations of free ammonia and free nitrous acid concentrations and nitrogen removal rate under high nitrogen loading rate: (a) UBF1; (b) UBF2
4.3 Effect of inhibitors
NH3 and HNO2 are considered to be inhibitory compounds for organisms when they surpass the threshold inhibition concentration [13]. For the period when NRR gradually increased, free ammonia and free nitrous acid concentrations of UBF1 and UBF2 are lower than the corresponding inhibitory constant of anammox mixed culture, which is 37-76 mg/L [22-23] for free ammonia (KI, FA) and 3-11 ��g/L [22-24] for free nitrous acid (KI, FNA), respectively, suggesting that no inhibitory effect is induced either by free ammonia or free nitrous acid.
As described before, anaerobic ammonium oxidation resulted in the rise of pH. Correspondingly, high pH is accompanied by the starvation effect of free nitrous acid and inhibitory effect of free ammonia for anammox bacteria, exacerbating the failure of reactor performance. Considering that anaerobic ammonium oxidation is the reaction between free ammonia and free nitrous acid, residual free ammonia concentration in the liquid increases due to the starvation effect of free nitrous acid, which is detrimental for the stability of anammox bioreactors.
During the period when NRR declined, the residual substrate concentrations increased progressively; however, pH is still higher than 8.70. Under these conditions, a sharp increase of free ammonia concentration and inhibitory effect of free ammonia appears. WAKI et al [25] presumed that free ammonia concentrations of 13-90 mg/L were toxic to anammox process. For UBF2, free ammonia concentration significantly went up to 178 mg/L (Fig.5(b)), which is far more than KI, FA mentioned before, causing an inhibition of growth and metabolism of anammox bacteria. Therefore, the process deterioration of anammox bioreactors is finally observed. Free ammonia concentration of UBF1 increased to 57 mg/L on the 3rd day after the decline of NRR (Fig.5(a)). Free ammonia concentration higher than KI, FA would be predicted in the following days if the reactors are operated under similar conditions with high NLRs. The inhibitory effect caused by free ammonia is considered to be the essential reason for the failure of reactor performance.
5 Conclusions
(1) The two reactors have the maximum conversion capacity during the elevation of substrate concentration. When nitrogen (substrate) loading rate surpasses the maximum conversion capacity, performance deterioration will be observed in both reactors. The nitrogen removal and stability performance of UBF1 seeded with anaerobic granular sludge is better than that of UBF2 seeded with denitrifying flocculent sludge. The maximum nitrogen removal rates of UBF1 and UBF2 are 1.731 and 1.041 g/(L��d), respectively.
(2) Based on the comparison of the two anammox UBFs, it is believed the essential reason for destabilization of anammox bioreactor is the increase of pH (8.7-9.05). Deficiency of free nitrous acid and inhibitory effect of free ammonia on anammox bacteria are then accompanied. The inhibitory effect of high free ammonia concentration (57-178 mg/L) is the probable cause of destabilization of anammox bioreactors and the subsequent failure of reactor performance. It can be observed that influent alkalinity has a high influence on effluent pH, and finally affects the nitrogen removal performance. The research of alkalinity influence on effluent pH and reactor performance would be further investigated.
References
[1] MULDER A, van de GRAAF A, ROBERTSON L, KUENEN J. Anaerobic ammonium oxidation discovered in a denitrifying fluidized bed reactor [J]. FEMS Microbiol Ecol, 1995, 16(3): 177- 184.
[2] van de GRAAF A, de BRUIJN P, ROBERTSON L, JETTEN M, KUENEN J. Autotrophic growth of anaerobic ammonium-oxidizing microorganisms in a fluidized bed reactor [J]. Microbiology (UK), 1996, 142(8): 2187-2196.
[3] van DONGEN U, JETTEN M, van LOOSDRECHT M. The SHARON?�CAnammox? process for treatment of ammonium rich wastewater [J]. Water Sci Technol, 2001, 44(1):153-160.
[4] van der STAR W, ABAMA W, BOLMMERS D, MULDER J, TOKUTOMI T, STROUS M, PICIOREANU C, van LOOSDRECHT M. Startup of reactors for anoxic ammonium oxidation: Experiences from the first full-scale anammox reactor in Rotterdam [J]. Water Res, 2007, 41(18): 4149-4163.
[5] ZHANG H, ZHOU S. Treating leachate mixture with anaerobic ammonium oxidation technology [J]. J Cent South Univ Technol, 2006, 13(6): 663-667.
[6] STROUS M, HEIJNEN J, KUENEN J, JETTEN M. The sequencing batch reactor as a powerful tool for the study of slowly growing anaerobic ammonium-oxidizing microorganisms [J]. Appl Microbiol Biotechnol, 1998, 50(5): 589-596.
[7] DAPENA-MORA A, CAMPOS J, MOSQUERA-CORRAL A, JETTEN M, MENDEZ R. Stability of the anammox process in a gas-lift reactor and a SBR [J]. J Biotechnol, 2004, 110(2): 159-170.
[8] JIN R, ZHENG P, HU A, MAHMOOD Q, HU B, JILANI G. Performance comparison of two anammox reactors: SBR and UBF [J]. Chem Eng J, 2008, 138(1/3): 224-230.
[9] SOSSA K, ALAROCN M, ASPE E, URRUTIA H. Effect of ammonia on the methanogenic activity of methylaminotrophic methane producing archaea enriched biofilm [J]. Anaerobe, 2004, 10(1): 13-18.
[10] KADAM P, BOONE D. Influence of pH on ammonia accumulation and toxicity in halophilic, methylotrophic methanogens [J]. Appl Environ Microbiol, 1996, 62(12): 4486-4492.
[11] van HULLE S. Modelling, simulation and optimization of autotrophic nitrogen removal processes [D]. Ghent: Ghent University, 2005.
[12] GANIGUE R, LOPEZ H, BALAGUER M, COLPRIM J. Partial ammonium oxidation to nitrite of high ammonium content urban landfill leachates [J]. Water Res, 2007, 41(15): 3317-3326.
[13] VADIVELU V, KELLER J, YUAN Z. Effect of free ammonia and free nitrous acid concentration on the anabolic and catabolic processes of an enriched Nitrosomonas culture [J]. Biotechnol Bioeng, 2006, 95(5): 830-839.
[14] APHA-AWWA-WEF. Standard methods for water and wastewater examination [M]. 20th ed. Washington DC: American Public Health Association, 1998: 258-284.
[15] CHAMCHOI N, NITISORAVUT S. Anammox enrichment from different conventional sludges [J]. Chemosphere, 2007, 66(11): 2225-2232.
[16] LIU S, YANG F, GONG Z, MENG F, CHEN H, XUE Y, FURUKAWA K. Application of anaerobic ammonium-oxidizing consortium to achieve completely autotrophic ammonium and sulfate removal [J]. Bioresour Technol, 2008, 99(15): 6817-6825.
[17] ZHONG Hong-chun, ZHOU Shao-qi, YAO Jun-qin, ZHU Ming-shi, HU Yong-chun, WU Fang. Comparative study of experimental start-up and operation in two UASB-ANAMMOX reactors [J]. Journal of Chemical Industry and Engineering, 2007, 58(11): 2798-2804. (in Chinese)
[18] STROUS M, KUENEN J, JETTEN M. Key physiological parameters of anaerobic ammonium oxidation [J]. Appl Environ Microbiol, 1999, 65(7): 3248-3250.
[19] WARD R, ASHLEY C. Comparative effects of ammonia and related compounds on Poliovirus [J]. Appl Environ Microbiol, 1978, 36(1): 198-200.
[20] MOSQUERA-CORRAL A, GONZALEZ F, CAMPOS J, MENDEZ R. Partial nitrification in a SHARON reactor in the presence of salt and organic carbon compounds [J]. Process Biochem, 2005, 40(9): 3109-3118.
[21] JIN Ren-cun. Performance of autotrophic nitrogen removal bioreactors [D]. Hangzhou: Zhejiang University, 2007. (in Chinese)
[22] ZHENG Ping, HU Bao-lan. Kinetics of anaerobic ammonium oxidation [J]. Chinese Journal of Biotechnology, 2001, 17(2): 193-198. (in Chinese)
[23] DAPENA-MORA A, FERNANDEZ I, CAMPOS J, MOSQUERA-CORRAL A, MENDEZ R, JETTEN M. Evaluation of activity and inhibition effects on anammox process by batch tests based on the nitrogen gas production [J]. Enzyme Microb Technol, 2007, 40(4): 859-865.
[24] STROUS M. Microbiology of anaerobic ammonium oxidation [D]. Delft: TU Delft, 2000.
[25] WAKI M, TOKUTOMI T, YOKOYAMA H, TANAKA Y. Nitrogen removal from animal waste treatment water by Anammox enrichment [J]. Bioresour Technol, 2007, 98(14): 2775-2780.
Foundation item: Project(2006AA06Z332) supported by the National High-Tech Research and Development Program of China; Project(30770039) supported by the National Natural Science Foundation of China; Project(2008BADC4B05) supported by the National Science and Technology Pillar Program
Received date: 2009-02-25; Accepted date: 2009-05-17
Corresponding author: ZHENG Ping, PhD, Professor; Tel: +86-571-86971709; E-mail: pzheng@zju.edu.cn
(Edited by YANG You-ping)

