J. Cent. South Univ. Technol. (2010) 17: 460-466
DOI: 10.1007/s11771-010-0507-3 
Kinetics analysis of Ni-TiO2 composite system during initial stages of electro-crystallization
HU Wei(胡炜)1, 2, TAN Cheng-yu(谭澄宇)1, 2, CUI Hang(崔航)1, 2, LIU Yu(刘宇)1, 2, ZHENG Zi-qiao(郑子樵)1, 2
1. School of Materials Science and Engineering, Central South University, Changsha 410083, China;
2. Key Laboratory of Nonferrous Metal Materials Science and Engineering, Ministry of Education,
Central South University, Changsha 410083, China
? Central South University Press and Springer-Verlag Berlin Heidelberg 2010
Abstract: The initial stage of Ni-TiO2 composite system electrodeposition on glassy carbon electrode from an acidic solution of nickel sulfate was investigated using cyclic voltammetry (CV), chronoamperometry (CA) and electrochemical impedance spectroscopy (EIS). Analysis of current density-time transients was performed using the nonlinear fitting procedure and electrochemical impedance spectroscopy was simulated by Z-view software. Besides, the surface morphology of Ni-TiO2 co-deposition at the initial stage was observed by scanning electron microscopy (SEM). The results show that, in the case of low overpotential (-790 mV vs SCE), the presence of TiO2 particles in the plating bath makes the nucleation relaxation time tmax decreased clearly. Meanwhile, the electro-crystallization of Ni-TiO2 system follows a Scharifker-Hills (SH) progressive nucleation/growth mechanism. While in the case of higher overpotential, the presence of the TiO2 particles in solution makes the nucleation relaxation time tmax increased. At -850 mV (vs SCE), the co-deposition of Ni-TiO2 system meets SH instantaneous nucleation/growth mechanism. The results of impedance spectra show that the appearance of the characteristic inductive loops represents the nucleation/growth of nickel and the presence of TiO2 particles reduces the charge transfer resistance of solution. The SEM observation confirms that TiO2 particles can be considered as favorable sites for nickel nucleating.
Key words: Ni-TiO2 system; kinetics; electro-crystallization; cyclic voltammetry; electrochemical impedance spectroscopy
1 Introduction
The composite coatings usually made up of solid grain and matrix metal have good properties for various applications and have attracted researchers’ attention. Many literatures about preparation method, process and properties of various composite coatings have been published in recent years [1-4]. Several researchers [5-8] also studied the mechanics on metal co-deposition with solid particles. But few papers on electro-crystallization behavior of composite co-deposition were reported by using electrochemical measurement techniques.
The electro-crystallization process mainly relates to nucleation and growth of electrodeposition. At present, there are many mathematic models of electro- crystallization on metal electrodeposition process, including 2D disk mode, 3D hemisphaerium shape and regular cone mode. 3D semi-sphere mode and 3D code mode are widespreadly recognized [9-12]. Electro- deposition is normally associated with a 2D or 3D growth process where the number of nuclei formed on the electrode surface is strongly dependent on the overpotential. The competition between nucleation and growth determines the granularity of the deposit. The crystal grains of the deposits will be finer if the nucleation rate is higher. The type of growing crystals determines the general appearance and the deposit structure. An excellent review of metal deposition and electrochemical phase formation and growth is given by BUDEVSKI et al [13].
The study of nucleation via electrochemical methods has certain advantages over other methods of investigating heterogeneous nucleation: the changing force of the nucleation can be varied simply by varying the applied potential. This stimulates a number of theoretical studies of nucleation kinetics aimed at deriving explicit expressions for current of progressive and instantaneous nucleation in the case of diffusion controlled growth of hemispherical clusters on a plane substrate. Different methods used to analyze current transients and to obtain information on the nucleation and growth parameters were also proposed [14-17]. A review of the analysis of multiple nucleation with diffusion controlled growth is given in Ref.[18].
Although many studies involving nickel electrodeposition have been published, the co-deposition of Ni-TiO2 on an assembly of carbon fiber microelectrodes has not been reported yet. Therefore, the purpose of this work is to verify the dynamics process of Ni-TiO2 co-deposition using cyclic voltammetry (CV), chrono- amperometry (CA) and electrochemical impedance spectroscopy (EIS).
2 Experimental
The Ni-TiO2 layers were electrodeposited from suspension of TiO2 particles in aqueous nickel sulfate- chloride electrolyte. The mean diameter of TiO2 particles was about 1 μm. The composition of the plating bath was: 250 g/L nickel sulfate (NiSO4・6H2O)+40 g/L nickel chloride (NiCl2・6H2O)+ 35 g/L boric acid (H3BO3)+1 g/L sodium dodecylsulfate (CH3(CH2)11OSO3Na). The pH of the solution was 4.04. Suspensions were prepared by adding TiO2 particles to the solution to give a concentration of 25 g/L. The suspensions were stirred for 8-12 h by thermostat temperature magnetic stirrer, and then dispersed for 3-4 h by ultrasonic before deposition.
A standard three-electrode was used in the test. The reference electrode was a conventional saturated calomel electrode (SCE). All potentials reported in the text were referred to this electrode. The working electrode was a glassy carbon electrode. A platinum gauze was used as the counter electrode. All electrochemical tests were performed with a commercial model CHI 660C electro- chemical analyzer. Cyclic voltammetric measurements were performed at a sweep rate of 100 mV/s. The current density-time curves were measured in the range from -250 to -850 mV (vs SCE). Impedance spectra were acquired in the frequency range from 10 kHz to 0.001 Hz with a 5 mV amplitude sine wave. Before measurement, the bath solution would hold still stabilization for 30 min or so. (J/Jmax)2-t/tmax (J is the current density, and t is time) diagrams of Ni or Ni-TiO2 system were plotted from the corresponding experimental J-t curves. All experiments were carried out at (50 ±1) ℃ controlled by thermostat water tank. The surface morphologies of Ni coating and Ni-TiO2 composite coating on copper electrode under various potentials were also observed with a Sirion200 type emission scanning electron microscope (SEM).
3 Results and discussion
3.1 Cyclic voltammetry
Cyclic voltammetry was used to determine the potential range in which the electro-crystallization of Ni takes place. The cyclic voltammetry curves of pure Ni and Ni-TiO2 systems recorded at a scan rate of 100 mV/s on the glass carbon electrode are shown in Fig.1. Going from the open circuit potential to the cathodic direction, in the Ni-TiO2 composite system, at -730 mV (vs SCE) or so, the current density gradually increases with increasing potential, which is the nucleation and growth process of Ni, while in the pure Ni system, until -750 mV (vs SCE), the reduction current density begins to increase. Besides, the reduction current density peak of Ni-TiO2 co-deposition exceeds that of pure Ni deposition, which may reflect the influence of TiO2 particles on the nucleation and growth process of Ni electro-deposition.
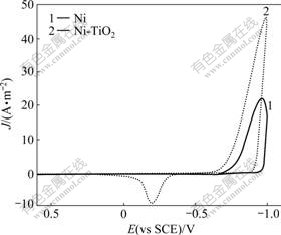
Fig.1 Cyclic voltammograms of pure Ni and Ni-TiO2 composite systems on glass carbon electrode at scan rate of 100 mV/s
3.2 Potentiostatic transients
Fig.2 shows the current density-time curves of Ni-TiO2 system on the glass carbon electrode under various step potentials. Under low overpotential, the current density decreases rapidly with increasing the deposition time due to the charge or discharge on electric double layer of the electrode surface (Fig.2(a)). As the transient potential Et shifts to the cathodic side, the maximum current density Jmax increases, while the corresponding time tmax decreases. The increase portion of current density is determined by the nucleation mechanism, while the current density decrease in long time (t>tmax) follows the Cottrell behavior [9]. The shape of the transients in Fig.2(b) is similar to that reported by TAN et al [19] for nucleation mechanism of Ni-SiC on the copper electrode. The obtained potentiostatic transients were fitted with the current density-time relationship derived for Scharifker-Hill (SH) models [20-22]. The models for instantaneous and progressive nucleation are given by Eqs.(1) and (2), respectively:
 (1)
(1)
 (2)
(2)
where
 F is Faraday
constant (C/mol); z is the number of electrons; M is the relative molecular mass (g/mol); ρ is the density (g/cm3); c is the bulk concentration (mol/cm3); N is the total number of nuclei formed at time t (cm-2); D is the diffusion coefficient (cm/s); and A is the constant of nuclei rate (s-1). In the following graphs, the instantaneous and the progressive mechanisms of SH models will be represented.
Fig.3 shows some non-dimensional (J/Jmax)2-t/tmax curves of pure Ni and Ni-TiO2 electrodeposition on glass carbon electrode under various step potentials. In Fig.3, the experimental data are located in the range between the progressive and the instantaneous nucleation of SH model. At -760 mV, the nucleation mechanism of pure Ni deposition can approach to the progressive nucleation fashion. With increasing overpotential, the nucleation fashion of pure Ni deposition may meet the instantaneous nucleation of SH model and the nucleation or growth current density may be controlled by diffusion behavior on electrode surface. The non-dimensional curves of Ni co-deposition with TiO2 particles are similar to those of pure Ni deposition. In the overpotential range from -760 to -790 mV, the nucleation fashion of Ni-TiO2 co-deposition may be close to the progressive nucleation model, and with increasing overpotential, Ni-TiO2 co-deposition may undergo the transition change from the progressive to the instantaneous nucleation model shown in Figs.3(c) and (d). At -850 mV, the test data on the uplifted side are very close to instantaneous nucleation theoretical curves, which indicates that at high overpotential, the nucleation of Ni-TiO2 co-deposition follows instantaneous nucleation of SH model
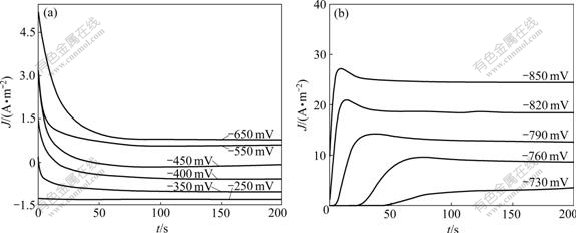
Fig.2 Chronoamperometry curves of Ni-TiO2 system on glass carbon electrode in different step potential ranges: (a) From -250 to -650 mV; (b) From -730 to -850 mV
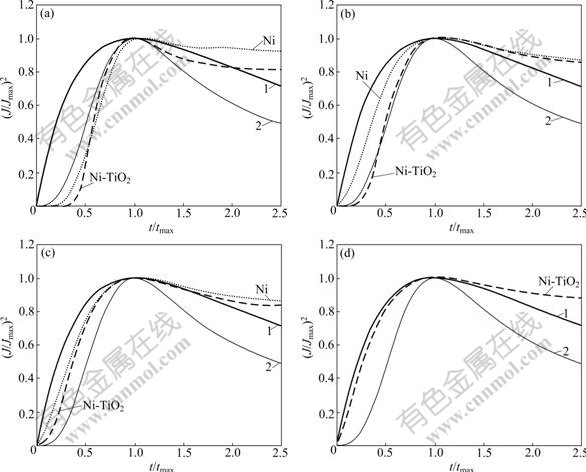
Fig.3 (J/Jmax)2-t/tmax plots of Ni and Ni-TiO2 systems at different overpotentials: 1―SH model of instantaneous; 2―SH model of progressive; (a) -760 mV; (b) -790 mV; (c) -820 mV; (d) -850 mV
.GOMEZ et al [23] studied early electro- crystallization behavior of Ni in NiCl2 system. They discovered that, at low overpotential, the nucleation mechanism of Ni deposition could approach to the progressive nucleation model, while at high overpotential, the nucleation mechanism of Ni deposition prefers instantaneous nucleation. These conclusions are consistent with the above experimental results.
Table 1 shows the experimental results for the
electro-crystallization of Ni deposition on glass carbon electrode from electrolyte at different step potentials. It is presented in Table 1 that, with increasing overpotential, relaxation time tmax of Ni electrodeposition in both systems reduces gradually, but the values of peak current density Jmax and the number density of growing centers N would increase gradually.
According to SH model, nuclei population density can be calculated for different step potentials as a function of peak current density Jmax and the corresponding peak time tmax:
 (3)
(3)
where Vm is the molar volume. The values of the number density of growing centers, N, are calculated according to Eq.(3) and shown in Table 1. With increasing cathodic potential the number density of the growing centers slightly increases.
Scanning electron microscopy was also used to study the morphology of the deposits obtained at -820 mV on cooper electrode. Fig.4(a) shows a micrograph of an electrodeposit obtained at -820 mV for 10 s, in which a few crystallites of defined hemispherical shape with an average size of about 100 nm are observed. When the deposits are obtained in Ni-TiO2 system the number of microcrystallites increases considerably (Fig.4(b)). The crystallites show multiple shapes and overlap. The deposits consist of a lot of hemispherical nuclei of variable size (Arrow 1), corresponding to an instantaneous nucleation and growth process and TiO2 particles (Arrow 2) that are gradually packaged by nickel nuclei on cooper electrode surface. The greater growth rate may be responsible for the difference in crystallites shape. These results are consistent with the experimental ones.
Table 1 Experimental results of Ni deposition on glass carbon electrode under different step potentials
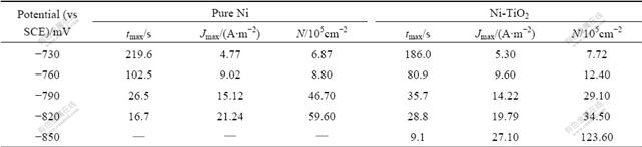
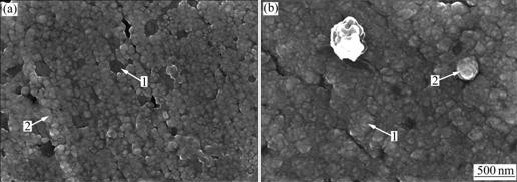
Fig.4 SEM images for Ni deposition (a) and Ni-TiO2 co-deposition (b) on copper electrode at -820 mV for 10 s
At low overpotential, the electro-crystallization of Ni meets the progressive nucleation model, and TiO2 particles offer more nucleation sites that are detrimental to crystal growth on the electrode surface and accelerate the nucleation process. The number density of growing centers, N, of Ni in Ni-TiO2 system is greater than that in pure Ni system. But at high overpotential, a lot of TiO2 particles are adsorbed on the electrode surface and inhibit nucleation or growth of Ni, thus accelerating the nucleation process. Therefore, the number density of growing centers, N, in pure Ni system is greater than that in Ni-TiO2 system.
3.3 Electrochemical impedance spectroscopy (EIS)
Fig.5 shows Nyquist plots and simulated plots for pure Ni and Ni-TiO2 composite systems at different negative potentials (from -730 to -850 mV). To confirm the diffusion process of Ni reduction and the influence of TiO2 particles, EIS measurements were performed at
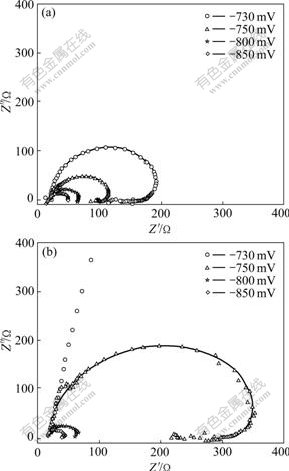
Fig.5 Experimental data (points) and simulated plots (solid line) for Ni-TiO2 composite system (a) and pure Ni system (b) at various potentials
different applied potentials. The spectra were analyzed and fitted using Z-view software. The applied potential has a significant effect on the impedance of the samples. At low overpotential, the spectra show a single large capacitive loop. With a negative step potential, the capacitive loop becomes small. From these EIS results the plots exhibit two regions of distinct electrochemical response: (1) at high frequencies a semicircular plot is obtained, characterized by a solution resistance, a double layer capacitance and a charge transfer resistance (Rt) of the faradic process. Rt is estimated from the diameter of this first high frequency capacitive loop; (2) at low frequencies, the capacitive loop enregistred at more anodic potentials (<-730 mV) possibly having the characteristics of diffusion impedance, is transformed at more cathodic potential (-730 mV) into a inductive loop in the Ni-TiO2 system (Fig.5(a)). While in the pure Ni system, at more cathodic potential (-750 mV, Fig.5(b)) the inductive loop is obtained.
The inductive loop was also observed by many researchers. It was believed that the inductive loop represented the presence of the intermediate. Some researchers represented the inductive loops as the surface coverage of the adsorbed intermediate [24], whereas other researchers considered that the loop was related to the adsorption/desorption process of intermediates on/from the cathode surface [25]. EPELBOIN et al [26] proposed a model using a chemical impedance procedure. In this work, it is considered that the reaction mechanism involving an intermediate species plays an important role in the rate-determining step. Under the experimental conditions, Ni-TiO2 and pure Ni systems present a inductive loop separately at -750 and -730 mV corresponding to the initial deposition potential of Ni. Obviously, the inductive loop is related to the electro- crystallization process of Ni on the cathode surface.
Although a number of researchers applied a inductive circuit to describe the electrodeposition behavior, FRANCESCHETTI and MACDONALD [27] pointed out that it is only an apparent inductance since real inductance requires storage of energy in a magnetic field and there is no appreciable AC magnetic field energy present in low current impedance spectrum measurements. They proposed a circuit that involves both a negative capacitor and a negative resistor. MACDONALD [28] also suggested that a RC element with negative capacitance and resistance (which will yield a positive RC time constant) provides a more physical representation of processes, leading to inductive features.
In this work, at low overpotentials (from -250 to -700 mV), the impedance spectra only present a capacitive loop in pure Ni and Ni-TiO2 systems, and in the corresponding Bode plots also only present a phase peak, corresponding to a time constant. Therefore, the equivalent circuit was used to represent the electrochemical process at low overpotentials. However, at high overpotentials (from -730 to -850 mV), the spectra present a inductive loop, corresponding to the electrodeposition of Ni and the equivalent circuit shown in Fig.6 is applied to representing the electrochemical response during the electrodeposition of Ni-TiO2 composite coatings. We could know from classical theory in Ref.[29] that the description of these two equivalent circuits was the same electrochemistry reaction mechanism, but the value of each element would be changed with the meaning of element [30].
In Fig.6, Rs is the solution resistance between the reference and the working electrodes, which represents the resistance of ions in the electrolyte that are transferred to the electrode; CPE1 is the constant phase element that correlates with the double layer capacitance of interface between the electrode and the electrolyte; Rt is the charge transfer resistance of reactions in the electrolyte; Rf is the faradic resistance, and L1 is the inductance.
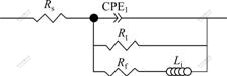
Fig.6 Equivalent circuit describing electrochemical response during electrodeposition of Ni-TiO2 composite system
The fitting EIS parameters for pure Ni and Ni-TiO2 at different deposition potentials are listed in Table 2. Between -350 and -700 mV, the order of magnitude of Rt is 104, and Rt decreases with the increase of the applied potential. When the applied potential increases to -750 mV, Rt decreases abruptly in the pure Ni system, while in the Ni-TiO2 system, the process occurs at more anodic potential (-730 mV). Rt decreases abruptly due to the starting of Ni deposition.
In the present bath composition, the nickel ions are firstly adsorbed on the electrode and incorporated with mono-hydroxide ions, as described by Eq.(4), and reduced to nickel adatoms in two steps, represented by Eqs.(5)-(6). The nickel adatoms will then enter kink sites and produce a film on the deposit [5]:
Ni2++OH-→Ni(OH)+ (4)
Ni(OH)+→ (5)
(5)
+2e→Ni+OH- (6)
Although the addition of TiO2 particles in the bath has a significant effect on the electrodeposition behaviour, Eqs.(5)-(6) are still considered to be the rate-
Table 2 Fitting EIS parameters for pure Ni and Ni-TiO2 systems at different step potentials
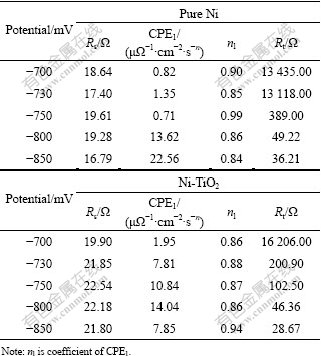
determining steps and will be used in formulating the equivalent circuit model for the composites. The addition of TiO2 particles influences the reactions in three ways: (1) offering more nucleation sites that are detrimental to crystal growth; (2) particles will enhance the ionic transport, and also activate the nickel reduction; and (3) the presence of TiO2 particles in the solution results in an increase in surface roughness and blocks off part of the electrode surface.
4 Conclusions
(1) According to the cyclic voltammetric (CV) curves of pure Ni and Ni-TiO2 system electrodeposition on the glass carbon electrode, the co-deposition behavior is influenced by TiO2 particles, and the nucleation potential of Ni turns to positive direction.
(2) At low overpotentials, the existence of TiO2 particles increases the number density of growing centers on the surface of cathode and accelerates the nucleation process; at -790 mV (vs SCE), the Ni nucleation proceeds as a 3D progressive nucleation of SH model. At high overpotentials, TiO2 particles inhibit the nucleation or the growth of Ni; at -850 mV (vs SCE), the Ni nucleation proceeds as a 3D instantaneous nucleation.
(3) Impedance spectra are influenced by the presence of TiO2 particles. At low overpotentials, the presence of TiO2 particles in bath decreases the charge transfer resistance and accelerates Ni nucleation process on cathode surface, but the discharge mechanism of Ni may not be changed.
References
[1] BENEA L, BONORA P L, BORELLO A, MARTELLI S, WENGER F, PONTHIAUX P, GALLAND J. Preparation and investigation of nano-structured SiC-Ni layers by electrodeposition [J]. Solid State Ionics, 2002, 151(1/4): 89-95.
[2] LI J, SUN Y, SUN X, QIAO J. Mechanical and corrosion-resistance performance of electrodeposited titania-nickel nano-composite coating [J]. Surface and Coatings Technology, 2005, 192(2/3): 331- 335.
[3] PENG X, ZHANG Y, ZHAO J, WANG F. Electrochemical corrosion performance in 3.5% NaCl of the electrodeposited nanocrystalline Ni films with and without dispersions of Cr nanoparticles [J]. Electrochimica Acta, 2006, 51(23): 4922-4927.
[4] WANG Hong-zhi, YAO Su-wei. Electrochemical preparation and characterization of Ni/SiC gradient deposit [J]. Journal of Materials Processing Technology, 2004, 145(3): 299-302.
[5] HU F, CHAN K C. Equivalent circuit modelling of Ni-SiC electrodeposition under ramp-up and ramp-down waveforms [J]. Materials Chemistry and Physics, 2006, 99(2/3): 424-430.
[6] LEE H K, LEE H Y, JEON J M. Codeposition of micro- and nano-sized SiC particles in the nickel matrix composite coatings obtained by electroplating [J]. Surface and Coatings Technology, 2007, 201(8): 4711-4717.
[7] LIN C S, HUANG K C. Co-deposition and microstructure of Ni-SiC composite coating electrodeposited from sulphamate bath [J]. Journal of Applied Electrochemistry, 2004, 34(10): 1013-1019.
[8] HU F, CHAN K C. Deposition behavior and morphology of Ni-SiC electro-composites under triangular waveform [J]. Applied Surface Science, 2005, 243(1/4): 251-258. (in Chinese)
[9] ZHA Quan-xing. Guide to dynamics of electrode process [M]. 3rd ed. Beijing: Scientific and Technical Press, 2004: 308-310. (in Chinese)
[10] BEWICK A, FLEISCHMANN M, THIRSK H R. Kinetics of the electro-crystallization of thin films of calomel [J]. Transactions of the Faraday Society, 1962, 58: 2200-2216.
[11] BARD A J, FAULKNER L R. Electrochemical methods fundamentals and applications [M]. 2nd ed. Beijing: Chemical Industry Press, 2005: 110-153.
[12] MILCHEV A. Electro-crystallization―Fundamentals of nucleation and growth [M]. New York: Kluwer Academic Publishers, 2002: 220-240.
[13] BUDEVSKI E, STAILOV G, LORENZ W J. Electro-crystallization: Nucleation and growth phenomena [J]. Electrochimica Acta, 2000, 45(15/16): 2559-2574.
[14] MILCHEV A, HEERMAN L. Electrochemical nucleation and growth of nano-and microparticles: Some theoretical and experimental aspects [J]. Electrochimica Acta, 2003, 48(20/22): 2903-2913.
[15] SLUYTERS-REHBACH M, WIJENBERG J H O J, BOSCO E, SLUYTERS J H. The theory of chronoamperometry for the investigation of electro-crystallization: Mathematical description and analysis in the case of diffusion-controlled growth [J]. Journal of Electroanalytical Chemistry, 1987, 236(1/2): 1-20.
[16] HEERMAN L, TARALLO A. Theory of the chronoamperometric transient for electrochemical nucleation with diffusion-controlled growth [J]. Journal of Electroanalytical Chemistry, 1999, 470(1): 70-76.
[17] HEERMAN L, TARALLO A. Electrochemical nucleation with diffusion-limited growth: Properties and analysis of transients [J]. Electrochemistry Communications, 2000, 2(2): 85-89.
[18] HEERMAN L, TARALLO A. Electrochemical nucleation on microelectrodes: Theory and experiment for diffusion-controlled growth [J]. Journal of Electroanalytical Chemistry, 1998, 451(1/2): 101-109.
[19] TAN Cheng-yu, LIU Yu, ZHAO Xu-shan, ZHENG Zi-qiao. Nickel co-deposition with SiC particles at initial stage [J]. Transactions of Nonferrous Metals Society of China, 2008, 18(5): 1128-1133.
[20] FLEISCHMANN M, THIRSK H R. Kinetics of the growth of deposits on electrodes [J]. Eletroshimica Acta, 1959, 1: 146-160.
[21] HOLZLE M H, RETTER U, KOLB D M. The kinetics of structural changes in glass carbon layers on Au(Ⅲ) [J]. Journal of Electroanalytical Chemistry, 1994, 371(1): 101-109.
[22] ENRIQUE B, MANUEL P P, NIKOLA B, IGNACIO G. Formation mechanisms and characterization of black and white cobalt electrdeposition onto stainless steel [J]. Journal of Electrochemical Society, 2000, 147(5): 1787-1796.
[23] GOMEZ E, MULLER C, PROUD W G, VALLES E. Electrodeposition of nickel on vitreous carbon: Influence of potential on deposit morphology [J]. Journal of Applied Electrochemistry, 1992, 22(9): 872-876.
[24] WATSON S W, WALTERS P R. The effect of chromium particles on nickel electrodeposition [J]. Journal of Electrochemical Society, 1991, 138(12): 3633-3637.
[25] NOWAK P, SOCHA R P, KAISHEVA M, FRANSAER J, CELIS J P, STOINOV Z. Electrochemical investigation of the codeposition of SiC and SiO2 particles with nickel [J]. Journal of Applied Electrochemistry, 2004, 21(30): 429-437.
[26] EPELBOIN I, JOUSSELLIN M, WIART R. Impedance measurements for nickel deposition in sulfate and chloride electrolytes [J]. Journal of Electroanalytical Chemistry, 1981, 119: 61.
[27] FRANCESCHETTI D R, MACDONALD J R. Electrode-kinetics, equivalentcircuits, and system characterization-small-single conditions [J]. Journal of Electroanalytical Chemistry, 1997, 2(82): 271-301.
[28] MACDONALD J R. Impedance spectroscopy [M]. New York: John Wiley and Sons, 1987: 95-99.
[29] CAO Chu-nan, ZHANG Jian-qing. A preview of electrochemical impedance spectroscopy [M]. Beijing: Science Press, 2004: 3-9. (in Chinese)
[30] SHI Mei-lun. AC impedance spectroscopy principles and applications [M]. Beijing: Nation Defence Industry Press, 2001: 1-3. (in Chinese)
Foundation item: Project(MKPT-04-106) supported by the Project of National Defense of China
Received date: 2009-07-03; Accepted date: 2010-01-15
Corresponding author: TAN Cheng-yu, PhD, Professor; Tel: +86-731-88830270; E-mail: tanchengyu@yahoo.com.cn
(Edited by CHEN Wei-ping)

