Trans. Nonferrous Met. Soc. China 31(2021) 3602-3612
Quick valence analysis method of vanadium toward accurate toxicity assessment of vanadium-containing hazardous wastes
Hong-yiLI, Xin-mian CHEN, Dan-qing LI, Yun GUO, Jiang DIAO, Bing XIE
College of Materials Science and Engineering, Chongqing University, Chongqing 400044, China
Received 24September 2021; accepted 15November 2021
Abstract:
n order to develop a quick, efficient and sensitive valence analysis method of vanadium(V), the high-performance liquid chromatography (HPLC) was utilized to separate and quantify EDTA-complexed V(III), V(IV) and V(V) ions. The influence of EDTA, TBAOH, solution pH and organic modifier on retention behavior of V-EDTA complexes was investigated. Complexed V(III), V(IV) and V(V) ions can be separated and quantified in 5 min, with detection limits of 0.04 mg/L V(III), 0.07 mg/L V(IV), and 0.06 mg/L V(V), respectively. The established method is applied to analyzing the hazardous waste of V-Cr-bearing reducing slag and results demonstrate 49.94% of its V element to be toxic V(V). This work opens a new avenue for quick and accurate toxicity assessment of hazardous wastes containing multivalent heavy metals.
Key words:
vanadium; valence; HPLC-UV; mass spectrometry; EDTA;
1 Introduction
Vanadium (V) is a precious strategic material, which is widely utilized in aerospace, chemical and metallurgical industry [1,2]. V has multiple valence states of +2, +3, +4 and +5, among which V(IV) is utilized to cure diabetes while V(V) is toxic in trace amount [3]. In the world, vanadium titanium magnetite is the major resource of vanadium, from which about 88% of V is extracted [4,5]. During the extraction process of V, the after-vanadate-precipitation wastewater (AVP wastewater) is resulted [5-9]. Due to the inclusion of toxic V(V) and Cr(VI), the AVP wastewater is hazardous and must be detoxified by reducing V(V) and Cr(VI) to V(IV) and Cr(III) respectively, which are thus enriched in the V-Cr-bearing reducing slag (VCBRS) [10]. The resulted waste of VCBRS is unusable and has to be piled up. During pile, V(IV) and Cr(III) contained in the VCBRS can be oxidized to V(V) and Cr(VI), which can pollute the environment surrounding the storage land of VCBRS [11,12]. Therefore, the VCBRS is classified as hazardous waste in China. In order to assess its toxicity more accurately, it is essential to quantify V and Cr elements in each valence [13,14]. For Cr element, our group has previously proposed a valence analysis method which is robust enough in complex solution containing high concentration of V [7]. In contrast, the accurate and sensitive valence analysis method of V is urgently needed, especially considering the low content of V in the VCBRS.
All present determination methods of V focus on the content determination, which overlooks the distinguishing between different V atoms in different valences [15]. In waste discharge standard, the most common determination method for V is inductive coupled plasma-atomic emissionspectrometry (ICP-AES) or atomic absorption spectrometry (AAS), which is sensitive enough to monitor V in mg/L level [16]. But during the atomization process, all V atoms are gasified and atomized, no matter what their previous valences are. Since V atoms in different valences produce the same signal, ICP-AES and AAS are incapable of accurate determination of V in different valences. Other V determination methods of the chemical titration and UV-Vis spectrometry specially target at V(V) only. The chemical titration method is based on the redox reaction between V(V) and ammonium ferrous sulfate while the UV-Vis spectrometry method relies on the UV absorption of the complex between V(V) and N-benzoyl-N-phenylhydroxylamine. These two methods can only determine the concentration of V(V) and can thus be indirectly able to analyze the V(V) content and total content of V(II), V(III) and V(IV) by oxidizing all V atoms into V(V) and subsequent distraction of original V(V) content. The chemical titration method is applicable only in content range of 1% above and also time-consuming while the UV-Vis spectrometry method is effective in narrow range of 0.018-10.0 mg/L [17,18], both of which can only distinguish V(V) and non-V(V) in the sample and are easily interfered by impurity ions such as Ti4+, leading to the insensitivity and incapability for valence analysis of V. Therefore, it is urgently needed to establish a sensitive and robust method of V valence analysis; especially, the quantitative determination of V ions in different valences is essential.
The method of high-performance liquid chromatography (HPLC) has high separation efficiency of various metal ions including those in different valences, which provides an efficient way to quantitatively determine metal ions in different valences for valence or speciation analysis [19-24]. In this work, HPLC with UV detection (HPLC-UV) is utilized to establish the valence analysis method for V. The ligand of ethylene diamine tetraaceticacid (EDTA) is used as the chromophore to generate UV signals for V ions in different valences. After optimization of HPLC separation conditions, the complexes of V ions in different valences and EDTA can be efficiently separated by HPLC and detected by UV detector. According to the areas of separated chromatographic peaks of V(III)-EDTA, V(IV)-EDTA and V(V)-EDTA, the concentrations of V ions in different valences are quantitatively determined, leading to the efficient valence analysis of V. In optimal condition, the established valence analysis method is applied to quantifying the contents of V in each valence, in order to accurately assess its potential toxicity. This work provides an efficient and sensitive method for V valence analysis, which significantly progresses the accuracy in assessing waste toxicity and the preciseness in waste management.
2 Experimental
2.1 Materials
The V-Cr reducing slag was obtained from Pan-steel China, which has been piled up for more than one year. Its leachate was obtained by dissolving it in H2SO4 solution in glovebox with N2 atmosphere to inhibit oxidization of V(III) or V(IV) during dissolution. The ethylenediaminetetraacetic acid (EDTA), tetrabutylammonium hydroxide (TBAOH) and sodium phosphates were purchased from Aladdin. The phosphate buffer (pH 6) was prepared by dissolving 2.10 g NaH2PO4 and 0.35 g Na2HPO4into 100 mL water. All chemicals used were analytical-reagent grade and all solutions were filtered through a 0.22 μm PVDF membrane filter and degassed ultrasonically. Water with resistivity of 18.2 MΩ/cm was obtained directly from a Milli-Q Plus 185 apparatus (Millipore Corp., USA). The solution pH is adjusted by 1 mol/L NH4OH and 1 mol/L HNO3. Fresh working standard solutions of V-EDTA were daily prepared from the corresponding stock solutions. All stock solutions were stable for one month.
Stock solutions of V(III)-EDTA (1 g/L V element) were prepared by the following steps: 0.86 g EDTA was dissolved in 100 mL water under alkaline conditions, which was adjusted to pH 6. Then, 0.31 g VCl3 was accurately weighed in a dark glove box and added to the EDTA solution. The reaction lasted for 30 min under the condition of oxygen isolation and nitrogen continuous infusion. Nitrogen was injected to expel air and seal this stock solution.
Stock solutions of V(IV)-EDTA (1 g/L V element) were prepared as follows: 0.32 g VOSO4 was dissolved in 50 mL ultra-pure water. After full dissolution, 0.86 g EDTA in EDTA/V molar ratio of 1.5:1 was added with water bath heating at 40 °C and electromagnetically stirring for 30 min. The obtained solution was filled to a 100 mL volumetric bottle and adjusted to pH 6.
Stock solutions of V(V)-EDTA (1 g/L V element) were prepared as follows: 0.23 g NH4VO3 was dissolved in 2 mL HNO3 and 48 mL ultra-pure water. The mixing with EDTA, dilution and pH adjustment were the same as described for V(IV)-EDTA stock solution.
2.2 Characterization of V-EDTA complexes by ESI-MS
The V(III)-EDTA, V(IV)-EDTA and V(V)-EDTA complexes were analyzed by electrospray ionization-mass spectrometry (ESI-MS, MS-8060, Shimadzu, Japan) in negative-ion mode: curtain gas of atomized gas (flow rate of 3 L/min), dry gas flow rate of 10 L/min, interface voltage of -3 kV, detector voltage of 2.2 kV, the interface and heating block temperatures of 300 and 400 °С respectively. The pure V-EDTA sample contains 2.5 μmol/LV(III) or V(IV) or V(V). The 1:1 mixture of V-EDTA sample contains 2.5 μmol/L V ions in two valences, in which the V element is totally 5 μmol/L and EDTA is totally 7.5 μmol/L. Sample was injected in volume of 1 μL by the SIL-20AC/30AC auto sampler.
2.3 Characterization of V-EDTA complexes by UV-Vis
The stock solutions of V(III)-EDTA, V(IV)-EDTA and V(V)-EDTA were diluted to 20 mmol/L as samples for UV detection. The UV-Vis spectrophotometer (UV-3600, Shimadzu, Japan) was used to characterize the UV absorption behavior of V(III)-EDTA, V(IV)-EDTA, and V(V)-EDTA complexes in wavelength range of 190-400 nm with scanning rate of 4800 nm/min and slit width of 1 nm. Absorbance determination was conducted in triplicate.
2.4 Separation of V-EDTA complexes by HPLC-UV
The V-EDTA complexes were separated by HPLC in LC-20AT apparatus with a SIL-20A PDAD detector (Shimazu, Japan). An inert sustain AQ-C18 column ( i.d.4.6 mm × 150 mm,particle size 5 um, Shimadzu, Japan) was used for separation. The stock solutions of V(III)-EDTA, V(IV)-EDTA and V(V)-EDTA were respectively diluted to the vanadium concentrations of 1, 5, 10, 20, 50, 75 and 100 mg/L as samples for HPLC injector. The injection quantity is 10 μL. The separation was conducted with a flow rate of 1.2 mL/min,isocratic elution and column temperature of 30 °С. For application in leachate of VCBRS, the standard curve is obtained by the external standard method while the standard recovery experiment is conducted to confirm the accuracy.
3 Results and discussion
3.1 Characterization of V-EDTA complexes by ESI-MS
The standard solutions of V(III)-EDTA, V(IV)-EDTA and V(V)-EDTA complexes were respectively analyzed by ESI-MS to determine their complexation ratios and the existence forms in aqueous solution. In order to test the coexistence of V(III)-EDTA, V(IV)-EDTA and V(V)-EDTA complexes in aqueous solution, these three V-EDTA complexes were mixed in a molar ratio of 1:1 in pairs and analyzed by ESI-MS with 30 mmol/L CH3COONH4 in carrier.
3.1.1 Complexation ratios
Figure 1(a) shows the two strongest signals at m/z values of 338.95 and 356.90. The signal at m/z value of 338.95 is caused by the [V(EDTA)]- complex. The EDTA molecule loses four carboxylic acid protons to form [EDTA]4- and then complexes with V3+ in a ratio of 1:1, resulting in the production of [V(EDTA)]- complex. In addition, the signal at m/z value of 356.90 is attributed to the [V(EDTA)(H2O)]-complex, which is leaded by the complexation between V3+ cation and [EDTA]4-anion and H2O molecule in a ratio of 1:1:1. The [V(EDTA)(H2O)]-complex is actually the hydrate of [V(EDTA)]-. Therefore, the V(III)-EDTA complex mainly exists as [V(EDTA)]-in aqueous solution. According to our previous study, the major existence form of V(IV)-EDTA complex is [VO(EDTA)]2-, and the major existence form of V(V)-EDTA complex is [VO2(EDTA)]3-[25].
3.1.2 Coexistence stability of complexes
The coexistence stability of V-EDTA complexes was investigated by ESI-MS. The mixture of V(III)-EDTA and V(IV)-EDTA complexes (1:1) was first analyzed. As shown in Fig. 1(b), strong [V(EDTA)]- signal at m/zvalue of 339.15 and strong [VO(EDTA)]2- signal at m/zvalue of 177.60 appear simultaneously, which is accompanied by the [V(EDTA)H2O]- and [VO(EDTA)H]-signals at m/z values of 357.20 and 356.10, respectively. These phenomena verify the stable coexistence of V(III)-EDTA and V(IV)-EDTA complexes, which makes it possible to separate them by subsequent chromatographic separation. Additionally, the signals at m/z of 164.10 and 291.24 are resulted by the combination between free EDTA anions and NH4+/H+ cations.
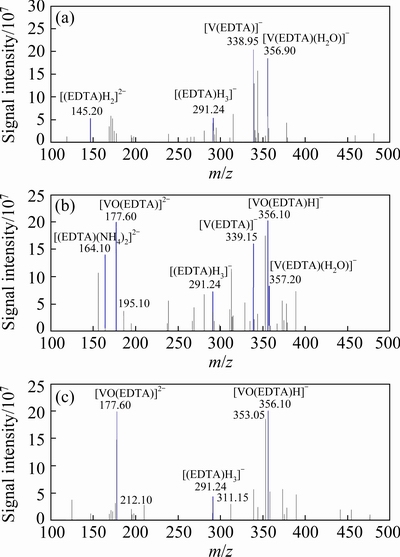
Fig. 1 ESI-MS spectra of V(III)-EDTA(a), V(III)-EDTA and V(IV)-EDTA(b), and V(III)-EDTA and V(V)-EDTA(c)
The mixture of V(IV)-EDTA and V(V)-EDTA complexes (1:1) was analyzed in our previous study, the result shows that EDTA can be a good ligand to complex vanadium even though vanadium coexists in the form of tetravalent and pentavalent states and the corresponding complexes of [VO(EDTA)]2- and [VO2(EDTA)]3- can coexist stably[25].
The mixture of V(III)-EDTA and V(V)-EDTA complexes is lastly analyzed in a molar ratio of 1:1. According to Fig. 1(c), only signals at m/z values of 177.60 and 356.10 can be observed, which are attributed to [VO(EDTA)]2- and [VO(EDTA)H]- complexes, respectively. Both of these two complexes are produced by complexation between VO2+ cation of V(IV) and EDTA4- anion. It thus demonstrates that V(III) and V(V) cations react with each other to produce V(IV) cations via Eq.(1), even if EDTA ligand exists in the system.
V3++VO2+=2VO2+ (1)
This is due to the fact that V(III) is reductive and less stable while V(IV) is strongly oxidative. These results suggest that V(III)-EDTA and V(V)-EDTA cannot coexist. It is thus not necessary to investigate the chromatographic separation between V(III)-EDTA and V(V)-EDTA complexes in the following.
3.2 UV absorbance behaviors of V-EDTA complexes
The UV spectrograms of EDTA, V(III)-EDTA, V(IV)-EDTA and V(V)-EDTA standard solutions in wavelength range of 200-600 nm are shown in Fig. 2. The EDTA sample exhibits a maximal absorption peak at wavelength of 210 nm and its absorption band locates in range of 200-250 nm. In comparison, the characteristic UV absorption peaks of V-EDTA complexes are all at 261 nm. These results demonstrate that the absorption peaks of EDTA and V-EDTA complexes are differentiable by different absorption wavelengths and free EDTA cannot interfere the detection of V-EDTA complexes at wavelength of 261 nm.
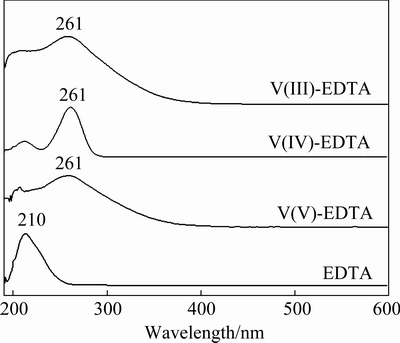
Fig. 2 UV absorption spectrograms of EDTA, V(III)-EDTA, V(IV)-EDTA and V(V)-EDTA complexes
3.3 Separation of V-EDTA complexes by HPLC-UV
Since V(III)-EDTA and V(IV)-EDTA complexes, V(IV)-EDTA and V(V)-EDTA complexes can coexist stably while the free EDTA cannot interfere the UV absorption signals of V-EDTA complexes, the powerful separation technique of HPLC is introduced to separate V-EDTA complexes in multiple valence states via coupling with UV detection. The separation conditions, including EDTA, ion-pairing agent and organic modifier concentrations in mobile phase and buffer composition, are optimized in detail.
3.3.1 EDTA in mobile phase
EDTA is not only a complexing agent of vanadium, but also an additive in mobile phase. On the one hand, an appropriate amount of EDTA in the mobile phase is conducive to stabilizing V-EDTA complexes, which can keep the peak shape of V-EDTA complexes sharp and the separation efficiency improved. On the other hand, the ionic strength of mobile phase increases with increasing EDTA concentration, which makes the replacement of solute ions in the stationary phase more efficient, leading to the elution time being shorter. Thus, the purpose of rapid analysis and reducing the amount of organic modifier can be realized.
The influence of EDTA content in the mobile phase on chromatographic separation is investigated with all other components kept the same. Figure 3 shows that when there is no EDTA in the mobile phase, the retention time of V(IV)-EDTA is 12.8 min, and the retention time of V(V)-EDTA is longer than 20 min, which is too long for rapid analysis. When EDTA concentration is 1 mmol/L in the mobile phase, the analysis can be completed within 12 min. When EDTA is added to 2 mmol/L, the analysis is completed in 7 min. When EDTA addition is 4 mmol/L, the analysis time was further reduced to less than 5 min. It can be seen that the separation time of V(IV)-EDTA and V(V)-EDTA complexes is significantly shortened as the concentration of EDTA increases in mobile phase; meanwhile, the peak shape becomes sharper and the peak height increases. As EDTA concentration continues to increase higher than 4 mmol/L, these two peaks overlap, which influences the separation negatively. Therefore, the EDTA concentration in the mobile phase is optimized to be 4 mmol/L.
3.3.2 TBAOH in mobile phase
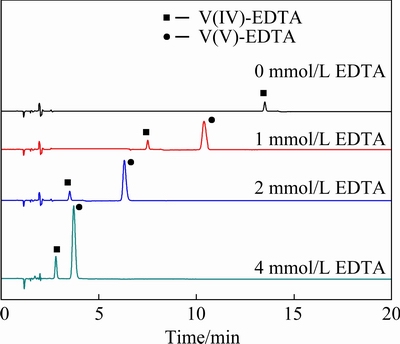
Fig. 3 Influence of EDTA concentration in mobile phase on separation of V(IV)-EDTA and V(V)-EDTA complexes
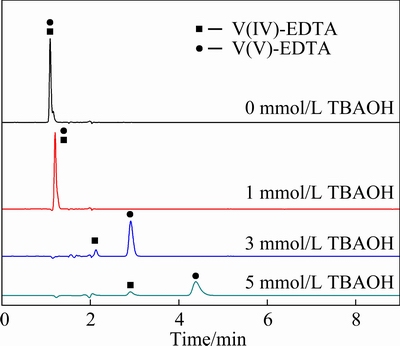
Fig. 4 Influence of TBAOH concentration on separation ofV(IV)-EDTA and V(V)-EDTA complexes
The influence of ion-pairagent TBAOH on the HPLC separation of V(IV)-EDTA and V(V)-EDTA is investigated. Figure 4 shows that when there is no TBAOH in the mobile phase, V(IV)-EDTA and V(V)-EDTA complexes are eluted simultaneously at 1.1 min. When 1 mmol/L TBAOH is added into the mobile phase, the peaks of V(IV)-EDTA and V(V)-EDTA complexes still overlap with each other and could not be separated. When 3 mmol/L TBAOH is added, these two peaks are completely separated, and the peak of V(IV)-EDTA complex appears before that of V(V)-EDTA complex. In this mobile phase, TBAOH exists as TBA+ cations which can form electroneutral ion-pairs with [VO(EDTA)]2- and [VO2(EDTA)]3- anions. The generated ion-pairs decrease the polarity of V-EDTA complexes, which can be retained on the non-polar hydrophobic stationary phase in the chromatographic column. Due to more butyl groups in TBA3[VO2(EDTA)] than TBA2[VO(EDTA)], the ion-pair of TBA3[VO2(EDTA)] has stronger interaction with the stationary phase, leading to the longer retention time of V(V)-EDTA on the stationary phase. When the TBAOH molecules are sufficient to pair all the [VO(EDTA)]2- and [VO2(EDTA)]3- anions, the retention time of V(IV)-EDTA and V(V)-EDTA complexes are significantly differentiated, which leads to the complete separation between V(IV)-EDTA and V(V)-EDTA complexes as the TBAOH concentration increases from 0 to 3 mmol/L in the mobile phase.
Later, with the concentration of TBAOH increasing to 5 mmol/L, the difference in elution time of the two peaks is further increased, but the analysis time has been prolonged. Moreover, with the increase of TBAOH concentration, the peak widths have been broadened, which will decrease the detection sensitivity and accuracy. Moreover, the combination of ion-pairs and stationary phase is an irreversible adsorption reaction, which will decrease the active sites on the stationary phase and shorten the service life of the chromatography column. Therefore, the TBAOH concentration in the mobile phase is optimized to be 3 mmol/L.
3.3.3 Buffer composition
At different solution pH values, V(III), V(IV) and V(V) exist in different ionic forms, so the pH value of the mobile phase will influence the existence form of V in different valence states. When the solution pH is lower than 5, V(V) will protonate. When the pH>7, V(IV) is easily oxidized to V(V). Therefore, the solution is adjusted to pH 6 for the preparation of V(IV)-EDTA and V(V)-EDTA complexes. In order to ensure the stability of V-EDTA complexes in the mobile phase, the pH value of the mobile phase is also determined to be 6. According to our previous study, at pH 6, the complex stability constant of V(IV)-EDTA is lg KV(IV)-EDTA=7.05 while that of V(V)-EDTA is lg KV(V)-EDTA=5.79, which indicates the higher stability of V(IV)-EDTA than V(V)-EDTA complexes and thus their stable separation possibility by HPLC [25].
In order to keep the pH value of mobile phase being stable at 6, the buffer solution of Na2HPO4-NaH2PO4 is utilized as the aqueous phase in the mobile phase, since it has a buffering range of pH 5.8-8.0. The phosphate concentration in buffer has been investigated. When the buffer concentration is 10 mmol/L, the retention time of V-EDTA is longer than 30 min. As the phosphate concentration increases to 20 mmol/L, V(IV)-EDTA and V(V)-EDTA complexes can be separated completely in 5 min. This is due to the fact that the addition of phosphate buffer increases the ionic strength in the mobile phase. The added ions can replace the V-EDTA complex ions on the stationary phase, which facilitates the elution of V-EDTA complexes from the stationary phase, leading to the reduction in retention time of V-EDTA complexes. Thus, appropriate ionic strength can speed up the valence analysis of V. But excessive concentration of phosphates causes an increase in column pressure, which increases the blockage risk of the chromatographic column and thus decreases the column efficiency. In order to use the lowest concentration ensuring the separation efficiency of V(IV)-EDTA and V(V)-EDTA complexes, the concentration of phosphate is selected as 20 mmol/L in the mobile phase.
3.3.4 Organic modifier in mobile phase
In this section, the effects of two organic modifier on the separation efficiency are investigated, namely acetonitrile and methanol. Results show that V(IV)-EDTA and V(V)-EDTA complexes cannot be separated efficiently by methanol (data not shown). Acetonitrile is selected as the organic modifier in the mobile phase and its influence on the separation efficiency has been investigated in concentration range of 2%-20%.
As shown inFig. 5, V(IV)-EDTA and V(V)-EDTA have relatively long retention time on the column when the concentration of acetonitrile is 2%, and then the retention timeof the two complexes becomes shorter with the increase in the proportion of acetonitrile. When acetonitrile concentration is 12%, the two complexes can be completely separated in 5 min. When the acetonitrileconcentration is 20%, the two complexes can be completely separated in 3 min, but the peak of V(IV)-EDTA is adjacent with the solvent peaks. If the acetonitrile concentration continues to increase, the peaks of V(IV)-EDTA and V(V)-EDTA will overlap gradually and co-elute, losing their resolution. Although the increase of acetonitrile can shorten the analysis time and make the chromato- graphic peaks of V-EDTA complexes sharper, the hydrophobicity of the mobile phase increases correspondingly, which helps to elute the retained V-EDTA complexes from the stationary phase more and more quickly, resulting in the smaller difference between retention time of V(IV)-EDTA and V(V)-EDTA complexes. To ensure the complete separation and accurate determination, the acetonitrile concentration of 12% is chosen.
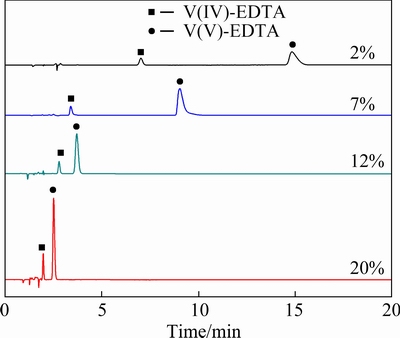
Fig. 5 Influence of organic modifier on separation of V(IV)-EDTA and V(V)-EDTA complexes
3.3.5 Separation and stability of V(III)-EDTA complex
The separation of V(III)-EDTA and V(IV)-EDTA complexes is firstly investigated. The mixture of V(III)-EDTA and V(IV)-EDTA standard solutions, with both concentration of V(III) and V(IV) being 20 mg/L, is analyzed in the optimal HPLC conditions. According to the chromatogram corresponding to pH 6 in Fig. 6, the V(III)-EDTA and V(IV)-EDTA complexes can also be efficiently separated in this condition. The chromatographic peak of V(III)-EDTA complex appears prior to the V(IV)-EDTA complexes, both peaks of which appear in the initial 3 min. This is due to the less butyl groups in TBA[V(EDTA)] ion-pair than in TBA2[VO(EDTA)], which leads to the weaker affinity between TBA[V(EDTA)] and the stationary phase in chromatographic column, resulting in the shorter retention time of V(III)-EDTA complex in the chromatogram. This result indicates that the separation time for V(III)-EDTA and V(IV)-EDTA complexes is even shorter than that for V(IV)-EDTA and V(V)-EDTA complexes, demonstrating the rapid analysis speed of proposed valence analysis method.
Furthermore, considering the less stability of V(III) in aqueous than V(IV) and V(V), in order to maintain the valence distribution of V during valence analysis, the stability dependence of V(III)-EDTA complexes on sample pH is investigated by the proposed HPLC separation method. With the same concentration of V(III)-EDTA and V(IV)-EDTA complexes in samples, the initial pH of sample solution prior to EDTA addition varies in range of pH 2-9. As shown in Fig. 6, when the pH value varies between 2 and 6, the peak areas of V(III)-EDTA and V(IV)-EDTA complexes remain unchanged. But as the pH value becomes higher, the peak area of V(III)-EDTA gradually decreases while that of V(IV)-EDTA gradually increases. This change trend continues in the whole range of pH 6-9, indicating the transformation of V(III)-EDTA complex into V(IV)-EDTA complex. In the complete chromatograph, there is no peak of V(V)-EDTA complex, demonstrating that the V(III)-EDTA complex cannot transform into V(V)-EDTA complex. These results show that V(III)-EDTA complex is stable in range of pH 2-6 and will be oxidized to V(IV)-EDTA complex in more alkaline solution.
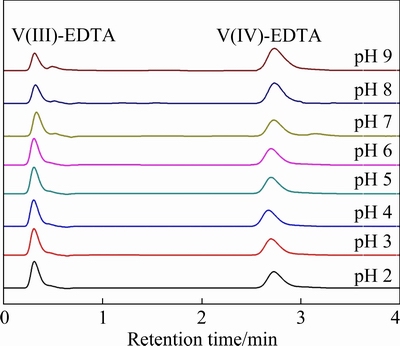
Fig. 6 Chromatograms of V(III)-EDTA and V(IV)-EDTA complexes mixture with V(III) and V(IV) each of 20 mg/L at different initial pH
In order to confirm the transformation inability of V(III)-EDTA complex to V(V)-EDTA complex and exclude the undetectability of trace V(V)-EDTA complex produced, the mixture of V(III)-EDTA and V(V)-EDTA standard solutions with V(III) and V(V) 20 mg/L each has been analyzed in the same HPLC condition. Interestingly, as shown in Fig. 7, only the chromatographic peak of V(IV)-EDTA complex appears at around 2.8 min in the chromatogram of this sample. This result proves that the V(III)-EDTA complex reacts with V(V)-EDTA complex to produce the V(IV)-EDTA complex, which means that the V(III)-EDTA complex cannot coexist with V(V)-EDTA complex. Therefore, during vanadium valence analysis, only V(III)-EDTA and V(IV)-EDTA complexes or V(IV)-EDTA and V(V)-EDTA complexes can coexist. Nevertheless, the optimized HPLC condition can separate all the possible valence states in one injection when analyzing the valence distribution of vanadium in a sample.
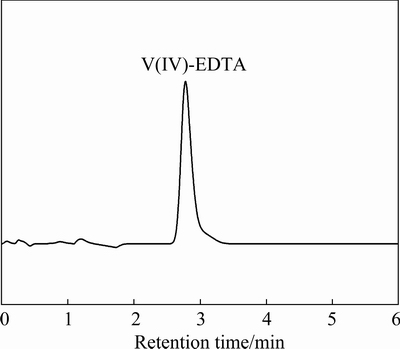
Fig.7 Chromatogram of V(III)-EDTA and V(V)-EDTA complexes mixture with V(III) and V(V) eachof 20 mg/L
3.4 Quantification of various V-EDTA complexes
According to the peak area of each V-EDTA complex in the chromatogram, the contents of V(III), V(IV) and V(V) in a sample can be quantitatively determined. The standard curve (concentration-peak area curve) for each valence state is established by the internal standard method. The standard solutions of three V-EDTA complexes with concentrations of 1, 5, 10, 20, 50, 75 and 100 mg/L are respectively analyzed in the optimal HPLC condition to obtain the peak area corresponding to each concentration. The obtained regression equations and their correlation coefficients are summarized in Table 1, with which the concentrations of vanadium in different valences can be quantified. Therefore, the valence analysis of vanadium can be realized by the HPLC-based valence analysis method of vanadium.
The limit of detection (LOD) for vanadium in each valence state is determined with the signal-to-noise ratio of 3 (S/N=3) while the limit of quantification (LOQ) is determined with S/N=10.
The LODs are at level of several tens of micrograms per liter, which indicates the sensitivity of this HPLC determination method. The highest LOQ among those of each valence state is as low as 0.23 mg/L, which demonstrates the sensitivity of the proposed valence analysis method. In contrast, the present vanadium valence determination method is indirect chemical titration for V(V) only, which has the LOD and LOQ at the 10 mg/L level.
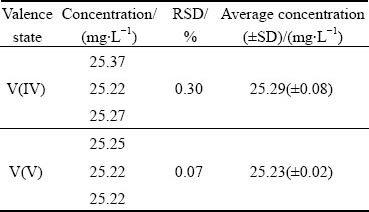
In order to investigate the analysis reproducibility, the standard solution of each V-EDTA complex is diluted to 20 mg/L and analyzed five times. The relative standard deviation (RSD) for the chromatographic peak area of V(III) is only 1.83% while the RSD values for V(IV) and V(V) are 1.08% and 1.42% respectively. Results verify the high reproducibility of the proposed HPLC-based valence analysis method.
3.5 Valence analysis of vanadium in V-Cr-bearing reducing slag
The VCBRS is dissolved in H2SO4 solution in N2 atmosphere to inhibit the valence transformation of vanadium. The obtained leachate is added with EDTA in 1.5 times of estimated total moles of V, Cr, Ca, Mg and Mn according to our previous work, although Ca, Mg and Mn are in trace amount [11]. After adjusting the solution to pH 6, the sample solution is diluted 50 times and injected into the chromatographic column for valence analysis of vanadium by the established HPLC-based method. The obtained chromatogram is shown in Fig. 8. Unexpectedly, the peak of V(V)-EDTA complex appears after the peak of V(IV)-EDTA, which indicates the coexistence of V(IV) and V(V) in the VCBRS. The appearance of V(V)-EDTA complex excludes the existence of V(III) species. According to the calibration curves established in Section 3.4, V(IV) and V(V) concentrations in the 50 times-diluted leachate are calculated and the determination results are summarized in Table 2.Results show that about 49.94% of vanadium exists in valence state of V(V) while 50.06% of vanadium exists as V(IV) in the VCBRS. Theoretically, all vanadium atoms in the VCBRS are in valence of +4; however, the analyzed VCBRS has been piled up for more than one year. Analysis results show that almost half of V(IV) has been oxidized to V(V) during the storage, which demonstrates quantitatively the toxicity of the VCBRS.
Table 1 Calibration curve equation, LOD and LOQ of each valence state of V
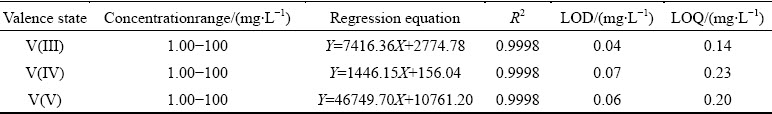
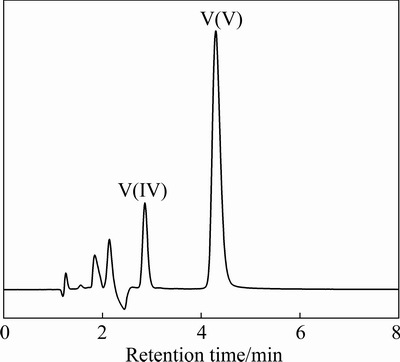
Fig. 8 Chromatogram of 50 times-diluted leachate of V-Cr-bearing reducing slag
Table 2 Vanadium valence analysis results of 50 times-diluted leachate of V-Cr-bearing reducing slag
In order to verify the reliability of the determined results, the total concentration of vanadium in original leachate of the VCBRS is calculated and compared with the ICP-AES determination result. As shown in Table 3, the total vanadium concentration is determined to be 2526.00 mg/L by HPLC while that determined by ICP-AES is 2464.50 mg/L. The RSDvalue between the total concentrations determined by these two methods is only 2.50%, which falls in the common deviation range for instrumental analysis methods. These results demonstrate the reliability of the established valence analysis method based on HPLC.
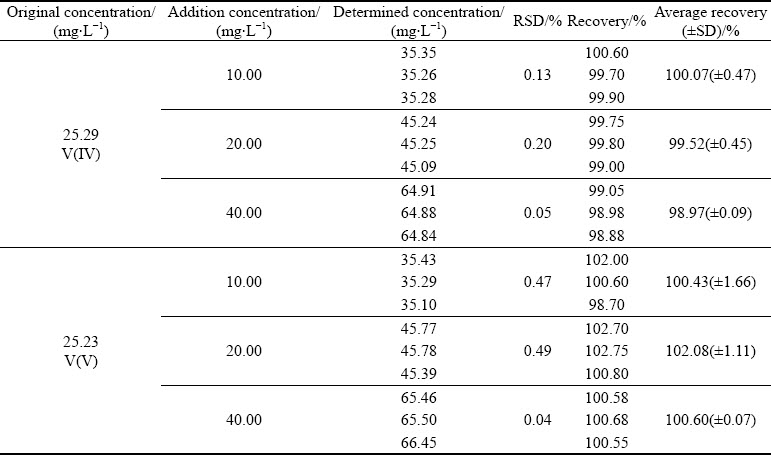
Furthermore, to exclude the interference of co-existing Cr, Mg, Ca and Mn ions, the robustness of the established valence analysis method of vanadium has been investigated by standard addition recovery experiments. 10, 20 and 40 mg/L V(IV) and V(V) each in standard solutions are added into the 50-times diluted leachate of VCBRS. The mixtures are analyzed by the established valence analysis method of vanadium. As shown in Table 4, when about 0.5-1.5 times of original concentration of V(IV) and V(V) are added respectively, the obtained recovery varies between 98.97% and 102.08%, all of which are close to theoretical value of 100%. These results indicate that the co-existing impurity ions and the complex matrix in the leachate cannot interfere the quantification of vanadium in each valence state, demonstrating the viability and robustness of the established valence analysis method for vanadium.
4 Conclusions
(1) We verify the stable existence of V(III)-EDTA, V(IV)-EDTA and V(V)-EDTA in solution by ESI-MS and find that their existence forms are [V(EDTA)]-, [VO(EDTA)]2- and [VO2(EDTA)]3-, respectively. Only V(III)-EDTA and V(IV)-EDTA complexes or V(IV)-EDTA and V(V)-EDTA complexes can coexist stably in aqueous solution.
(2) For their efficient separation and valence analysis, the HPLC analysis method is established with UV detection at 261 nm and with the optimal mobile phase composed of 4 mmol/L EDTA, 5 mmol/L TBAOH, 20 mmol/L phosphate buffer (pH 6) and 12% acetonitrile.
(3) The established HPLC-based valenceanalysis method is applied in the acidic leachate of VCBRS. Results show that 49.94% of V(IV) has been oxidized to V(V) during storage of VCBRS, which demonstrates quantitatively the toxicity of hazardous VCBRS.
(4) This work has solved the problems of quantification, accuracy and quickness of vanadium valence analysis in the vanadium industry, which opens a new avenue for accuracy promotion in toxicity assessment of hazardous wastes containing multivalent heavy metals.
Table 3 Comparison of total vanadium concentrations determined by HPLC and ICP-AES
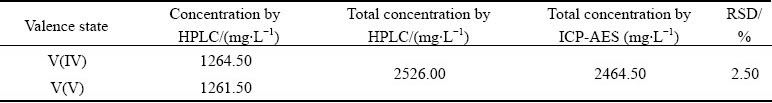
Table 4 Recovery experiment results of 50-times diluted leachate of V-Cr-bearing reducing slag
Acknowledgments
We acknowledge the National Key Research and Development Program of China (No. 2020YFC1909701), the National Natural Science Foundation of China (No. 52074050), andChongqing Science and Technology Bureau (Nos. cstc2019jcyjjqX0006, cstc2021ycjh-bgzxm0075).We appreciate Mr. Guo-can ZHENG in the analytical and testing center of Chongqing University for his kind help in MS characterization.
References
[1] MA Zhi-yuan, LIU Yong, ZHOU Ji-kui, LIU Mu-dan, LIU Zhen-zhen. Recovery of vanadium and molybdenum from spent petrochemical catalyst by microwave-assisted leaching [J]. International Journal of Minerals, Metallurgy and Materials, 2019, 26(1): 33-40.
[2] MOSKALYK R R, ALFANTAZI A M. Processing of vanadium: A review [J]. Minerals Engineering, 2003, 16(9): 793-805.
[3] WEN Jia-wei, NING Peng-ge, CAO Hong-bin, ZHAO He, SUN Zhi, ZHANG Yi. Novel method for characterization of aqueous vanadium species: A perspective for the transition metal chemical speciation studies [J]. Journal of Hazardous Materials, 2019, 364: 91-99.
[4] CHEN Jun-wei, JIAO Yang, WANG Xi-dong. Thermodynamic studies on gas-based reduction of vanadium titano-magnetite pellets [J]. International Journal of Minerals, Metallurgy and Materials, 2019, 26(7): 822-830.
[5] LI Hong-yi, FANG Hai-xing, WANG Kang, ZHOU Wang, YANG Zhao, YAN Xiao-Man, GE Wen-Sun, LI Qian-Wen, XIE Bing. Asynchronous extraction of vanadium and chromium from vanadium slag by stepwise sodium roasting–water leaching [J]. Hydrometallurgy, 2015, 156: 124-135.
[6] GUO Yun, LI Hong-yi, YUAN Yi-heng, HUANG Jie, DIAO Jiang, XIE Bing. Microemulsion extraction: An efficient way for simultaneous detoxification and resource recovery of hazardous wastewater containing V(V) and Cr(VI) [J]. Journal of Hazardous Materials, 2020, 386: 121948.
[7] LI Hong-yi, LI Dong, GUO Yun, YANG Yang, WEI Wei-li, XIE Bing. On-site chemosensing and quantification of Cr(VI) in industrial wastewater using one-step synthesized fluorescent carbon quantum dots [J]. Sensors and Actuators B: Chemical, 2018, 277: 30-38.
[8] WANG Xue-wen, YANG Ming-e, MENG Yu-qi, GAO Da-xiong, WANG Ming-yu, FU Zi-bi. Cyclic metallurgical process for extracting V and Cr from vanadium slag: Part I. Separation and recovery of V from chromium-containing vanadate solution [J]. Transactions of Nonferrous Metals Society of China, 2021, 31(3): 807-816.
[9] PENG Xue-feng, ZHANG Yang, FAN Bing-qiang, ZHENG Shi-li, WANG Xiao-jian, ZHANG Ying, LI Ping, LIU Feng-qiang. Complexation separation for vanadium and chromium by dithiocarbamate and its application in treatment of chromium–vanadium-bearing slag [J]. Transactions of Nonferrous Metals Society of China, 2019, 29(11): 2400-2410.
[10] CHEN Bian-fang, HUANG Sheng, LIU Biao, GE Qi, XIE Shu-shan, WANG Ming-yu, WANG Xue-wen. Thermodynamic analysis for separation of vanadium and chromium in V(IV)–Cr(III)–H2O system [J]. Transactions of Nonferrous Metals Society of China, 2018, 28(3): 567-573.
[11] GUO Yun, LI Hong-yi, CHENG Jie, SHEN Shuo, DIAO Jiang, XIE Bing. Highly efficient separation and recovery of Si, V, and Cr from V-Cr-bearing reducing slag [J]. Separation and Purification Technology, 2021, 263: 118396.
[12] CHEN Bian-fang, HUANG Sheng, LIU Biao, GE Qi, WANG Ming-yu, WANG Xue-wen. Separation and recovery of vanadium and chromium from acidic leach solution of V-Cr-bearing reducing slag [J]. Journal of Environmental Chemical Engineering, 2017, 5(5): 4702-4706.
[13] KHAN S, KAZI T G, KOLACHI N F, BAIG J A, AFRIDI H I, SHAH A Q, KUMAR S, SHAH F. Hazardous impact and translocation of vanadium (V) species from soil to different vegetables and grasses grown in the vicinity of thermal power plant [J]. Journal of Hazardous Materials, 2011, 190(1-3): 738-743.
[14] YU Ya-qi, LUO Hou-qiao, TANG Wen-ya, YU Chang-ping, LU Li, LI Jiang-wei, YANG Jin-yan. Mechanism of vanadium(IV) resistance of the strains isolated from a vanadium titanomagnetite mining region [J]. Ecotoxicology and Environmental Safety, 2020, 195: 110463.
[15] XIONG Chao-mei, QIN Yong-chao, HU Bin. On-line separation/preconcentration of V(IV)/V(V) in environmental water samples with CTAB-modified alkyl silica microcolumn and their determination by inductively coupled plasma-optical emission spectrometry [J]. Journal of Hazardous Materials, 2010, 178(1-3): 164-170.
[16] GB 26452—2011. Discharge Standard of Pollutants for Vanadium Industry [S]. 2011.
[17] GB/T 15503—1995. Water quality—Determination of vanadium-BPHA extraction spectrophotometric method [S]. 1995.
[20] JINADASA K K, PENA-VAZQUEZ E, BERMEJO-BARRERA P, MOREDA-PINEIRO A. Ionic imprinted polymer—Vortex-assisted dispersive micro-solid phase extraction for inorganic arsenic speciation in rice by HPLC-ICP-MS [J]. Talanta, 2020, 220:121418.
[21] FOULKES M E, SADEE B A, HILL S J. Arsenic speciation and its DNA fractionation in the rice plantOryza sativa [J]. Journal of Analytical Atomic Spectrometry, 2020, 35(9): 1989-2001.
[22] PECHANCOVA R, GALLO J, MILDE D, PLUHACEK T. Ion-exchange HPLC-ICP-MS: A new window to chromium speciation in biological tissues [J]. Talanta, 2020, 218: 121150.
[23] TRINTA V D, PADILHA P D, PETRONILHO S, SANTELLI R E, BRAZ B F, FREIRE A S. SAUNDERS C, da ROCHA H F, SANZ-MEDEL A, FERNANDEZ-SANCHEZ M L. Total metal content and chemical speciation analysis of iron, copper, zinc and iodine in human breast milk using high-performance liquid chromatography separation and inductively coupled plasma mass spectrometry detection [J]. Food Chemistry, 2020, 326: 126978.
[24] KRATA A A, VASSILEVA E. Simultaneous speciation analysis of mercury in marine origin samples by high performance liquid chromatography and species—Specific isotope dilution inductively coupled plasma mass spectrometry [J]. Talanta, 2020, 217: 121113.
[25] LI Hong-yi, LI Dan-qing, YANG Yang, ZHANG Xie, DIAO Jiang, XIE Bing. Re-examination of complexation behaviors of V(v) and V(iv): Experimental investigation and theoretical simulation [J]. Journal of Analytical Atomic Spectrometry, 2020, 35(5): 878-885.
钒的快速价态分析方法及其用于含钒有害废弃物毒性的准确评价
李鸿乂,陈新勉,李丹青,郭赟,刁江,谢兵
重庆大学 材料科学与工程学院,重庆 400044
摘 要:为了开发一种快速、高效、灵敏的钒(V)价态分析方法,利用高效液相色谱(HPLC)分离和定量EDTA络合V(III)、V(IV)和V(V)离子。研究EDTA、TBAOH、溶液pH和有机改性剂对V-EDTA络合物保留行为的影响。络合之后的V(III)、V(IV)和V(V)离子可在5 min内分离和定量,检测限分别为0.04、0.07和0.06 mg/L。将所建立的方法应用于含钒铬还原渣危险废物的分析,结果表明含钒还原渣中49.94%的钒为有毒钒。这项工作为含多价重金属危险废物的快速、准确毒性评估开辟了新途径。
关键词:钒;价态;高效液相色谱-紫外检测法;质谱;乙二胺四乙酸
(Edited by Xiang-qunLI)
Corresponding author:Hong-yi LI, Tel: +86-23-65102469, Fax: +86-23-65127306, E-mail: hongyi.li@cqu.edu.cn
DOI:10.1016/S1003-6326(21)65751-5
1003-6326/  2021 The Nonferrous Metals Society of China. Published by Elsevier Ltd & Science Press
Abstract:In order to develop a quick, efficient and sensitive valence analysis method of vanadium(V), the high-performance liquid chromatography (HPLC) was utilized to separate and quantify EDTA-complexed V(III), V(IV) and V(V) ions. The influence of EDTA, TBAOH, solution pH and organic modifier on retention behavior of V-EDTA complexes was investigated. Complexed V(III), V(IV) and V(V) ions can be separated and quantified in 5 min, with detection limits of 0.04 mg/L V(III), 0.07 mg/L V(IV), and 0.06 mg/L V(V), respectively. The established method is applied to analyzing the hazardous waste of V-Cr-bearing reducing slag and results demonstrate 49.94% of its V element to be toxic V(V). This work opens a new avenue for quick and accurate toxicity assessment of hazardous wastes containing multivalent heavy metals.