Trans. Nonferrous Met. Soc. China 31(2021) 3549-3563
Exponential decay law of acoustic emission and microseismic activities caused by disturbances associated with multilevel loading and mining blast
Shi-da XU, Tian-xiao CHEN, Jia-qi LIU, Chen-rui ZHANG
Key Laboratory of Ministry of Education on Safe Mining of Deep Metal Mines, Northeastern University, Shenyang110819, China
Received 2February 2021; accepted 25 August 2021
Abstract:
o investigate decay law of acoustic emission and microseismic activities caused by disturbances associated with multilevel loading and mining blast, a new exponential decay (ED) law was proposed. The results show that the micro-fracture activity decay law after multistage stress loading and blasting disturbance conforms to the ED model, in whichthe sum of A and n represents the number of initial micro-fracture events, and n represents the level of background micro-fracture events. The ED model can describe the number of initial micro-fracture events with a deviation less than 10%. The ED model outperforms the traditional aftershock models in describing the micro-fracture event decay law in the three cases considered. The ED model can provide a reference for selecting the blasting interval in mines, which is of great significance to maintain the stability of the surrounding rock and ensure safe production in metal mines.
Key words:
exponential decay law; blast disturbance; acoustic emission;microseismic activities; metal mine;
1 Introduction
After an intense earthquake, many earthquakes may occur in the adjacent areas. These low intensity earthquakes are known as aftershocks, and the intense earthquake is termed as the main shock. A series of aftershocks that occur after the main shock are known as an aftershock sequence. After the occurrence of the main earthquake, the aftershocks exhibit a slow and fluctuating decay process as time elapses and eventually mix with the background earthquake. The aftershock duration is defined as the period from the occurrence of the main shock to the time at which the aftershock mixes with the background earthquakes. The aftershock duration and decay speed are critical aspects when conducting disaster rescue and have been focused on by many researchers [1-3].
In as early as 1894, OMORI [3] examined the law of aftershock decay and indicated that the aftershock incidence was inversely proportional to the time after the main shock. UTSU [4] suggested the addition of a parameter p to represent the decay speed of the aftershock sequence after examining the decreasing trend between the natural logarithm of t and the number of earthquakes (Eq. (1)):
N(t)=K·(t+c)-p (1)
whereK is a constant pertaining to the total number of aftershocks. The parameter c represents a time offset, and t represents the time after the main shock.
The MOM model can accurately describe the decay phenomenon of most aftershock sequences. Based on 29 sequences, KISSLINGER [5] presented the stretched exponential law, thereby demonstrating the superiority of the MOM model in most cases. Subsequently, GROSS and KISSILINGER [6] proposed the modified stretched exponential (MSE) model:

 (2)
(2)
whereN*(0) is the potential total number of initial aftershocks after the occurrence of the main shock at the time t=0. The parameter r, a power exponent, ranges from 0 to 1. The parameter d is the delay time.
NARTEAUet al [7] established the limited power law (LPL) model after determining that the aftershock decay rate is equal to the sum of independent exponential decay functions with different characteristic times:
 (3)
(3)
whereγ(q, λat) is the incomplete Gamma function, and B, q,λa and λb are free variables of the model. B is similar to the parameter K in the MOM model, in which it ensures that the integral of the time from the beginning to the end is equal to the total number of aftershocks. The parameter q is the decay index of the power function. Parameter λa can be considered to be the characteristic rate related to the threshold of the crack growth, and λb is a constant pertaining to the domains of the highest overload. Many studies on the attenuation law of after- shocks using one or more models are commonly reported [8-12]. LOLLI and GASPERINI[13] used the MOM model to study the decay law of the 47 aftershock sequences that occurred in California from 1933 to 2004 and in Italy from 1976 to 2004 and discussed the meaning of the parameter c.After comparing the performances of the MOM, MSE and LPL models on the 24 aftershock sequences that occurred in California, it was concluded that the LPL model can fit more aftershock data [14]. It can be seen that there is still no unified understanding of the advantages and disadvantages of different models in describing the attenuation law of aftershocks.
LIANG et al [15] indicated that the AE caused by the microfractures of rock can be considered as small earthquakes with a variable scale. In this context, the AE and microseismic activity induced by a blast can be regarded as the aftershock sequence of the blast. Several researchers observed this phenomenon in their research on mining blasts and AE tests [16-20]. SCHOLZ [21] analyzed the evolution of the number of AE events over time after the rock failure induced in a uniaxial loading test. The results showed that the number of AE events decreased according to the OM model if no extra loading was applied after the main failure. LOCKNER and BYERLEE[22] indicated that the AE sequence obtained from the creep test of an anthracite sample conformed to the MOM model, and the p value decreased as the stress increased. HIRATA[23] demonstrated that the law of the AE sequence decay conformed to the OM model rather than exponential decay model by conducting the study of atime series of acoustic emission in basalt under uniaxial compression with constant stress of 275 MPa. GROSS [24] used the MOM and MSE models to analyze the decay law of 7 blasting aftershock sequences and 4 natural earthquake aftershock sequences and compared the corresponding parameters. The results indicated that the MOM model is more suitable for describing the blasting aftershock sequence, which decays faster than the aftershock sequence of natural earthquakes. GIBOWICZ [25] indicated that the decay law of four mine microseismic event sequences that occurred in the deep horizontal gold deposits in April 1993 conformed to the MOM model. LIet al [26] reported that blasting aftershock was similar to an earthquake aftershock, and its decay law conformed to the MOM model. LEI et al [27] used the MOM model to fit the aftershock sequence induced by water injection at the Rongchang well. The p value ranged from 0.44 to 0.67, smaller than that for most natural earthquakes. MIGNAN [28] conducted the comparison of the power law, pure exponential and stretched exponential and found that the aftershock sequences in Southern and Northern California, and Taiwan follow a stretched exponential instead of a power law. WOODWARD et al [29] proposed a weighted maximum likelihood estimation method to study the mining seismic responses. LIU et al [30] applied the MOM model to analyze the AE and microseismic activity power law attenuation characteristics in the laboratory and in situ and suggested that the parameters of the MOM model must be used in combination to evaluate the rock mass stability. ESTAY et al [31] adopted the MOM model to analyze the decay law of 11 aftershock sequences of rock burst and large magnitude events that occurred in four mines in Canada and indicated that the values of the parameters were influenced by the mining activity and the tectonic geology characteristics. Therefore, the performances of aftershock models are different in describing the aftershock decay law after blasts and rock bursts, and there are disputes between the range of some parameters and their physical meanings.
As reported by GASPERINI and LOLLI [14], none of the current models can fully describe the law of aftershock decay, despite the results achieved by the numerous studies conducted by researchers. Furthermore, there exist certain conflicts regarding the physical significance of the parameters. Therefore, in this work, a new ED model based on theoretical deduction is proposed, which is used to analyze the decay law of the AE and microseismic activities induced by multilevel loading and blasting.
2 Exponential decay model
Based on the reaction particle idea proposed by MATHAI and HAUBOLD [32], SANCHEZ and VEGAJORQUERA [33] established the aftershock decay model, considering that the evolution time of the ith particle depended on the particle density. The model can be expressed as
 (4)
(4)
wherec>0, and Ni(t=0)=-cN0. This model indicates that the decrease rate of the number of particles is proportional to the number of remaining particles as the number of particles decreases. The decreasing rate of the particles decreases gradually as time progresses, which is an inherent characteristic of the model. The number of particles in the model is 0 when the time tends to infinity. However, the microseismic monitoring system may receive a certain amount of seismic signal even if no blasting disturbances or rock bursts occur in the mining activities. This phenomenon indicates that certain background signals, such as those of background earthquakes, exist. Therefore, the number of micro-fracture events approaches the number of background earthquakes when the time tends to infinity. In other words, the micro-fracture events do not decrease as background earthquakes begin to appear. In this context, the micro-fracture event decay rate can be expressed as
 (5)
(5)
wherek is a constant, and k>0. N(t) represents the number of micro-fracture events at time t, and n represents the number of background earthquakes. The decreasing rate of the micro-fracture events is proportional to the difference between the number of micro-fracture events and background micro-fracture events. Moreover, when t tends to infinity, N(t) is equal to n, and dN(t)/d(t) is equal to 0.
Given
y=N(t)-n (6)
Equation (7) holds:
 (7)
(7)
Because n is a constant, Eq. (7) can be expressed as follows:
 (8)
(8)
Equation (5) can be expressed as Eq. (9) based on Eqs. (8) and (6):
 (9)
(9)
Furthermore,
 (10)
(10)
Equation (11) is yielded after integrating both sides of Eq. (10):
ln y=-kt+ln A (11)
whereA is a constant. Subsequently, y can be expressed as
 (12)
(12)
The parameter y can be eliminated using Eqs. (6) and (12):
 (13)
(13)
When t is zero, N0 is equal to the sum of Aandn, which represents the number of initial micro-fracture events. When t is equal to the reciprocal of k, the number of micro-fracture events is always equal to the sum of A/e and n. It can be noted that 1/k is the characteristic point. To make the physical meaning of k easier to understand, Eq. (13) can be expressed as
 (14)
(14)
The characteristic point approaches when t is equal to k. The significance of this characteristic point pertains to the half-life characteristic point of a radioactive element. Therefore, k can reflect the decay speed of a micro-fracture event sequence.
Considering the number of independent variables in the model, adjusted R square is used to evaluate the goodness of fit (see Eqs. (15) and (16). It indicates the correlation between dependent variables and multiple independent variables. Its value would not get closer and closer to 1 as the number of independent variables. The closer the value is to 1, the better the fitting degree is. The values of parameters A, n andk should be determined as the goal to maximize the goodness of fit.
 (15)
(15)
 (16)
(16)
where is predicted value of the model, yi is actual value,
  is the average value,m is the number of samples, and l is the number of independent variables.
3 AE activities during rock fracturing through multilevel uniaxial loading
3.1 Experimental process
The Rockman207 servo loading system, with a loading rate of 50 kN/s and prestress of 1 kN, was applied. Vertical sensors were used to determine the vertical strain of the rock samples. The PCI-2 acoustic emission system produced by the Physical Acoustic Corporation was used to capture the rock failure signals. This system, which adopts the 18 bit A/D conversion technology, and a sampling rate and frequency range of 40 MSPS and 1-3000 kHz, respectively, can collect the real time AE transient waveform and synchronously extract the AE signal characteristics. Eight nano30 sensors with a frequency response range of 125-750 kHz were placed around the samples (see Fig. 1). Each sensor was equipped with a 1220A-AST type preamplifier. Rubber bands were used to fix sensors, and butter was used to ensure coupling between the sensors and samples. In addition, a thin slice of polytetrafluoroethylene was applied to weakening the end effect. The main amplifier of the AE system had a frequency and threshold value of 40 dB and 50 mV, respectively. To improve the accuracy of the arrival time, the sampling frequency and sampling length were set as 2.5 MSPS and 8000 points, respectively. The stress was applied through multilevel uniaxial loading, as shown in Fig. 2. Standard cylindrical rock samples, with a height and diameter of 100 mm and 50 mm, respectively, were used in the test. Basic parameters of rock samples are given in Table 1.
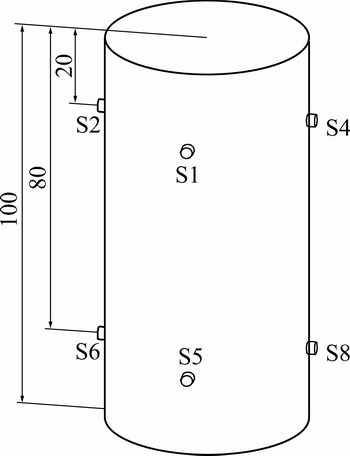
Fig. 1 Sensors’ layout of multilevel uniaxial loading test (Unit: mm)
3.2 AE decay law under different stresses
The AE activity of a specimen selected from those subjected to a series of multilevel uniaxial loading tests is shown in Fig. 2. The AE hit rate is small in the primary loading stage, especially when the stress is less than 81.5 MPa. The AE hit rate is less than 200 min-1 in the first seven loading cycles and it rapidly decreases to an extremely small value. When the stress increases to 81.5 MPa, 50% of the peak stress, the maximum AE hit rate suddenly increases to 1000 min-1. Moreover, this rate gradually reduces to a small value over a large period. The maximum AE hit per loading cycle is similar when the stress ranges from 81.5 to 142.7 MPa, and it varies from 1000 to 2000 min-1. When the stress exceeds 142.7 MPa, the AE hit rate increases to 4000 min-1 suddenly during the loading process. At this moment, the stress is 87% of the peak stress. The decay law of the AE hit rate after the loading disturbance becomes less notable, particularly when the stress exceeds 152.86 MPa. More AE hits than the initial AE hits occur during the AE sequence decay process, which illustrates that the specimen is unstable and close to failure. It can be concluded that a high AE hit rate occurs during the stress loading process and decays gradually. A smaller ratio of the stress to the peak stress corresponds to a faster AE decay. When the stress exceeds 87% of the peak stress, the AE hit rate does not decrease monotonically after the stress loading.
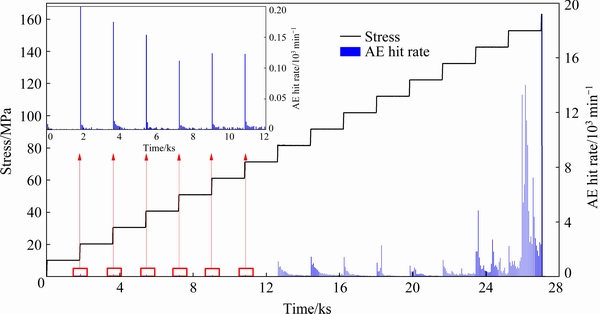
Fig. 2 AE activities in multilevel uniaxial loading test [30]
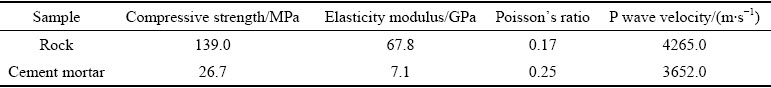
Table 1 Basic parameters of rock samples and cement mortar specimens
To analyze the decay law of the AE activities after the stress loading disturbance, the 2nd, 4th, 6th, 8th, 10th and 13th stress loading cycles were fitted using the ED model, with the corresponding stress of 20.37, 40.75, 61.15, 81.52, 101.9and 132.47 MPa, respectively. The value of the adjusted R square was used to assess the fitting degree of the AE sequence and the ED model. The corresponding value was less than 1. In general, a larger value of the adjusted R square corresponds to a higher fitting degree. The result is shown in Fig. 3.
When the stress is 20.37 MPa, the decay law of the AE sequence after the stress loading disturbance conforms to the ED model, with the maximum value of the adjusted R square being 0.998. The values of A, n and k are 200.87, 1.1 and 18.1, respectively. According to the ED model, the number of initial AE hits is 201.97, close to the actual number of initial AE hits. Moreover, only 18.1 s is required for the value to decrease to the characteristic point of the ED model. When the stress increases to 40.75 MPa, which is 25% of the peak stress, the attenuation law of the AE hit after the stress loading disturbance conforms to the ED model, with the maximum value of the adjusted R square being 0.998. At this stress level, the AE hit decreases to the characteristic point after 22.48 s. The number of initial AE hits calculated according to the ED model is 154, which is equal to the number of actual initial AE hits. When the stress is 61.5 MPa, 37% of the peak stress, the AE hit sequence conforms to the ED model, and the maximum value of the adjusted R square is 0.994. The time to reach the characteristic point is 20.88 s. The numbers of the calculated and actual initial AE hits are all equal to 124. The stress becomes 81.52 MPa after the 8th stress loading, which is 50% of the peak stress. The adjusted R square value is 0.972, indicating that the AE hits decay according to the ED model. However, a notable difference exists between the calculated and actual initial AE hits, with a deviation of approximately 7.82%. The AE hits require 275.4 s to decay to the ED model characteristic point. The deviation is approximately 4.83%, as the AE hits require 111.6 s to decay to the ED model characteristic point in the 10th loading cycle. The value of the adjusted R square (0.814) indicates that the decay law of AE hits conforms to the ED model at the 13th stress level. The number of actual initial AE hits is 1206, and a deviation of only 0.4% is observed. The initial AE hit requires 105 s to decay to the characteristic point.
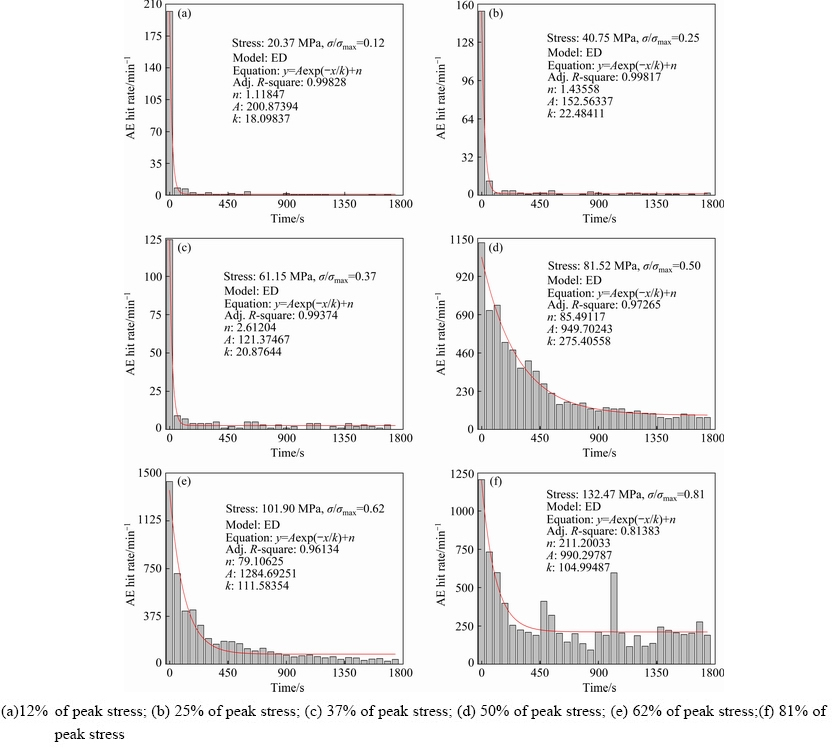
Fig. 3 Law of AE hit rate decay according to ED model at different stress values with multilevel uniaxial loading
After the stress loading disturbance at a low stress level, less time is required for the AE hit to decrease to the characteristic point. The time required to decay to the characteristic point of the ED in the middle loading stage is less than that for the first seven loading cycles. The number of acoustic emission impacts decreases gradually after each loading circle, and the rate of reduction becomes lower and lower. The number of initial AE hits calculated using the ED model is consistent with the number of actual AE hits. So, the decay law of the AE hits with multilevel uniaxial loading conforms to the ED model.
4 AE activities induced by blasting
4.1 Experimental process
A sample made of cement mortar was used, with a uniaxial compressive strength of 30 MPa. The mass ratio of the cement, sand and water was 1:4.1:0.9. Sample size was 300 mm × 300 mm × 250 mm, as shown in Fig. 4. The specimens were processed to meet the requirements of the test after 30 d maintenance. Basic parameters are given in Table 1. The AE monitoring system was the same as that used in the multilevel uniaxial loading test. Sensors with a frequency response of 50-400 kHz were used in the blasting test, as they can suitably capture the signals of the concrete specimens. The blasting hole was located in the middle of the sample, with a depth of 125 mm. In the experiment, the explosive was produced by mixing cyclonite and potassium picric acid in a mass ratio of 1:1. The potassium picric acid helped improve the flame sensitivity of the mixed explosive, enabling easier ignition under the deflagration of the electric ignition head. The cyclonite helped improve thepower and intensity of the explosive. The charge was 1 g for every blast, based on certain testing, as this amount could provide sufficient blasting disturbance without destroying the specimen. Uniaxial loading with a prestress of 1 MPa and stress loading rate of 3 MPa/min was applied. Six blasting disturbances with a certain interval were implemented after the target stress was attained. Finally, the specimen was loaded until failure. Thin slices of polytetrafluoroethylene were placed between the specimen and loading plate to weaken the end effect. The effect of the stress wave reflection on the acoustic emission was negligible under the considered boundary conditions.
In general, the interference of the blasting signals with the AE and microseismic signals cannot be ignored when examining the decay law of the AE and microseismic activities after a blasting disturbance. Some researchers have focused on the classification of blasting and microseismic signals [34,35]. A database of the feature parameters of different types of signals was established to train the neural network model to filter the noise waveform successfully in the blasting disturbance tests and microseismic activity monitoring [36].
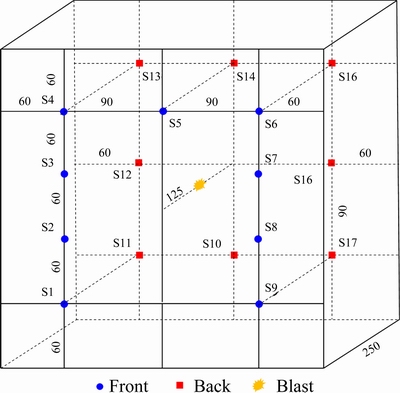
Fig. 4 Layout of AE sensors in blasting disturbance test (Unit: mm)
4.2 AE decay law after blasting
The AE activity during the experimental process of a specimen is shown in Fig. 5. Many AE hits (approximately 22000) are generated in the primary stress loading stage. When the target stress is attained, the number of AE hits decreases rapidly. Notable AE activities occur after all the six blasting disturbances, with a rapid decay, indicating that the specimen is in a stable state. Each blast induces a certain number of acoustic emission, which causes damage to the sample. With the increase of blasts, the damage accumulates gradually. The number of cumulative AE hits is 36000 after the six blasting disturbances. When the specimen is loaded to failure, the number of cumulative AE hits increases to 64000. In the entire experiment, the AE hits induced by the blasting disturbance account for only 22% of the number of cumulative AE hits, which illustrates that the relative impact of the blasting disturbance is not sufficient to cause fatal damage to the specimen at the current stress.
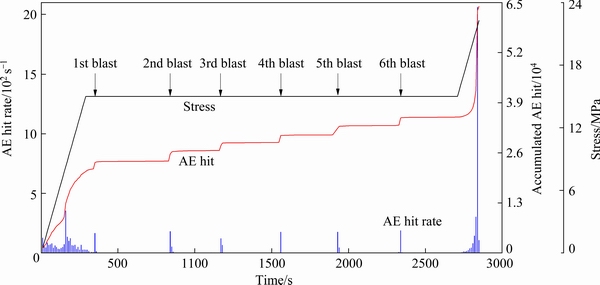
Fig. 5 AE activities of specimen after blasting disturbance with uniaxial loading
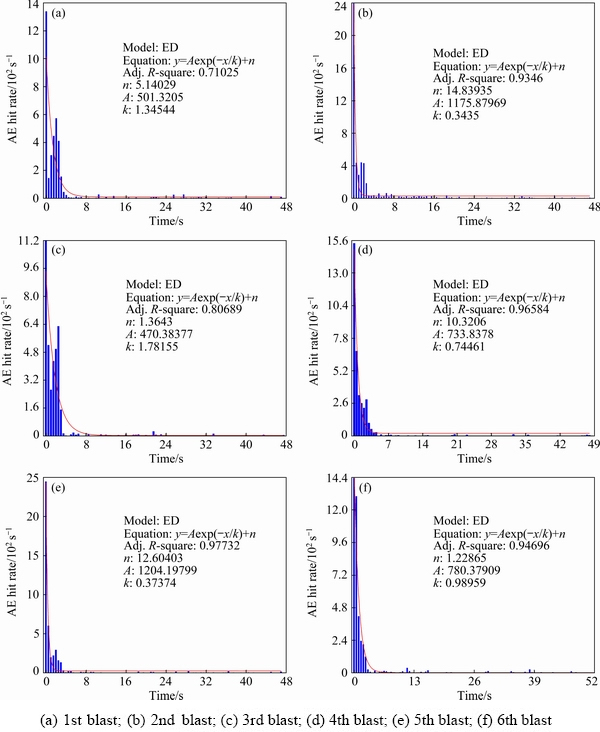
Fig. 6 Law of AE hit rate decay according to ED model under different blasts with same stress
The law of AE hit decay after each blasting disturbance is shown in Fig. 6. The AE sequencesafter the six blasting disturbances conform to the ED model. The values of the adjusted R square after the blasts, except for the 1st and 3rd blast, are more than 0.93, indicating conformance with the ED decay law. Small crests of the AE hit appear after the 1st and 3rd blast, with the corresponding values of the adjusted R square being 0.71 and 0.80, respectively, less than those of the other blasts. The numbers of the calculated initial AE hits after six blasting disturbances are 506.46, 1190.72, 471.75, 744.16, 1216.8 and 781.61, and the corresponding numbers of the actual initial AE hits are 669, 1201, 559, 768, 1222 and 717, respectively. Insignificant differences exist between the calculated and actual initial AE hits, except in the case of the 1st and 3rd blast. The k values for the six blasts range from 0.3 to 1.8 with irregular variations. The AE activities decayed rapidly in the blasting disturbance test. At the same time, the k value ranged from 0.3 to 1.8. Compared to the k value in the multilevel loading tests, it can be obtained that the specimen is in a stable state during the blasting disturbance. Therefore, the AE activity after blasting disturbance conforms to the ED model with a faster attenuation rate.
5 Microseismic activities after blasting in mine
5.1 Background
The depth of the No. 21 stope at the -707 m level in the Hongtoushan copper mine is 1127 m. The surrounding rock and ore correspond to gneiss and pyrite, respectively, which are typical hard rock. The stage room mining method is implemented in the mine, with subsequent filling and a fan shaped medium length hole used to mine the ore. No. 21 stope is 60 m high, 27 m long and 17 m wide. The top and bottom pillars are 8 m and 13 m thick, respectively. Figure 7 illustrates the division of the stope blasting mining area and arrangement of microseismic sensors. The Institute of Mine Seismology (IMS) microseismic monitoring system, consisting of 4 data acquisition instruments and 24microseismic unilateral sensors, was used to monitor the microseismic activity. The response frequency of the unilateral sensor ranged from 7 to 2000 Hz. The sensitivity was more than 80 V·m-1·s-1. The sensors were arranged at the -647 m level and -707 m level to improve the location accuracy [37-39]. The location error is less than 2.4 m through two artificial blasts. Five blasts of No. 21 stope occurred after the formation of the cutting groove from November 29, 2013 to June 10, 2014. The charge of the five blasts ranged from 1.78 to 2.52 t. The average unit explosive consumption of five blasts was 0.28 kg/t. The maximum charge per delay was 284.5 kg. The burden ranged from 1.1 to 1.2 m, while the spacing was 2.2 m [40]. No stope in mining process was arranged near the No. 21 stope.

Fig. 7 Division of stope blasting mining area and arrangement of microseismic sensors
5.2 Microseismic activity decay law after blasting
The microseismic activity of the No. 21 stope during the mining process is shown in Fig. 8. The spatial distribution law of the microseismic events can be found in the literature [30]. Each blast results in a sudden increase in microseismic events. Subsequently, the activity gradually reduces to the lower level of microseismic activity after the blast. Before the 1st blast, the number of microseismic events is approximately 12 per day, which is significantly larger than that for the background microseismic activity in the subsequent blast. The number of microseismic events per day before the 2nd blast is similar to the number of background microseismic events. Consequently, the initial microseismic events induced by the first two blasts are more than those induced by other blasts. This phenomenon can be attributed to the inadequate blast interval. The charges in the five blasts were 1780, 1900, 1880, 2520 and 1820 kg. No significant correlation between the blasting charge and number of microseismic events on the blasting day can be observed in the case of the No. 21 stope.
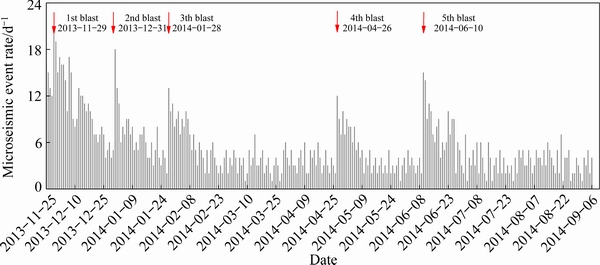
Fig. 8 Microseismic activities of No. 21 stope during mining process in Hongtoushan copper mine
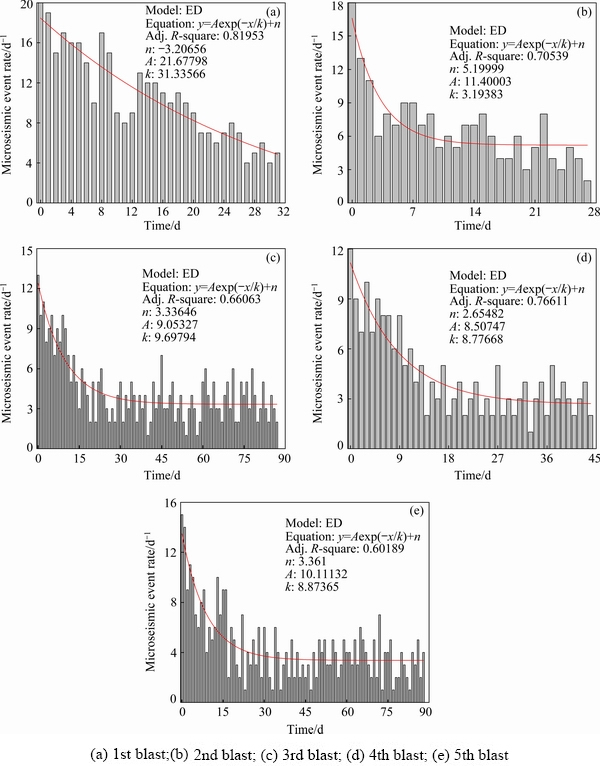
Fig. 9 Law of microseismic activity decay according to ED model after different blasts in No. 21 stope
The microseismic activity after every blast in the No. 21 stope is shown in Fig. 9. According to the fitting results, the microseismic event decay laws of the five blasts conform to the ED model. But they have slower decay process. The values of the adjusted R square for the five blasts are 0.82, 0.71, 0.66, 0.77 and 0.60. These values are less than those obtained in the multiple stress loading and blasting disturbance tests, likely because of the large fluctuations in the number of microseismic events per day caused by multiple disturbance sources in the complex field. The calculated numbers of initial microseismic events for the five blasts are 18.47, 16.6, 12.38, 11.16 and 13.47, corresponding to 20, 18, 13, 12 and 15 actual initialmicroseismic events, respectively. The corresponding deviations of the initial microseismic events are 7.65%, 7.78%, 4.77%, 7% and 10.2%. The k values of the five blasts are 31.33, 3.2, 9.7, 8.77 and 8.87, indicating that the microseismic event decays rapidly. Overall, the No. 21 stope is stable during the mining process.
The n values of the last four blasts range from 2.60 to 5.20. According to the physical significance of the n value, the number of background micro- seismic events of No. 21 stope varies from 2.60 to 5.20 per day. Unexpectedly, the n value of the 1st blast is -3.21, which is less than zero. In general, the n value should be positive according to its physical significance. After analyzing the difference in the microseismic event decay law pertaining to the 1st blast and other blasts, it was noted that the microseismic event decay law of the 1st blast corresponds to rapid decay, and it is not a complete microseismic event decay sequence. If sufficient time is allowed to pass after the 1st blast, the number of microseismic events of the 1st blast is expected to be similar to the number of background microseismic events. This phenomenon can be considered to be a false background microseismic event, in the event of an insufficient microseismic event recovery time. This phenomenon was not observed in the aforementioned tests because sufficient time was allowed to pass after every stress loading cycle and blasting disturbance. The real background microseismic activity can be obtained after enough blast interval after eliminating the influence of the noise signals.
6 Discussion
According to the proportional relationshipbetweenthe micro-fracture activity decay speed and difference in the micro-fracture activities and background micro-fracture activities, an ED model was proposed. The model contains parameters A, n and k. The sum of A and n represents the number of initial micro-fracture activity, while the n value represents the number of background micro-fracture events. When t is equal to k, the point is a characteristic point of the ED model. The reduced number of micro-fracture events is A(e-1)/e when the time is k. The decay speed of the micro-fracture event can be reflected by the k value. The physical significance of this parameter is similar to that of the parameter p of the MOM model. The analysis of the micro-fracture event decay law indicates that the ED model can describe the micro-fracture event well in the multilevel uniaxial loading test, blasting disturbance test and stope blasting events.
As mentioned previously, several well-known aftershock decay models are available at present, such as MOM [4], MSE [6] and LPL [7]models. If the adjusted R square of one model is the highest, its rank in the four models will be 1. The lower the average rank of one model is, the better it is. Based on the data used in this work, three models were used to demonstrate the performance of the ED model. The results are presented in Table 2. The proposed ED model exhibits the highest performance in the analysis of the 24 micro-fracture event decay sequences, among the four aftershock decay models. The average rank of the proposed model is 2.04, while the average ranks of the MOM, LPL and MSE models are 2.13, 2.38 and 3.46, respectively. The MSE model would have got better fitting effect without considering the meaning of parameters. Moreover, the ED model exhibits a high performance in the multilevel uniaxial loading test and mining blast. This is not consistent with the conclusion that stretched exponential is the best model to describe the aftershock decay law [28]. The reason may be that the stretched exponential is appliedin a longer temporal range. The data in this work were collected form multilevel loading tests, blasting disturbance tests and mining microseismic activity monitoring. The longest temporal range is about 10 months, much less than that of the aftershocks involved in the literature. In addition, three well-known aftershock models outperform the ED model in the blasting disturbance test.
Table 2 Values of adjusted R square of different models and ranks of 4 models
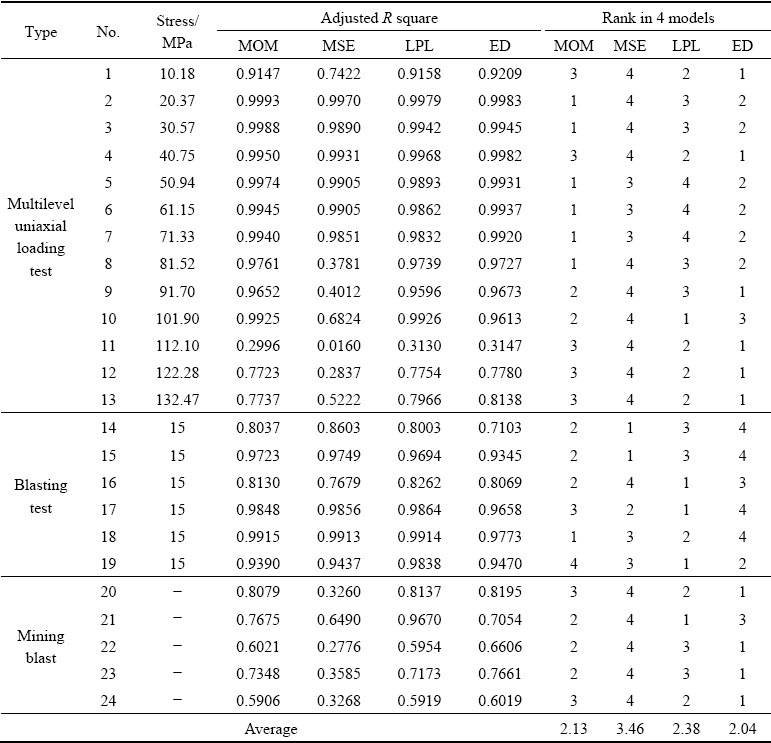
Therefore, a direct conclusion cannot be made regarding the model most suitable to describe the micro-fracture event decay law, and the model must be selected according to specific conditions.
The values of the adjusted R square of each model are shown in Fig. 10. No model exhibits a clearly superior performance in the analysis of all the micro-fracture event decay sequences. However, the ED model is relatively stable among the four models. Even in the blasting disturbance test, which corresponds to an inferior performance, the performance of the ED model is comparable to that of the other three models. Compared with the MSE and LPL models, the ED and MOM models are simpler. Therefore, the ED model is easy to understand and apply, and the meaning of its parameter is clear. Moreover, the AE sequences of the multilevel uniaxial loading test conform the most to the micro-fracture event decay model, especially in the primary loading stage, followed by the blasting disturbance test, and the mining blasts. This phenomenon occurs because more disturbance factors exist in the field mine and blasting disturbance test than in the multilevel uniaxial loading test. In addition, the values of the adjusted R square decrease significantly when the stress exceeds 100 MPa, 60% of the peak stress, in the multilevel uniaxial loading test. With the loading progressing, the sample enters into the unstable stage. The acoustic emission is more active in this stage, and its fluctuation is large. At this moment, the number of micro-fracture events may increase even if no stress loading disturbance is present [41]. Hence, the values of the adjusted R square have a decrease trend when the stress is higher than 100 MPa.
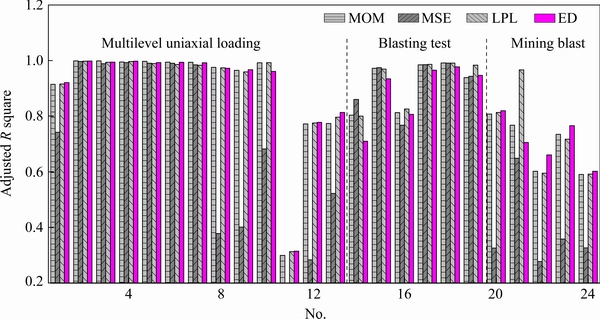
Fig. 10 Adjusted R square values of aftershocks according to MOM, MSE, LPL and ED models
The range of n value is from 1.11 to 211.20 in the multilevel loading tests, while from 1.22 to 14.84 in the blasting disturbance tests and from 2.65 to 5.20 in the microseismic activity monitoring of deep stope. Furthermore, the n value, which represents the background micro-fracture events, may be influenced by stress. The n values are 1.12, 1.44, 2.61, 85.49, 79.11 and 211.20 at 12%, 25%, 37%, 50%, 62% and 81% of the peak stress, respectively. When the stress is less than 50% of the peak stress, the increase of n is not apparent. When the stress ranges from 50% to 62% of the peak stress, the magnitude of n value change is also relatively slight. Then, it is not difficult to understand the fluctuation of n value in blasting disturbance test and microseismic activity monitoring.
7 Conclusions
(1) An ED model is developed through theoretical derivation to describe the micro-fracture event decay law, and the model exhibits a high performance in the multilevel uniaxial loading test, blasting test and mining blast event. It outperforms the traditional aftershock decay models in describing the micro-fracture event decay law of three working conditions considered.
(2) The sum of A and n represents the number of initial micro-fracture events, and n represents the level of background earthquakes. In addition, k is a reflection of the decay speed. The ED model can describe the number of initial micro-fracture events with a deviation less than 10% in mostconditions. The range of n value is from 1.11 to 211.2 in the multilevel loading tests, which may be influenced by the stress.
(3) The ED model has a simple expression, and parameters exhibit clear physical significance, which facilitates the application of the ED model. However, the micro-fracture event decay model should be selected according to the specific conditions. The ED model can assist in the mining blast design process. Study of the deeper mechanism of the microseismic activity after blasts will help engineers to apply ED model for mine safety.
Acknowledgments
Theauthorsaregratefulforthefinancialsupportsfromthe National Natural Science Foundation of China (Nos. 51704056, 51974059), the China Postdoctoral Science Foundation (No. 2017M621152), and the Fundamental Research Funds for the Central University of China(Nos. N160103006, N180115010, N2001001).
References
[1] MIGNAN A. Forecasting aftershocks: Back to square one after a Deep Learning anticlimax [EB/OL]. Temblor, 2019. http://doi.org/10.32858 /temblor.053.
[2] DEVRIES P M R, VIEGAS F, WATTENBERG M, MEADE B J. Deep learning of aftershock patterns following large earthquakes [J]. Nature, 2018, 560(7720): 632-634.
[3] OMORI F. On the after-shocks of earthquakes [J]. J CollSci, 1894, 7: 111-200.
[4] UTSU T. A statistical study on the occurrence of aftershocks [J]. Geophys Mag, 1961, 30: 521-605.
[5] KISSILINGER C. The stretched exponential function as an alternative model for aftershock decay rate [J]. Journal of Geophysical research, 1993, 98: 1913-1921.
[6] GROSS S J, KISSILINGER C. Test of models of aftershock rate decay [J]. Bulletin of the Seismological Society of America, 1994, 84: 1571-1579.
[7] NARTEAU C, SHEBALIN P, HOLSCHNEIDER M. Temporal limits of the power law aftershock decay rate [J]. Journal of Geophysical research, 2002, 107(B12): 2359-2372.
[8] SHCHERBAKOV R, TURCOTTE D L, RUNDLE J B. A generalized Omori's law for earthquake aftershock decay [J]. Geophysical Research Letters, 2004, 31(11): L11613.
[9] OGATA Y. Statistical models for earthquake occurrences and residual analysis for point processes [J]. Journal of the American Statistical Association, 1988, 83: 9-27.
[10] PERFETTINI H, AVOUAC J P. Postseismic relaxation driven by brittle creep: A possible mechanism to reconcile geodetic measurements and the decay rate of aftershocks, application to the Chi-Chi earthquake, Taiwan [J]. Journal of Geophysical Research, 2004, 109: B02304.
[11] PENG Zhi-gang, VIDALE J E, HOUSTON H. Anomalous early aftershock decay rate of the 2004 Mw6.0 Parkfield, California, earthquake [J]. Geophysical Research Letters, 2006, 33: L17307.
[12] BEBBINGTON M. Estimating rate- and state-friction parameters using a two-node stochastic model for aftershocks [J]. Tectonophysics, 2008, 457(1-2): 71-85.
[13] LOLLI B, GASPERINI P. Comparing different models of aftershock rate decay: The role of catalog incompleteness in the first times after main shock [J]. Tectonophysics, 2006, 423 (1-4): 43-59.
[14] GASPERINI P, LOLLI B. An empirical comparison among aftershock decay models [J]. Physics of the Earth and Planetary Interiors, 2009, 175: 183-193.
[15] LIANG Zheng-zhao, TANG Chun-an, ZHU Wan-cheng, YANG Tian-hong, WANG Shan-yong. Numerical simulation of the influence of rock heterogeneity on the relationship between magnitude and frequency [J]. Earthquake Research, 2003, 26: 151-155. (in Chinese)
[16] LONG Yi, LIU Jian-po, LEI Gang, SI Ying-tao, ZHANG Chang-yin, WEI Deng-cheng, SHI Hong-xu. Progressive fracture processes around tunnel triggered by blast disturbances under biaxial compression with different lateral pressure coefficients [J]. Transactions of Nonferrous Metals Society of China, 2020, 30(9): 2518-2535.
[17] TULEAU J, WOODWARD K, GRENON M, LAJOIE P L. Blast induced seismic response at the Goldcorp Eleonore mine: Identification, delineation and characterization [C]//Proc AMRS10. Singapore, PA: ISRM, 2018:1-12.
[18] ZHOU Zi-long, LI Guo-nan, NING Shu-li, DU Kun. Acoustic emission characteristics and failure mechanism of high-stressed rocks under lateral disturbance [J]. Chinese Journal of Rock Mechanics and Engineering, 2014,33(8): 1720-1728. (in Chinese)
[19] LI Nan, WANG En-yuan, ZHAO En-lai, MA Yan-kun, XU Fu-le, QIAN Wei-hua. Experiment on acoustic emission of rock damage and fracture under cyclic loading and multi-stage loading [J]. Journal of China Coal Society, 2010, 35(7): 1099-1103. (in Chinese)
[20] CHEN Yu-long, WEI Zuo-an, ZHANG Qian-gui. Experimental study on Felicity effect of acoustic emission in rock under cyclic loading and tiered cyclic loading [J]. Journal of China Coal Society, 2012, 37(2): 226-230. (in Chinese)
[21] SCHOLZ C H. Experimental study of the fracturing process in brittle rock [J]. Journal of Geophysical Research, 1968, 73: 1447-1454.
[22] LOCKNER D, BYERLEE J. Acoustic emission and creep in rock at high confining pressure and differential stress [J]. Bulletin of the Seismological Society of America, 1977, 67: 247-258.
[23] HIRATA T. Omori’s power law aftershock sequences of microfracturing in rock fracture experiment [J]. Journal of Geophysical Research, 1987, 92: 6215-6221.
[24] GROSS S. Aftershocks of nuclear explosions compared to natural aftershocks [J]. Bulletin of the Seismological Society of America, 1996, 86: 1054-1060.
[25] GIBOWICZ S J. An anatomy of a seismic sequence in a deep goldmine [J]. Pure and Applied Geophysics, 1997, 150: 393-414.
[26] LI Xue-zheng, LIU Wen-xue, SHEN Xu-feng. Model of the duration and frequency of the aftershock waveform [J]. Earthquake Science, 2004, 26: 539-546. (in Chinese)
[27] LEI Xing-lin, YU Guo-zheng, MA Sheng-li, WEN Xue-ze, WANG Qiang. Earthquakes induced by water injection at 3km depth within the Rongchang gas field, Chongqing, China [J]. Journal of Geophysical research, 2008, 113: 167-184.
[28] MIGNAN A. Modeling aftershocks as a stretched exponential relaxation [J]. Geophysical Research Letters, 2006, 42: 9726-9732.
[29] WOODWARD K, WESSELOO J, POTVIN Y. Temporal delineation and quantification of short term clustered mining seismicity [J]. Pure and Applied Geophysics, 2017, 174(7): 2581-2599.
[30] LIU Jian-po, XU Shi-da, LI Yuan-hui. Analysis of rock mass stability according to power-law attenuation characteristics of acoustic emission and microseismic activities [J]. Tunnelling and Underground Space Technology, 2019, 83: 303-312.
[31] ESTAY R, VALLEEJOS J, PAVEZ C. A comparison of characteristic parameters of mining related and tectonic seismic aftershock sequences [J]. International Journal of Rock Mechanics and Mining Sciences, 2020, 128: 104242.
[32] MATHAI A M, HAUBOLD H J. Pathway model, superstatistics, Tsallis’ statistics and a generalized measure of entropies [J]. Physical A, 2007, 375(1): 110-122.
[33] SANCHEZ C E, VEGAJORQUERA P. Modelling temporal decay of aftershocks by a solution of the fractional reactive equation [J].Applied Mathematics and Computation, 2019, 340: 43-49.
[34] DONG Long-jun, WESSELOO J, POTVIN Y. Discrimination of mine seismic events and blasts using the fisher classifier, naive bayesian classifier and logistic regression [J]. Rock Mechanics and Rock Engineering, 2016, 49: 183-211.
[35] KORTSTROM J, USKI M, TIIRA T. Automatic classification of seismic events within a regional seismograph network [J]. Computers & Geosciences, 2016, 87: 22-30.
[36] XU Shi-da, ZHANG Chen-rui, CHEN Zhi-yang, LI Yuan-hui, LIU Jian-po. Accurate identification of microseismic waveforms based on an improved neural network model [J]. Journal of Applied Geophysics, 2021, 190: 104343.
[37] DONG Long-jun, ZOU Wei, LI Xi-bing, SU Wei-wei, WANG Ze-wei. Collaborative localization method using analytical and iterative solutions for microseismic/acoustic emission sources in the rockmass structure for underground mining [J]. Engineering Fracture Mechanics, 2018, 210: 95-112.
[38] DONG Long-jun, HU Qing-chun, TONG Xiao-jie, LIU You-fang. Velocity-free MS/AE source location method for three-dimensional hole-containing structures [J]. Engineering, 2020, 6: 827-834.
[39] ZHOU Zi-long, ZHOU Jing, CAI Xin, RUI Yi-chao, CHEN Lian-jun, WANG Hai-quan. Acoustic emission source location considering refraction in layered media with cylindrical surface [J]. Transactions of Nonferrous Metals Society of China, 2020, 30(3): 789-799.
[40] XU Shi-da, LI Yuan-hui, LIU Jian-po, ZHANG Feng-peng. Optimization of blasting parameters for an underground mine through prediction of blasting vibration [J]. Journal of Vibration and Control, 2019, 25: 1585-1595.
[41] JIN Chang-yu, LU Yu, HAN Tao, CHEN Tian-yu, CUI Jian-xin, CHENG Dong-xu. Study on refined back-analysis method for stress field based on in situ and disturbed stresses [J]. International Journal of Geomechanics, 2021,21(8): 04021141.
分级加载与爆破扰动诱发声发射和微震活动的指数衰减规律
徐世达,陈天晓,刘佳奇,张宸瑞
东北大学 深部金属矿山安全开采教育部重点实验室,沈阳110819
摘 要:为了研究分级加载和采动爆破扰动引起的声发射和微震活动的衰减规律,提出一种新的指数衰减(ED)模型。结果表明:分级加载和爆破扰动后的微破裂活动衰减规律符合ED模型。模型中A与n之和表示初始微破裂事件数,n表示背景地震级别。ED模型可以描述初始微破裂事件的数量,其偏差小于10%。在本研究考虑的三种工况下,ED模型描述微破裂事件衰减规律的能力优于传统的余震模型。该模型可为矿山爆破时间间隔的选择提供参考,对保持金属矿山围岩的稳定性、保证安全生产具有重要意义。
关键词:指数衰减规律;爆破扰动;声发射;微震活动;金属矿
(Edited by Bing YANG)
1003-6326/ 2021 The Nonferrous Metals Society of China. Published by Elsevier Ltd & Science Press
Abstract:To investigate decay law of acoustic emission and microseismic activities caused by disturbances associated with multilevel loading and mining blast, a new exponential decay (ED) law was proposed. The results show that the micro-fracture activity decay law after multistage stress loading and blasting disturbance conforms to the ED model, in whichthe sum of A and n represents the number of initial micro-fracture events, and n represents the level of background micro-fracture events. The ED model can describe the number of initial micro-fracture events with a deviation less than 10%. The ED model outperforms the traditional aftershock models in describing the micro-fracture event decay law in the three cases considered. The ED model can provide a reference for selecting the blasting interval in mines, which is of great significance to maintain the stability of the surrounding rock and ensure safe production in metal mines.