Trans. Nonferrous Met. Soc. China 31(2021) 3579-3590
Improved CFD modeling of full dissolution of alumina particles in aluminum electrolysis cells considering agglomerate formation
Shui-qing ZHAN1, Ming-mei JIANG1, Jun-feng WANG1, Jian-hong YANG2
1. School of Energy and Power Engineering, Jiangsu University, Zhenjiang 212013, China;
2. School of Material Science and Engineering, Jiangsu University, Zhenjiang 212013, China
Received 5September 2021; accepted 4November 2021
Abstract:
he full alumina dissolution process in aluminum electrolysis cells was investigated using an improved computational fluid dynamics (CFD) model based on the previous researches by consideration of agglomerate formation. The results show that the total mass of alumina agglomerate and its maximum size are mainly dependent on the feeding amount and increase with increasing it. Higher superheat can effectively inhibit the agglomerate formation and thus promote the full alumina dissolution behavior. The full alumina dissolution process mainly includes a fast stage and a slow stage, with an average dissolution rate of 17.24 kg/min and 1.53 kg/min, respectively. About 50% (mass percentage) of the total alumina particles, almost all of which are the well-dispersed alumina fine grains, dissolve within the fast dissolution stage of about 10 s. The maximum values of the average dissolution rate and final percentage of the cumulative dissolved alumina mass are obtained with a feeding amount of 1.8 kg for a superheat of 12 °C. The formation of the alumina agglomerates and slow dissolution characteristics play a dominant role in the full dissolution of alumina particles.
Key words:
aluminum electrolysis; alumina dissolution; agglomerate formation; theoretical modeling; CFD modeling;
1 Introduction
Alumina is the principal raw material used in the Hall-Héroult process in order to produce aluminum. The effective dispersion, rapid dissolution and more distribution of alumina in molten cryolite are the decisive factors for the stable operation and design of the modern aluminum reduction cells. With increasing electrolysis intensity and reducing anode-cathode distance (ACD) in modern industrial cells, the control of alumina feeding and dissolution of the alumina particles have been the bottleneck of limiting the development of the modern aluminum industry [1].
Unfortunately, only parts of well-dispersed cold alumina particles will dissolve very quickly into the bath, while other cold alumina particles present a poor dispersion characteristic and thus form floating agglomerates consisting of solidified bath and undissolved alumina [2,3]. It is a common phenomenon for the agglomerate formation in both the laboratory and industrial scale electrolysis cells, which can dramatically hinder the alumina dissolution process and lead to anode effects. Moreover, the slow-dissolving agglomerates would sink into the metal layer and result in sludge formation, causing numerous operational problems and leading to higher energy demand and lower current efficiency [4]. Indeed, previous experimental researches have suggested that the full dissolution process of alumina is largely dominated by the very slow dissolution rate of these undesirable agglomerates [2,5,6]. Therefore, keepinga good dispersion characteristic of alumina particles and inhibiting the agglomerate formation can effectively benefit the fast alumina dissolution process.
There are various operational parameters influencing the formation and dissolution of the alumina agglomerates, which have been reported in the comprehensive review [4]. However, most of the previous researches have focused on the qualitative description of the surface morphology, composition and structure of the agglomerates and their dissolution and sinking behaviors mainly by direct observation and simply analysis [7-10]. More recently, some experimental and theoretical studies have been carried out to evaluate the quantitative information. The agglomerate mass, properties and dissolution rate were investigated through experiments by YANG et al [11,12]. GYLVER et al [13] performed an industrial measurement to obtain the agglomerate size, porosity and density. Then, they continued to conduct a laboratory experiment and concluded that both the density and the porosity of agglomerates were in the same range as those found in industrial agglomerates [14]. Raymond et al [15] established a physical and mathematical model of the single agglomerate formation. Then, the relationship between the agglomerate density and its maximum size was further developed by Kaszás et al [16]. The above qualitative and quantitative investigations can provide an increased understanding of the agglomerate formation mechanism and lay a solid foundation for the theoretical calculation and prediction of the dispersion behavior of the alumina particles during industrial feeding process.
Because of the high temperature and corrosive nature of the molten cryolite, both the laboratory and industrial scale experiments are incapable of accounting for all the complex phenomena involving the dispersion, dissolution and distribution of alumina particles and the coupling with the local corresponding thermodynamic and hydrodynamic conditions within cells. Therefore, computational fluid dynamics (CFD) methods have been utilized to simulate the alumina dissolution and distribution process in industrial cells [17-29]. Nevertheless, previous CFD works were aimed at simulating the alumina distribution by only considering a simplified hysteresis effect as alumina pseudo-dissolution after feeding [17-22], but ignoring the slow-dissolving behavior of agglomerates from poor-dispersed cold alumina particles. Our previous works [23,24] creatively presented a CFD approach coupled with a two-particle phase population balance model (CFD-TPPBM) to model the actual dissolution and distribution process of different alumina particles with heat and mass transfer mechanisms. In recent years, LI and his group [26-29] also developed a numerical method to track different alumina particle movements and further simulated the alumina dissolution and distribution process. However, there are still some limitations existing in these numerical simulation researches due to lack of reliable and reasonable size distributions of alumina agglomerates.
The framework of the present study is the improvement of our previous CFD-TPPBM technique [23] and the more efficient multiphase flow fields [30,31] validated through experiments, which requires the quantitative distributions of the alumina agglomerates as several sub-models. Therefore, a new modified modeling approach for reasonably describing and predicting the dispersion process of alumina particles in an industrial cell is firstly developed by combining the theoretical study of ZHANG [32] and the laboratory experimental study of YANG et al [11]. Then, an improved CFD model considering the full dissolution process of the alumina particles is presented and the influence of some key operational parameters such as the feeding amount, bath superheat and alumina concentration,is investigated.
2 Theoretical calculation and CFD model
2.1 Theoretical modeling of agglomerate formation
As previously mentioned, when a certain initial feeding amounts of cold alumina particles are added into the molten bath, part of the alumina particles can show good dispersed characteristic and dissolve rapidly throughout the feeding zone, which are considered as alumina fine grains. However, some other cold alumina particles will disperse poorly and are penetrated and surrounded by solidified bath, leading to the formation of crusts or agglomerates. Thus, according to the mass conservation principles, the part amount of the alumina particles forming the alumina agglomerates and the amount of the alumina particles already contained in the alumina agglomerates should theoretically balance out within the alumina feeding process. The mass proportion of the alumina particles forming part of the alumina agglomerates,P, can be expressed as
 (1)
(1)
whereCa is the mass fraction of the alumina particles in the alumina agglomerates;Maggis the total mass of the alumina agglomerates;Ma is the initial feeding amount of the cold alumina particles.
The hydration water of the alumina particles can release in the form of water vapour within alumina crystal transformation from gamma- alumina to alpha-alumina during the formation of the alumina agglomerates. Most water vapour can release quickly, but a little amount is surrounded by solidified bath immediately. Therefore, the alumina particles, solidified bath and water vapour are formed together as the alumina agglomerates with an obvious porous structure. The definition and the calculation formula of the porosity of the alumina agglomerate are given as
 (2)
(2)
whereD is a single alumina agglomerate porosity;Vagg is a single alumina agglomerate volume;Va is a total volume of the alumina particles in a single alumina agglomerate;Vb is the total volume of the solidified bath in a single alumina agglomerate.
Furthermore, the detailed analytical formula of Ca is developed according to the relations of the density and volume for different porous components:
 (3)
(3)
whereρa, ρband ρaggare the densities of the alumina particle, the bath and the alumina agglomerate, respectively. Based on the laboratory experimental results of YANG et al [11], the relationship between ρagg and D with two different superheats including 7 and 12 °C, were analyzed and summarized, as shown in Fig. 1, and the corresponding fitting expressions were also obtained. Therefore Ca follows directly from ρagg and D, ifρa and ρbare known.
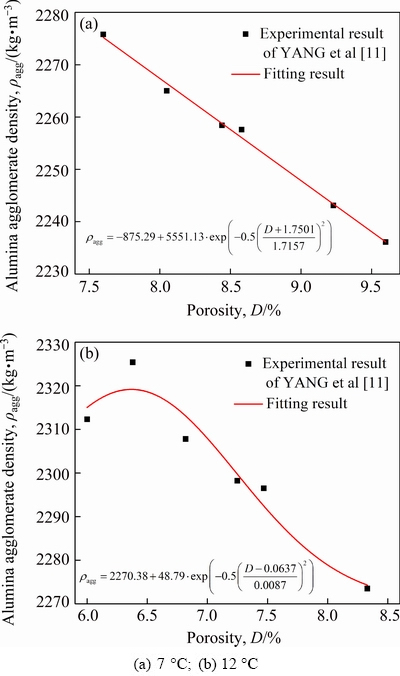
Fig. 1 Relationship between alumina agglomerate density and porosity with different superheats
According to the mass conservation and the dispersion characteristics of the cold alumina particles as introduced earlier, an improved solution algorithm and modeling method are proposed in this work by referring to the research method of ZHANG [32] and combining the laboratory experiment results of YANG et al [11]. This study persists that all the spherical alumina particles show relatively smooth or grainy morphology. Therefore, the initial total number of the cold alumina particles Na during the feeding process can be calculated as
 (4)
(4)
where da is the average equivalent diameter of the alumina particles.
All the alumina agglomerates are also considered as smooth spherical particles. Thus, the total number of the alumina particles that exist in all the alumina agglomerates is P·Na. And even supposing that, the alumina agglomerates show obvious characteristics of size and number distributions. Thus, the number of the alumina particles within a single alumina agglomerate Na,aggcan be calculated as
 (5)
(5)
wheredagg and maggare the diameter and mass of a single alumina agglomerate, respectively;ma is the mass of a single alumina particle.
The ratio of the alumina agglomerate with any diameter dagg to da is defined as L=dagg/da. And we assume ln L (the logarithm of L) is approximately normally distributed and keep y-axis as symmetry axis in rectangular coordinates. Because dagg should be larger than zero, ln L is regarded as the absolute value of a random variable x with an expected value of zero and a standard deviation of σ. The expression is written as
ln L=|x|, x~N(0, σ2) (6)
Any two different alumina agglomerate diameters dagg,1and dagg,2 (dagg,1<>agg,2) are selected and the corresponding random variables are ln L1 < ln L2. Therefore, when ln L ranges fromln L1 to ln L2, the probability F1,2can be calculated as
 (7)
(7)
wheref is the cumulative distribution function for the standard normal distribution.
When dagg,1and dagg,2 get very close together, the difference between ln L1 and ln L2 is very small. Therefore, the number of the alumina agglomerates Nagg,1,2and the number of the alumina particles Na,1,2 contained in alumina agglomerates with diameters between dagg,1 and dagg,2 are expressed as
 (8)
(8)
 (9)
(9)
whereNtotal,agg is the total number of the alumina agglomerates.
As indicated above, the total number of the alumina particles Na,total,1,2in the alumina agglomerates with its number of Nagg,1,2 can be calculated as
 (10)
(10)
The total number of the alumina agglomeratesNtotal,agg can be determined as
 (11)
(11)
 (12)
(12)
wheren changes with ln L for different alumina agglomerate diameters. The number of the maximum diameter of the alumina agglomerate should be at least one.
The normal probability density function presented in this work is a continuous function and ln L is a continuous variable. However, the variable L is discretized and assumed as an integer for simplified calculation. Large theoretical and practical calculations show that Ntotal,agg is closely correlated withP·Na and σ. Based on the experimental results of YANG et al [11], the small-scale experimental relationships between Magg and alumina content C (mass fraction of alumina in the bath, %) for two different superheats (7 and 12 °C) were also analyzed and summarized, as shown in Fig. 2. The corresponding fitting expressions were also obtained.
Finally, based on the above relationships of these parameters and analysis, the actual Magg and P·Na can be comprehensively calculated for different industrial large-scale alumina feeding amounts and other key processing parameters such as superheat and alumina content. The number and mass distributions of the alumina agglomerates with different sizes can be further determined, which will serve as the important initial and boundary conditions as well as mass transfer correlations for modeling of the full dissolution process of the total alumina particles in industrial aluminum electrolytic cells.
2.2 Numerical model of full dissolution process of alumina particles
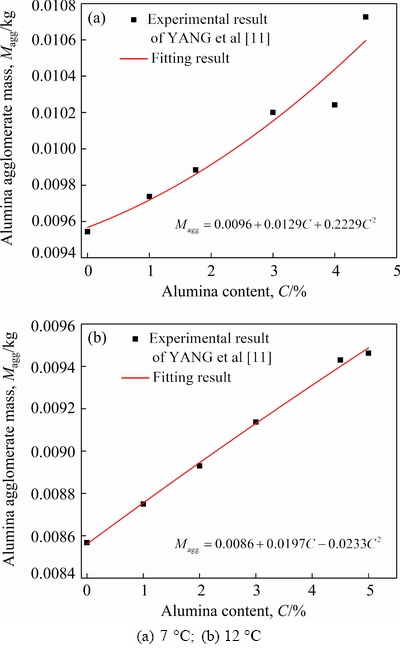
Fig. 2 Relationship between alumina agglomerate mass and alumina content with different superheats
The multiphase flow fields and the alumina dissolution process in industrial aluminum electrolytic cells were numerically simulated by applying a CFD-TPPBM method in our previous study [23]. However, in previous investigation, the initial number and mass distributions of the alumina agglomerates with different sizes and the mass ratio of alumina fine grains to alumina agglomerates were established heavily based on the simplification and rough assumptions. Despite many studies on the formation behavior of the alumina agglomerates, there is scarce study on the quantitative description due to the complex process of heat and mass transfer environments as mentioned earlier. Therefore, the improved theoretical modeling of the distribution characteristics of the alumina agglomerates presented in this work can provide some key and detailed corresponding calculation parameters. In addition, the further study and improvement of the gas–liquid two-phase flow model for accurately simulating the bubble-induced bath force by considering bubble coalescence and breakup behavior that represented the time-averaged momentum source terms of the bath phase were also proposed based on our previous works [30,31]. The detailed calculation flow chart of the improved CFD model has been provided in Fig. 3. More information and mathematical derivations of the calculated parameters can be found in our previous works [23,30,31].
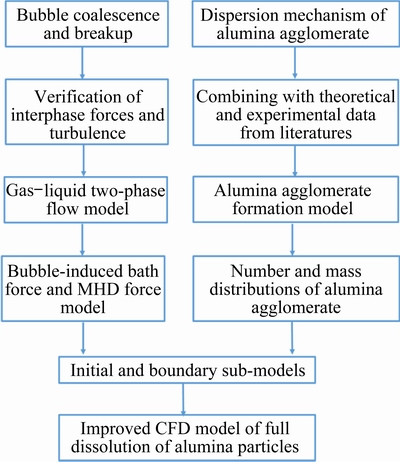
Fig. 3 Calculation flow chart of improved CFD model
In the present study, a 300 kA aluminum electrolysis cell is proposed and the detailed geometrical parameters and the four alumina feeding positions with inter-anode feeders can also be found in our previous study [23]. The initial industrial scale alumina feeding amount Ma of 1.0, 1.2, 1.4, 1.6, 1.8 and 2.0 kg and the corresponding feeding cycle of 80, 96, 112, 128, 144 and 160 s are used in the simulation. Based on the former analysis, the mass ratio between the alumina fine grains and the alumina agglomerates is (1-P)Ma/Magg. Each alumina feeding position is assumed to the same feeding amount and the alumina particles are assumed to start to dissolve at the same time. The feeding position surface is treated as a mass-flow-inlet boundary condition with the calculated mass flow rates and the corresponding volume fractions of each particle group based on the number and mass distributions of the alumina fine grains (grain size testing) and the alumina agglomerates. Specifically, for reducing the computation amount of the CFD-TPPBM modeling in the current calculation, we divide the whole alumina agglomerate evenly into 16 groups in the order of the smallest to the largest in size. The size of each group is obtained based on the averaged agglomerate diameters. Therefore, an improved CFD modeling of the full dissolution of alumina particles can be proposed, in which the details for the mathematical formulations and numerical solution strategy are similar to those reported in our previous work [23].
3 Results and discussion
3.1 Distribution characteristics of alumina agglomerates
As described above, the variable L=dagg/da should be increased with the increase of the alumina agglomerate diameter. The maximum value for L is Lmax. Furthermore, the changes of Lmax following P·Na and its relation with σfor the alumina feeding amounts in a range from 1.0 to approximately 2.0 kg are shown in Fig. 4.
The result shows that when σ grows above a certain value,Lmax approximately preserves as a maximum value. Figure 5 illustrates the mathematical relationship between [Lmax] (the critical value of Lmax) and P·Na and its fitted correlation can be expressed as [Lmax]= 2.0288(P·Na)0.2492. Then, we regard [Lmax] as Lmax again, and σ can be obtained. Furthermore, the number and mass distributions ofthe alumina agglomerates and their total mass are gained consequently.
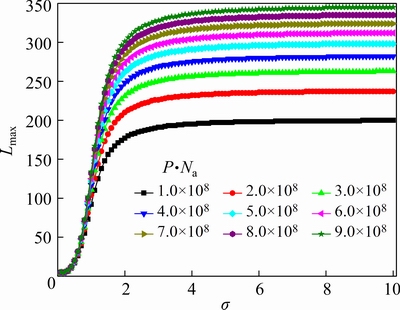
Fig. 4 Relationship between Lmax and σ with different values of P·Na
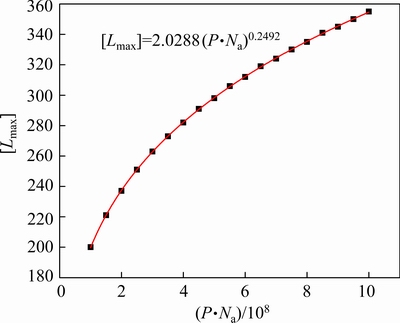
Fig. 5 Relationship between [Lmax] and P·Na
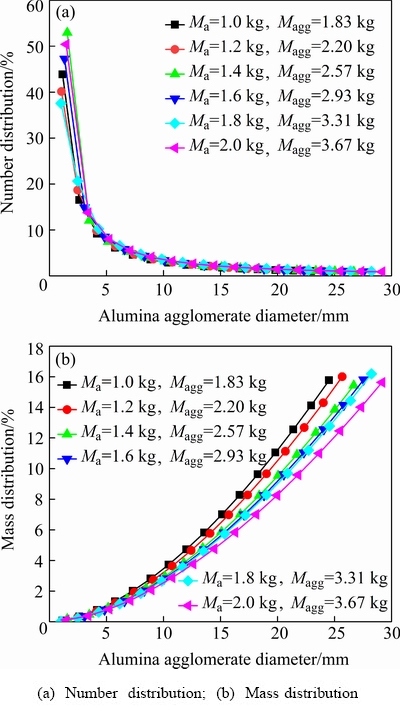
Fig. 6 Alumina agglomerate distributions for different feeding amounts
This study combines the relevant process parameters including the alumina feeding amount, the superheat and the alumina concentration, and explores their impacts on the alumina agglomerate distributions. The number and mass distributions of the alumina agglomerates with 16 different sizes for different feeding amounts are displayed in Fig. 6. It can be seen in Fig. 6 that the changing laws of both the number and mass distribution curves are basically the same with different feeding amounts. With the increase of the alumina agglomerate diameter, the alumina agglomerate number decreases, but the alumina agglomerate mass increases. The alumina agglomerates for the diameter less than 10 mm constitute the majority of number, particularly among the diameters less than 3 mm. Although the numbers of the larger alumina agglomerates are very small, their masses are much greater due to their larger particle volumes. The calculated maximum size is 25-30 mm, which is in consonance with the typical non-spherical agglomerate particles with a diameter of 10-50 mm and with a height of 10-20 mm reported in experimental results [33,34]. Moreover, with increasing the feeding amount, the maximum size of the alumina agglomerates is gradually increased, and the total mass of the alumina agglomerates Magg also increases. This is because the larger feeding amounts can lead to excessive and a much wider temperature drop of the bath and hence more possibility for the agglomerate formation due to the poorer dispersion characteristics. Presumably, the large value of Maggwould cause slow dissolution rate of the alumina agglomerates.
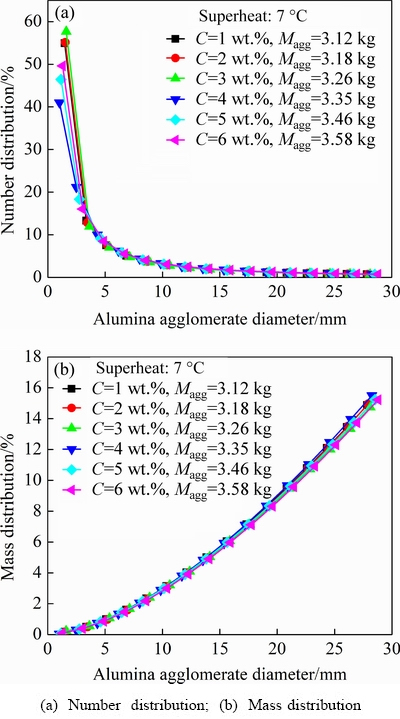
Fig. 7 Effect of alumina content on alumina agglomerate distributions with superheat of 7 °C
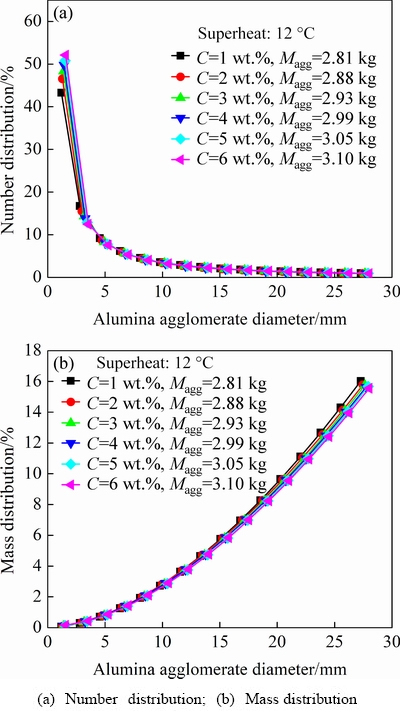
Fig. 8 Effect of alumina content on alumina agglomerate distributions with superheat of 12 °C
Figures 7 and 8 reveal the effects of alumina content on the number and mass distributions of the alumina agglomerates for two different superheats (with same feeding amount of 1.6 kg). The superheat is the difference between the bath operating temperature and the bath liquidus temperature. The change trends of these two kinds of distribution curves under different alumina contents and superheats are almost the same, which are similar to those discussed in Fig. 6. However, slightly different from those in Fig. 6 for changing the feeding amount, the specific percentages of the number and mass of the alumina agglomerates present less variation for changing the alumina content. Interestingly, it also can be concluded from Figs. 6-8 that the Maggwould increase significantly as the feeding amount increases, rather than increasing alumina content or superheat with a constant feeding amount. Similar results were also obtained in the experiment study of YANG et al [11].
The total mass of the alumina agglomerates Maggand the mass proportion of the alumina particles forming alumina agglomerates P under different alumina contents and superheats are shown in Fig. 9. While the alumina content increases, both Maggand P increase and the increase trend is more obvious for the lower superheat of 7 °C. When the alumina content remains constant, both Maggand P decrease with the increase of the superheat. The results indicate that the actual bath liquidus temperature would drop at high alumina content, leading to a poor heat transfer condition between the frozen shell and the molten bath. Therefore, more additional solidified bath and cold-state alumina particles will penetrate into the alumina agglomerates. A lower superheat means a lower bath operating temperature and heat transfer coefficient without changing alumina content, and more energy and time are required for remelting the frozen bath shell before the dissolution can occur. Furthermore, it can potentially increase the chance of the mutual penetration between the cold alumina particles and the solidified bath and therefore cause more alumina agglomerates.
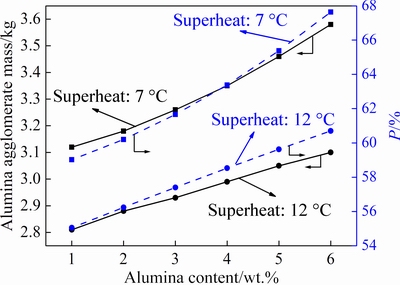
Fig. 9 Effects of alumina content and superheat on alumina agglomerates
3.2 Dissolution characteristics of alumina particles
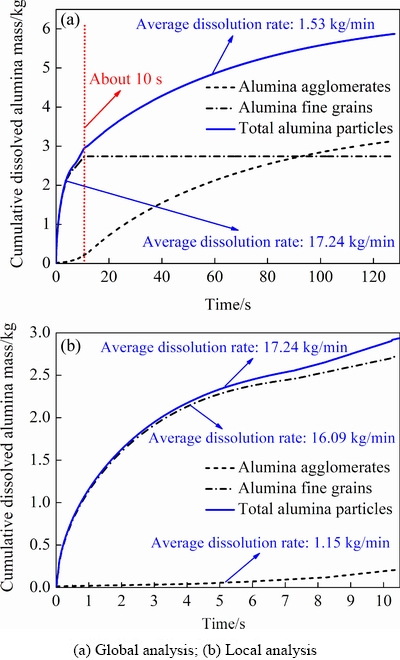
Fig. 10 Cumulative dissolved alumina mass in one feeding cycle with total feeding amounts of 6.4 kg
The cumulative dissolved mass of the total alumina particles, including alumina fine grains and alumina agglomerates, increases fast at first and then slows down within one feeding cycle of 144 s (with a total feeding amount of 6.4 kg and a superheat of 12 °C), as shown in Fig. 10. This means the dissolution rate (cumulative dissolved alumina mass with dissolution time) is gradually decreased. The full alumina dissolution process can be divided into two main stages with different dissolution rates and the demarcation dissolution time is about 10 s (see red dotted line in Fig. 10(a)). The two dissolution stages are the fast dissolution stage with an average dissolution rate of 17.24 kg/min and the slow dissolution stage with an average dissolution rate of 1.53 kg/min, respectively, and the former is about one order larger than the latter. About 50% (mass percentage) of the total alumina particles have dissolved within the fast dissolution stage, and almost all the alumina fine grains are dissolved. From the local analysis of the fast dissolution process in Fig. 10(b), the average dissolution rates of the alumina fine grains and the alumina agglomerates are 16.09 and 1.15 kg/min, respectively. This is mainly due to the high local alumina content in the feeding zone in short time period, which can cause high mass transfer rate from the alumina fine grains to the molten bath. However, the longer-lasting dissolution process of the alumina agglomerates dominated by low heat transfer rate for remelting the frozen bath shell is a key factor affecting the full dissolution performance of the total alumina particles. More than 5.873 kg alumina particles are completely dissolved and only very few porous alumina agglomerates with about 0.527 kg of undissolved alumina particles are still present in the molten bath at the end of one feeding cycle, which may continue to dissolve into the bath or sink below the cell layer in the next feeding cycles.
Figure 11 illustrates the effects of the feeding amount on the cumulative dissolved alumina mass and the corresponding mass percentage. The dynamic changes of the full alumina dissolution process with different feeding amounts are similar to the results shown in Fig. 10. Obviously, the larger the feeding amount is, the more the cumulative dissolved alumina mass is, with longer dissolution cycle. However, the percentage of the cumulative dissolved alumina mass does not show a gradual increasing trend. In general, the alumina dissolution curves of the simulation results are consistent with the experimental data available in the literatures [9,35,36], as shown in Fig. 11(b). Due to the difference of the different experimental environments in the published literatures and the real industrial cell conditions in this work, there are some errors in the results inevitably, which are acceptable in practical engineering applications. The results also indicate that our simulation results have better compatibility with the experimental data of KOBBELTVED [35]. The results show that the main differences between the other two experimental results [9,36] and the simulation results are the alumina dissolution curves from dissolution time of about 15 s to about 70 s. The simulated percentage is significantly lower than the experimental percentage because of the over prediction of the alumina agglomerates due to the poor dispersion condition (without physical stirring) of the laboratory experiments of YANG et al [11]. On the whole, this proposed model is reasonable and effective.
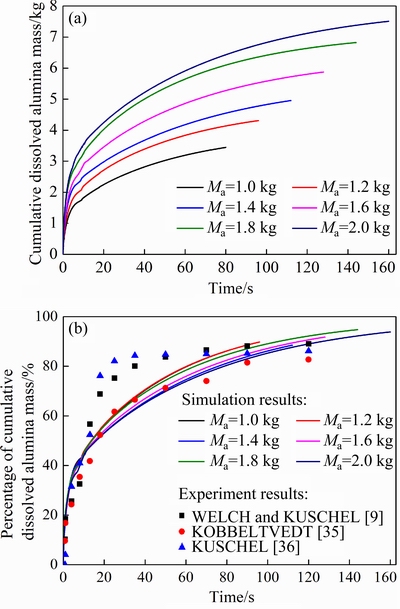
Fig. 11 Cumulative dissolved alumina mass (a) and percentage (b) with different feeding amounts
Figure 12 compares the average dissolution rate and the final percentage of the cumulative dissolved alumina mass with different feeding amounts within one feeding cycle. It can be seen that two parameters increase first and then decrease when the feeding amount increases from 1.0 to 1.4 kg. And they both increase again and finally decrease as the feeding amount increases from 1.4 to 2.0 kg. The result shows that both the average dissolution rate and the final percentage of the cumulative dissolved alumina mass reach a maximum with a feeding amount of 1.8 kg.
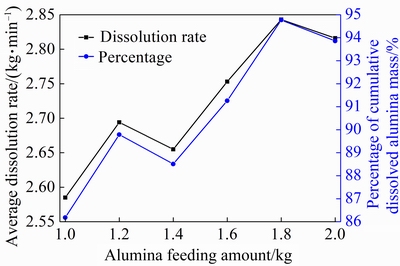
Fig.12 Average dissolution rate and percentage of cumulative dissolved alumina mass with different feeding amounts
Figure 13 depicts the effects of the alumina content on the average dissolution rate and the percentage of cumulative dissolved alumina mass with two different superheats. When the superheat is 7 °C, both of these two parameters decrease first, then increase and decrease again when the alumina content increases from 1 to 6 wt.%. When the superheat is 12 °C, they both gradually decrease with the increase of the alumina content. This implies a different dissolution reaction law with the alumina content for two different superheats. Obviously, increasing superheat can significantly increase the average dissolution rate and the final mass percentage, especially at low alumina contents, and thus significantly improve the alumina dissolution behavior. The heat transfer performance for remelting the frozen bath shell process can be significantly improved with higher superheat, resulting in accelerated dissolution rate.
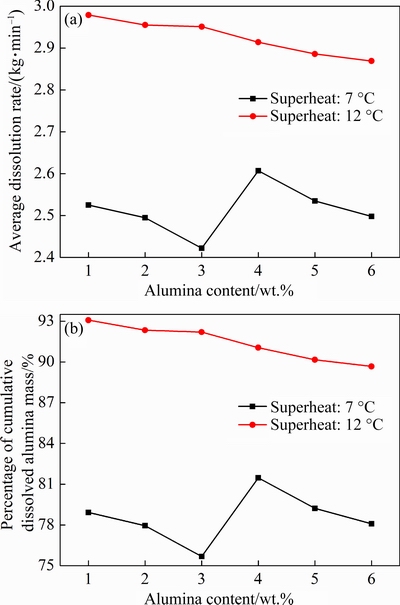
Fig. 13 Average dissolution rate(a) and percentage of cumulative dissolved alumina mass (b) for different alumina contents and superheats
As discussed above in Fig. 9, both Maggand P increase as the alumina content increases for two different superheats, and therefore the average dissolution rate and the final mass percentage should decrease theoretically. However, the calculation results for the superheat of 7 °C do not follow the above expected rules, as shown in Fig. 13. When the alumina content increases from 3 to 4 wt.%, these two parameters show an increase trend. One possible explanation for this is that the change regular of the number and mass distributions of the alumina agglomerates with 16 different groups for two different superheats is different, as shown in Figs. 7 and 8. Also, the alumina content variation around the feeding zone can influence the dissolution behavior for different superheats. However, there may be other factors that may have an impact on the dissolution process, and further research in this area would be needed.
4 Conclusions
(1) As the alumina agglomerate diameter increases, the number decreases and the mass increases. Both the maximum size and Magg increase with increase of the feeding amount due to the poorer dispersion characteristics.
(2) Both Maggand P increase with increasing alumina content, and decrease with increasing superheat. The larger feeding amount, lower superheat and higher alumina content can potentially enhance the possibility of the agglomerate formation, especially for increasing feeding amount.
(3) The full alumina dissolution process includes a fast stage and a slow stage with an average dissolution rate of 17.24 kg/min and 1.53 kg/min for a total feeding amount of 6.4 kg and a superheat of 12 °C, respectively. About 50% (mass percentage) of the total alumina particles have dissolved within the fast dissolution stage of about 10 s. The slow dissolution characteristics of the alumina agglomerates play a dominant role in the full dissolution performance of the total alumina particles.
(4) Both the average dissolution rate and the final percentage of the cumulative dissolved alumina mass reach a maximum with a feeding amount of 1.8 kg for a superheat of 12 °C. Larger superheat can significantly promote the alumina dissolution process, especially at low alumina contents. Compared with the data available in the literatures, the improved CFD approach is provento be effective.
Acknowledgments
Theauthorsaregratefulforthefinancialsupportsfromthe National Natural Science Foundation of China(No. 51704126), the Natural Science Foundation of Jiangsu Province, China (No. BK20170551), Jiangsu Planned Projects for Postdoctoral Research Funds, China (No. 2019K046).
References
[1] Lavoie P, Taylor M P, Metson J B. A review of alumina feeding and dissolution factors in aluminum reduction cells [J]. Metallurgical and Materials Transactions B, 2016, 47: 1-7.
[2] Rolseth S, Hovland R, Kobbeltvedt O. Alumina agglomeration and dissolution in cryolite melts [C]//MANNWEILER U. Light Metals. San Francisco, PA: TMS, 1994: 351-357.
[3] Haverkamp R G, Welch B J. Modelling the dissolution of alumina powder in cryolite[J]. Chemical Engineering and Processing, 1998, 37(6): 177-187.
[4] FINI M F, Landry J R, Soucy G, Désilets M, Pelletier P, Rivoaland L, Lombard D. Sludge formation in Hall–Héroult cells: Drawbacks and significant parameters [J]. Mineral Processing and Extractive Metallurgy Review, 2020, 41(1): 59-74.
[5] KUSCHEL G I, WELCH B J. Further studies of alumina dissolution under conditions similar to cell operation [C]//ELWIN R. Light Metals. New Orleans, CA: TMS, 1991: 112-118.
[6] YANG You-jian, GAO Bing-liang, WANG Zhao-wen, SHI Zhong-ning, HU Xian-wei. Effect of physiochemical properties and bath chemistry on alumina dissolution rate in cryolite electrolyte [J]. JOM, 2015, 67(5): 973-983.
[7] Walker D I, Utigard T A, Taylor M P. Alumina agglomerates in aluminum smelters [C]//EVANS J W. Light Metals. Las Vegas, NV: TMS, 1995: 425–434.
[8] QIU Zhu-xian, YANG Zhen-hai, GAO Bing-liang, XU Ning, LIU Yao-kuan. Dissolution of alumina in molten cryolite (A video recording study) [C]//ECKERT C E. Light Metals. San Diego, CA: TMS, 1999: 467-471.
[9] Welch B J, Kuschel G I. Crust and alumina powder dissolution in aluminum smelting electrolytes [J] JOM, 2007, 59(5): 50-54.
[10] Kaszás C, Kiss L I, Poncsák S, GUERARD S, BILODEAU J F. Spreading of alumina and raft formation on the surface of cryolitic bath [C]//RATVIK A P. Light Metals. San Diego, CA: TMS, 2017: 473-478.
[11] YANG You-jian, GAO Bing-liang, WANG Zhao-wen, SHI Zhong-ning, HU Xian-wei. The formation and dissolution of crust upon alumina addition into cryolite electrolyte [J]. JOM, 2015, 67(9): 2170-2180.
[12] YANG You-jian, LI You-cai, HUANG Yi-peng, GAO Bing-liang, HU Xian-wei, WANG Zhao-wen, TAO Wen-ju, LIU Feng-guo, SHI Zhong-ning, YU Jian-yu. Formation and dissolution of crust upon alumina addition into cryolite electrolyte (II) [J]. JOM, 2019, 71(2): 485-491.
[13] Gylver S E, Omdahl N H, R?rvik S, Hansen I, Nautnes A, Neverdal S N, Einarsrud K E. The micro-and macrostructure of alumina rafts [C]//CHESONIS C. Light Metals. Warrendale, PA: TMS, 2019: 689-696.
[14] Gylver S E, Solheim A, Gudbrandsen H, Follo ? H, Einarsrud K E. Lab scale experiments on alumina raft formation [C]//TOMSETT A. Light Metals. Warrendale, PA: TMS, 2020: 659-663.
[15] Raymond V D, Kiss L I, Poncsak S, Chartrand P, Bilodeau J, Guérard S. Modelling the behavior of alumina agglomerate in the Hall-Héroult process [C]//GRANDFIELD J. Light Metals. San Diego, PA: TMS, 2014: 603-608.
[16] Kaszás C, Kiss L I, Guérard S, Guérard S, Bilodeau J F. Behavior of powders on the surface of a liquid [C]//MARGARET H. Light Metals. Orlando, CA: TMS, 2015: 639-642.
[17] Feng Y Q, Cooksey M A, Schwarz M P. CFD modeling of alumina mixing in aluminium reduction cells [C]//LINDSAY S J. Light Metals. San Diego, CA: TMS, 2011: 543-548.
[18] ZHANG Hong-liang, YANG Shuai, ZHANG He-hui, LI Jie, XU Yu-jie. Numerical simulation of alumina-mixing process with a multicomponent flow model coupled with electromagnetic forces in aluminum reduction cells [J]. JOM, 2014, 66(7): 1210-1217.
[19] Benoit B, Thomas F, Steeve R, Rappaz J, Flueck M, Picasso M. Alumina dissolution modeling in aluminium electrolysis cell considering MHD driven convection and thermal impact[C]//Williams E. Light Metals. Nashville, CA: TMS, 2016: 315-319.
[20] DING Pei-lin, WANG Heng, HUANG Jun, WANG Zi-qian, CAO Bin. Effect of feeding in aluminum reduction cell on electrolyte temperature [J]. The Chinese Journal of Nonferrous Metals, 2016, 26(2): 430-438. (in Chinese)
[21] ZHANG Hong-liang, YANG Shuai, LI Jie. Relationship between alumina mixing characteristics and feeder configurations in aluminum reduction cells [J]. Transactions of Nonferrous Metals Society of China, 2017, 27(11): 2512-2520.
[22] LIU Xiao-zhen, YANG You-jian, WANG Zhao-wen, TAO Wen-ju,LI Tuo-fu, ZHAO Zhi-bin. CFD modeling of alumina diffusion and distribution in aluminum smelting cells [J]. JOM, 2019, 71(2): 764-771.
[23] ZHAN Shui-qing, LI Mao, ZHOU Jie-min, YANG Jian-hong, ZHOU Yi-wen. CFD simulation of dissolution process of alumina in an aluminum reduction cell with two-particle phase population balance model [J]. Applied Thermal Engineering, 2014, 73(1): 803-816.
[24] ZHAN Shui-qing, LI Mao, ZHOU Jie-min, ZHOU Yi-wen, YANG Jian-hong. Numerical simulation of alumina concentration distribution in melts of aluminum reduction cells [J]. The Chinese Journal of Nonferrous Metals, 2014, 24(10): 2658-2667. (in Chinese)
[25] Einarsrud K E, Gylver S E, Manger E. CFD modelling of alumina feeding [C]//MARTIN O. Light Metals. Orlando, PA: TMS, 2018: 557-564.
[26] LI Mao, GAO Yu-ting, BAI Xiao, LI Yuan, HOU Wen-yuan, WANG Yu-jie. Simulation of alumina particle dissolution in 300 kA aluminum electrolytic cell [J]. The Chinese Journal of Nonferrous Metals, 2017, 27(8): 1738-1747. (in Chinese)
[27] HOU Wen-yuan, LI He-song, LI Mao, ZHANG Bing, WANG Yu-jie, GAO Yu-ting. Multi-physical field coupling numerical investigation of alumina dissolution [J]. Applied Mathematical Modelling, 2019, 67: 588-604.
[28] HOU Wen-yuan, LI He-song, LI Mao, CHENG Ben-jun, FENG Yuan. Effects of electrolysis process parameters on alumina dissolution and their optimization [J]. Transactions of Nonferrous Metals Society of China, 2020, 30(5): 3390-3403.
[29] LI Si-yun, LI Mao, HOU Wen-yuan, LI He-song, CHENG Ben-jun. Simulation of alumina dissolution and temperature response under different feeding quantities in aluminum reduction cell [J]. Journal of Central South University, 2019, 26(8): 2119-2128.
[30] ZhanShui-qing, Yang Jian-hong, Wang Zhen-tao, ZhaoRui-jie, ZHENG Jun, Wang Jun-feng. CFD simulation of effect of interphase forces and turbulence models on gas–liquid two-phase flows in non-industrial aluminum electrolysis cells [J]. JOM, 2017, 69(9): 1589-1599.
[31] ZhanShui-qing, Wang Zhen-tao, Yang Jian-hong, ZhaoRui-jie, Li Chang-feng, Wang Jun-feng, ZhouJie-min. 3D numerical simulations of gas-liquid two-phase flows in aluminum electrolysis cells with the coupled model of computational fluid dynamics-population balance model [J].Industrial& Engineering Chemistry Research, 2017, 56(30): 8649-8662.
[32] ZHANG Jia-qi. Principal electrolysis processes and corresponding prediction system for aluminum electrolysis cells based on mathematical models [D]. Changsha: Central South University, 2011. (in Chinese)
[33] Walker D. Alumina in aluminium smelting and its behaviour after addition to cryolite-based electrolytes[D]. Toronto: University of Toronto, 1993.
[34] Peter N. Evolution of alpha phase alumina in agglomerates upon addition to cryolitic melts [D].Trondheim: Norwegian University of Science and Technology, 2002.
[35] Kobbeltvedt O. Dissolution kinetics for alumina in cryolite melts and distribution of alumina in the electrolyte of industrial aluminium cells [D].Trondheim: Norwegian University of Science and Technology, 1997.
[36] Kuschel G I. The effect of alumina properties and smelter operating conditions on the dissolution behaviour of alumina [D]. Auckland: University of Auckland, 1990.
考虑结块形成的铝电解氧化铝颗粒溶解全过程数值模拟
詹水清1,江明镅1,王军锋1,杨建红2
1. 江苏大学 能源与动力工程学院,镇江212013;
2. 江苏大学 材料科学与工程学院,镇江212013
摘 要:基于前期研究结果,改进和建立铝电解槽内氧化铝颗粒溶解全过程的数值计算模型,重点考虑氧化铝结块形成的影响。结果表明,氧化铝结块总质量和最大尺寸主要依赖于氧化铝的下料量,且随着下料量的增加而增大。电解质过热度越高,更容易抑制结块的形成,从而促进氧化铝颗粒溶解行为。氧化铝颗粒溶解全过程主要分为快速溶解阶段和缓慢溶解阶段,两者平均溶解速率分别为17.24 kg/min和1.53 kg/min。快速溶解阶段溶解时间大概持续10 s,且约有质量分数为50%的氧化铝颗粒(几乎全部为扩散特性好的氧化铝细颗粒)完全溶解。当下料量为1.8 kg、过热度为12 °C时,平均溶解速率和累计溶解质量百分数均达到最大值。氧化铝结块形成和缓慢溶解行为在氧化铝颗粒溶解全过程中起到主导作用。
关键词:铝电解;氧化铝溶解;结块形成;理论建模;数值模拟
(Edited by Bing YANG)
1003-6326/  2021 The Nonferrous Metals Society of China. Published by Elsevier Ltd & Science Press
Abstract:The full alumina dissolution process in aluminum electrolysis cells was investigated using an improved computational fluid dynamics (CFD) model based on the previous researches by consideration of agglomerate formation. The results show that the total mass of alumina agglomerate and its maximum size are mainly dependent on the feeding amount and increase with increasing it. Higher superheat can effectively inhibit the agglomerate formation and thus promote the full alumina dissolution behavior. The full alumina dissolution process mainly includes a fast stage and a slow stage, with an average dissolution rate of 17.24 kg/min and 1.53 kg/min, respectively. About 50% (mass percentage) of the total alumina particles, almost all of which are the well-dispersed alumina fine grains, dissolve within the fast dissolution stage of about 10 s. The maximum values of the average dissolution rate and final percentage of the cumulative dissolved alumina mass are obtained with a feeding amount of 1.8 kg for a superheat of 12 °C. The formation of the alumina agglomerates and slow dissolution characteristics play a dominant role in the full dissolution of alumina particles.