Trans. Nonferrous Met. Soc. China 31(2021) 3356-3369
Quenching sensitivity and heterogeneous precipitation behavior of AA7136 alloy
Zhi-min MA1,2,3, Yong ZHANG1, Sheng-dan LIU1,3, Yun-lai DENG1,3, Xin-ming ZHANG1,3
1. School of Materials Science and Engineering, Central South University, Changsha 410083, China;
2. Baotou Vocational & Technical College, Baotou 014030, China;
3. Key Laboratory of Non-ferrous Metals Materials Science and Engineering, Ministry of Education, Central South University, Changsha 410083, China
Received 11July 2021; accepted 26October 2021
Abstract:
he quenching sensitivity of AA7136 alloy was investigated by time-temperature-property (TTP) diagrams, and the heterogeneous precipitation behavior during isothermal holding was investigated using scanning electron microscopy, scanning transmission electron microscopy and high resolution transmission electron microscopy. Based on 99.5% TTP diagram, the nose temperature is determined to be about 346 °C with the transformation time of about 0.245 s. The precipitation of η (MgZn2), T (Al2Zn3Mg3), S (Al2CuMg) or Cu-Zn-rich Y phases can be found depending on isothermal holding temperature and time, and it is described in a time-temperature-precipitation diagram. The size and area fraction of isothermal holding induced phase particles increase, which results in the decrease of hardness of samples after aging. The quantitative contribution to loss of hardness bygrain boundaries/subgrain boundaries and dispersoids in the matrix is discussed based on the amount of heterogeneous precipitation related to them.
Key words:
AA7136 alloy; quenching sensitivity; time-temperature-property diagrams; heterogeneous precipitation;
1 Introduction
With the development of the aerospace and vehicle industry, high strength 7xxx series (Al-Zn-Mg-Cu) aluminum alloys tend to be manufactured as semi-products with large section such as thick plates to avoid any welding and jointing defaults [1,2]. In the production of these plates, solution heat treatment, quenching and aging are critical steps. During quenching, the center part of thick plates generally experiences a significant drop of cooling rate; as a result, mechanical properties and corrosion resistance tend to decrease after subsequent aging [3-5]. This phenomenon is known as quenching sensitivity.
There are a lot of ways to evaluate quenching sensitivity, and time-temperature-properties (TTP) diagram is an effective one. FINK and WILEY [6] firstly developed the TTP diagrams for AA7075-T6 alloy using an interrupted-quench method, and the TTP diagrams exhibit a “C” shape. TTP diagrams can be used to compare quenching sensitivity of different alloys. For example, LIU et al [7] evaluated quenching sensitivity of some typical 7xxx aluminum alloys using TTP diagrams. They found that AA7075, AA7175 and AA7055 alloys are the most quenching sensitive alloys, and AA7085 alloy is the least quenching sensitive alloy.Moreover, TTP diagrams can be used to determine critical quenching rate required for high properties, and to predict properties after different quenchingpaths using quench factor analysis (QFA) method. For example, based on the TTP diagrams of the AA7075-T6 alloy, FINKand WILEY [6] found that the critical quenching rate for obtaining the maximum strength and resistance to corrosion is about 427 °C/s for this alloy. DOLAN and ROBINSON [8] developed the TTP diagram for AA7175-T73 alloy and used QFA method to analyze the change rate of properties in a time-temperature coordinate.They found that after solution heat treatment at 475 °C for 40 min, the sample was cooled to 425 °C with a rate of 1 °C/s and then quenched in room temperature water, there was no loss of the hardness after aging but the residual stress was decreased by 15%. According to these investigations, TTP diagrams are different for different alloys, because chemical compositions have significant effects on the heterogeneous precipitation during slow quenching. Therefore, it is essential to investigate both TTP diagrams and heterogeneous precipitation so as to deeply understand quenching sensitivity of 7xxx aluminum alloys.
It is known that heterogeneous precipitation is very complicated, and η(MgZn2), S(Al2CuMg), T (Al2Zn3Mg3) and Cu-Zn-rich Y phase particles may appear depending on chemical compositions, microstructure and quenching conditions [9-11]. For example, GODARD et al [9] found that equilibrium η phase forms during isothermal holding in the 400-200 °Cdomain, while S′and T phases precipitate in the temperature range of 300-200 °C in AA7010 alloy. TIRYAKIO?LUet al [12] found that equilibriumη phase and S phase nucleate at grain boundaries (GBs) in AA7010 alloy during isothermal holding at 425 °C up to 1000 s. When holding at 325 °C for 33 s, equilibrium η phase nucleates at GBs, subgrain boundaries (SGBs) as well as dispersoid bands. When holding at 275 °C and below, a large amount of equilibrium η phase exists within grains. In AA7055 alloy, equilibriumη phase appears at GBs when isothermal holding at 415 °C for 60 s, and appears in the matrix when holding at 355 °C for 10 s, and S phase appears in the matrix when holding at 235 °C for 570 s [13]. XIE et al [14] found that in AA7097 alloy, η phase mainly forms at GBs when isothermal holding at 410 °C and 230°C for 30 s, and appears at GBs and within grains at 320 °C for 30 s. STARINK et al [10] found that in AA7150 alloy, η phase forms in the temperature range of 350-250 °C, and Y phase forms within grains in the 250-150 °C domain. Therefore, more efforts are desirable to be made to understand this issue.
In the published TTP diagrams of 7xxx series aluminum alloys, Zn content in the alloys is less than 8.5 wt.%. In order to obtain high mechanical properties, Zn content of 7xxx series aluminum alloys has been continuously increased [15,16]. AA7136 alloy has very high Zn content (about 9.1 wt.%), which is expected to increase quenching sensitivity and lead to different heterogeneous precipitation behaviors. The purpose of current work is to develop TTP diagrams of an extruded plate of AA7136 alloy, and to investigate heterogeneous precipitation behaviors via detailed characterization by scanning electron microscopy, high resolution transmission electron microscopy and scanning transmission electron microscopy. This can help to better understand quenching sensitivity of Al-Zn-Mg-Cu alloys,and to develop alloys with low quenching sensitivity.
2 Experimental
An AA7136 alloy extruded plate with a thickness of 16 mm was used for investigation, and the chemical compositions are (wt.%): Al-9.10Zn-2.18Mg-2.07Cu-0.13Zr, Fe<0.15, Si<0.12.Samples with a size of 40 mm along transverse direction (TD) × 20 mm along extrusion direction (ED) × 2 mm along normal direction (ND) were prepared.The heat treatment process is shown schematically in Fig. 1. After two-step solution heat treatment at 450 °C for 1.0 h and then at 470 °C for 0.5 h in a salt bath, the samples were immediately transferred to another salt bath with pre-set temperatures (Ti) from 225 to 450 °C, respectively, then immediately quenched into room temperature water after different holding time. Areference sample was quenched directly into room temperature water after solution heat treatment. Finally, all samples were artificially aged at 120 °C for 24 h and then 160 °C for 12 h (T76) in an air furnace.
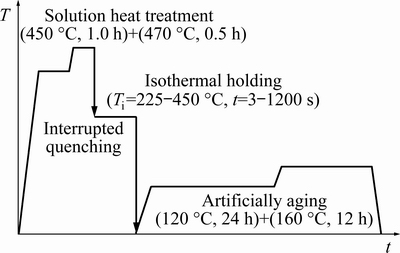
Fig. 1Schematic of heat treatment
Hardness tests were made on an HV-10B hardmeter with a load of 0.5 kg for 10 s, and the average value of five tests for each sample was obtained. The grain structure was examined using ZEISS EVOMA10 scanning electron microscopy (SEM) equipped with an electron back-scatter diffraction (EBSD) detector. The orientation map is shown in Fig. 2, where black lines indicate high angle (>15°) GBs and white lines indicate low angle (2°-15°) GBs. Low angle GBs are usually called SGBs. It can be seen that there are primarily elongated unrecrystallized grains and minor fine recrystallized grains, and those elongated unrecrystallized grains contain subgrains. The precipitation features were examined using ZEISS EVOMA10 scanning electron microscopy (SEM) equipped with energy-dispersive X-ray spectroscopy (EDS), Tecnai G2 F20 transmission electron microscopy (TEM) operated at 200 kV, and Titan G2 60-300 kV scanning transmission electron microscopy (STEM) with the high-angle annular dark-field (HAADF) mode operated at 300 kV. The samples for SEM examination were ground and mechanically polished. Thin foils with a thickness of about 100 μm and a diameter of 3 mm for TEM and STEM examination were prepared and subjected to twin-jet electropolishing in a solution containing 20 vol.% HNO3 and 80 vol.%CH3OH below -25 °C. And the chemical compositions of small secondary phase particles were analyzed with a beam spot of 2 nm on HAADF mode to obtain accurate results.
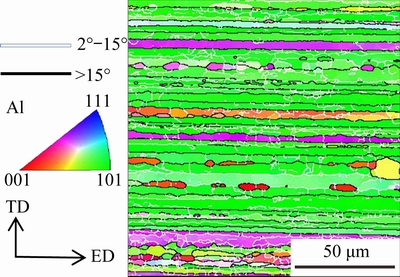
Fig. 2 Grain orientation map of aged AA7136 alloy extruded plate
Thermodynamic calculation of the equilibrium phase and simulation of continuous cooling transformation (CCT) curves were performed to help understanding heterogeneous precipitation. Phase diagram based on AA7136 alloy composition was calculated using the THERMO-CALC software and an aluminum database, and CCT curves were obtained using JMatPro 7.0 software.
3 Results and discussion
3.1 Hardness
The hardness for the aged reference sample is HV0.5 (187±5). After isothermal holding, the hardness of the aged samples tends to decrease. Figure 3(a) shows the isothermal hardness curves of the aged samples subjected to isothermal holding at 420, 330 and 240 °C for different time. It is shown that the hardness decreases slowly with increasing holding time at 420 °C. At 330 °C, the hardness decreases slowly within about 60 s and then decreases rapidly with the further increase of time.At 240 °C, the hardness decreases slowly until 120 s, andthendecreases rapidly. Isothermal holding at 330 °C results in the lowest hardness. From 3 to 120 s, isothermal holding at 240 °C leads to the highest hardness. After 120 s, the hardness is always the highest for aged samples subjected to isothermal holding at 420 °C.
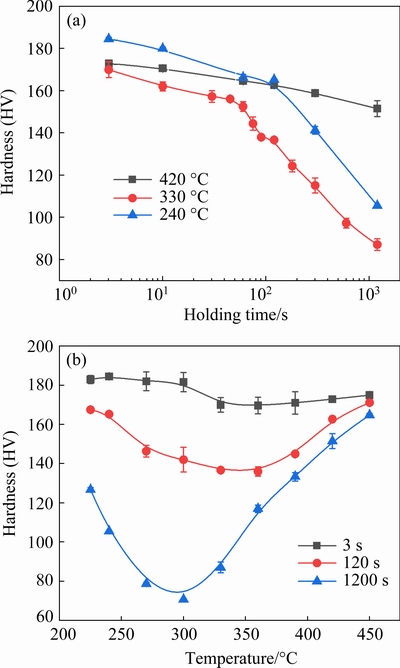
Fig.3 Isothermal hardness (a) and isochronous hardness (b) curves of aged samples
Figure 3(b) shows the isochronous hardness curves at different holding temperatures for 3, 120 and 1200 s, respectively. For 3 s, the hardness exhibits little change from 230 to 300 °C, decreases obviously at 330 °C, and then keeps almost constant up to 390 °C, and finally increases slightly at high temperatures. For 120 and 1200 s, the curves exhibit a “U” shape, i.e., with the increase of holding temperature the hardness decreases rapidly to a minimum value and then increases significantly at high temperatures. The temperature for the minimum hardness is about 360 °C for 120 s, but decreases to be about 300 °C for 1200 s.
3.2 TTP diagram
Based on the hardness data, the time to achieve 90.0% of maximum hardness (HV0.5 187) is given in Fig. 4 and used to construct TTP diagram. It is known that TTP diagram can be described mathematically by [7,17,18]
 (1)
(1)
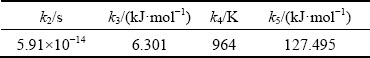
whereC(T) is the critical time for precipitating a constant amount of solutes;k1 is the natural logarithm of the fraction untransformed during quenching; k2is the constant related to the reciprocal of the number of nucleation sites (s); k3 is the constant related to the energyrequired toform a nucleus (J/mol);k4 is the constant related to the solvus temperature (K);k5 is the constant related to the activation energy for diffusion (J/mol); Ris the gas constant (8.314 J/(mol·K));Tis the thermodynamic temperature (K). Based on the measured results, these coefficients were determined by nonlinear least squares fitting as shown in Table 1, and then the TTP diagram for 99.5% of maximum hardness was created and plotted in Fig. 4.
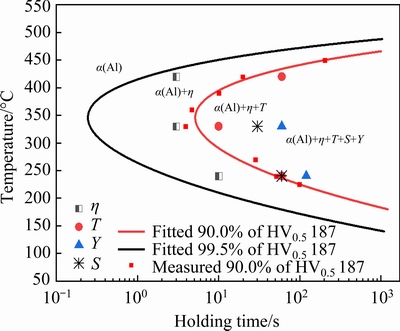
Fig. 4 TTP diagrams and precipitation behavior of different phases during isothermal holding
Table 1Coefficients for TTP diagram of AA7136-T76 alloy
As expected, the TTP diagrams exhibit C-shape, i.e., the hardness decreases rapidly in the intermediate temperature range but slowly at high or low temperatures. The supersaturated solid solution decomposes during isothermal holding, and heterogeneous precipitation occurs [7,12]. This leads to few solutes available for strengthening precipitates during subsequent aging, and consequently, hardness decreases. At high temperatures, the supersaturation is low and the driving force is small; as a result, precipitation occurs slowly in spite of high diffusion rate of solute atoms. At low temperatures, supersaturation increases significantly, leading to high driving force for precipitation; however, the diffusion rate of solute atoms is low, as a result, precipitation occurs slowly as well. Consequently, hardness decreases slowly after holding at these temperatures. At intermediate temperatures, both the supersaturation and the diffusion rate are high, leading to rapid heterogeneous precipitation and therefore rapid drop of hardness.
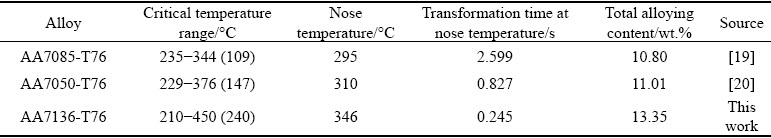
Moreover, it is seen from 99.5% TTP diagram that the nose temperature is about 346 °C with the corresponding transformation time of about 0.245 s. Table 2 gives the critical temperature range with time of 10 s, the nose temperature and corresponding transformation time of TTP diagrams of AA7050-T76, AA7085-T76 from literatures and the studied AA7136-T76 alloy in this work.
The total amounts of alloying elements of these alloys are also given so as to understand different features of the TTP diagrams. AA7050 and AA7085 alloys are two typical low quenching sensitive alloys [7]. It is seen that the critical temperature range and the nose temperature increase in the order of AA7085, AA7050 and AA7136 alloys, while the transformation time at nose temperature increase in the order of AA7136, AA7050 and AA7085 alloys, indicating that quenching sensitivity is the highest for AA7136 alloy, and the lowest for AA7085 alloy. This is likely because of the different amounts of alloying elements. It is known that a higher amount of alloying elements can generally result in higher supersaturation of solid solution, and therefore higher driving force for precipitation [7,14,21,22]. AA7136 alloy contains the highest amount of alloying elements and therefore exhibits the highest quenching sensitivity. The quenching rate must be higher than about 373 °C/s so as to obtain the highest hardness of AA7136-T76 alloy from Fig. 4, while for AA7050-T76 and AA7085-T76 alloys, the quenching rates are about 130 and 40 °C/s[18,19], respectively.
Table 2 Total alloying content, critical temperature range, nose temperature and corresponding transformation time of AA7085, AA7050 and AA7136 alloys
3.3 Phase diagram and CCT curves
Figure 5 shows vertical section phase diagram based on the studied AA7136 alloy (9.10 wt.%Zn, 2.18 wt.% Mg) composition with variable Cu contents. The red dotted line indicates the position of the studied alloy. The second stage solution heat treatment temperature of the studied alloy is 470 °C, and there is α(Al) phase at this temperature. The α(Al) phase starts to decompose with decreasing temperature. The phase regions appear in the order ofα(Al) + S(Al2CuMg), α(Al) + T(Al2Mg3Zn3)+ S(Al2CuMg), α(Al) + η(MgZn2) + T(Al2Mg3Zn3) + S(Al2CuMg), α(Al) + η(MgZn2) + S(Al2CuMg) + Al3Cu5Zn, α(Al) + η(MgZn2) + S(Al2CuMg), α(Al) + η(MgZn2) + S(Al2CuMg) + Al3Cu5Zn, α(Al) + η(MgZn2) + T(Al2Mg3Zn3) + Al3Cu5Zn with temperature decreasing from 470 °C to room temperature.
In addition, the existence of the secondary phase is also related to quenching rate, as shown by the CCT simulation curves of AA7136 alloy in Fig. 6. It is expected that during the decomposition of the supersaturated solid solution, the precipitation of η phase occurs first, followed by S and T phases at a quenching rate of 10 °C/s. The precipitation of θ phase occurs at very low quenching rates. Unfortunately, due to the lack of Y phase fundamental data, the precipitation of Yphase cannot be shown.
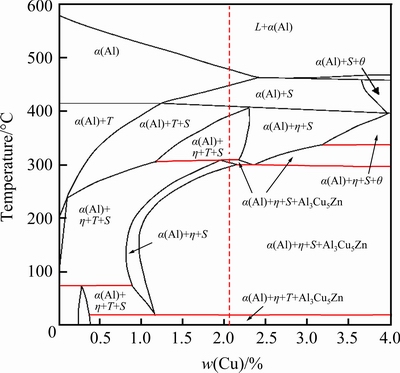
Fig. 5 Vertical section phase diagram based on AA7136 alloy composition with variable Cu contents (θ: Al2Cu)
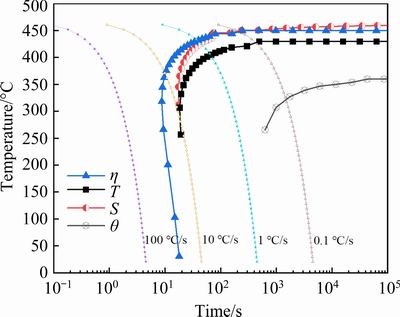
Fig. 6 CCT curves of AA7136 alloy
3.4 Microstructure
Based on TTP diagrams in Fig. 4, the aged reference sample, and the aged samples after isothermal holding at 240, 330 and 420 °C for different time were selected for microstructure examination so as to understand heterogeneous precipitation.
3.4.1 Aged reference sample
Figure7 shows a typical SEM image of the aged reference sample. There are only some bright secondary phase particles with sizes of about 1.6-9.1 μm. EDS results indicate that they contain (at.%): Cu 5.46-15.60, Fe 2.98-8.2, Al 75.12-87.45, and minor Zn (1.17-2.56). Therefore, these coarse particles are Al7Cu2Fe phase which often appear in Al-Zn-Mg-Cualloys [23,24]. These particles generally form during solidification, and during extrusion, they can be crashed and tend to distribute along the extruded direction. The subsequent solution heat treatment, quenching and aging process have little effect on their sizes and morphology [22,23].
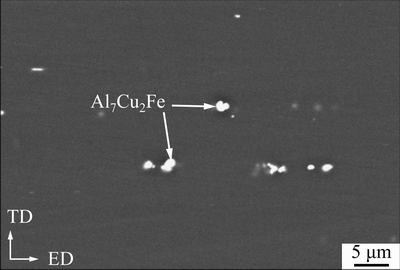
Fig. 7 Typical SEM image of aged reference sample
Figure 8(a) gives a typical HAADF-STEM image. It is seen that both GBs and SGBs are covered by bright aging-induced η phase particles.η phase particles at GBs are about (83.6±13.0) nm, larger than that of about (34.8±11.4) nm at SGBs. Precipitates-free zone (PFZ) near GBs is about (57.4±6.8) nm in width, larger than that of about (42.3±4.1) nm near SGBs. In the matrix, there is a high density of fine precipitates. From <011>Al selected area electron diffraction (SAED) in Fig. 8(b), the diffraction spots at 1/3 and 2/3 are from η′ phase and the diffraction spots outside are from η phase. This indicates that those fine precipitates are primarily aging-inducedη′and η strengthening phases, and they make contribution to high hardness of the reference sample. Moreover, clear diffraction spots at 1/2 are visible, they are from Al3Zr dispersoids[25]. It is known that Al3Zr dispersoids can pin grain boundaries and therefore inhibit recrystallization effectively [26], as a result, partial recrystallization occurred as shown in Fig. 2.
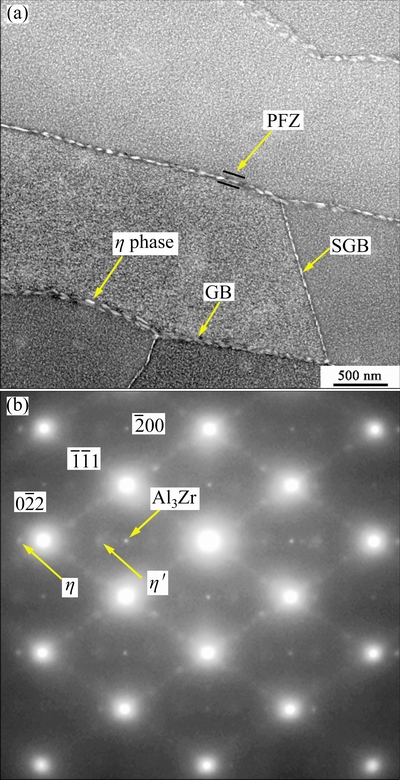
Fig. 8 HAADF-STEM image of aged reference sample (a)and <011>Al SAED of precipitates in interior of grain (b)
3.4.2 Aged sample after holding at 330 °C
During holding at 330 °C, the supersaturated solid solution decomposed rapidly, and therefore, in addition to coarse Al7Cu2Fe phase, many bright secondary phase particles are observed; these particles will be called isothermal-holding-induced (IHI) phase hereafter. The IHI phase tends to form first at GBs, and then at SGBs and on dispersoids in the matrix; their number and sizes increase with the increase of holding time. Figures 9(a) and (b) show typical SEM images of the aged samples after isothermal holding for 3 and 300 s, respectively.Comparing Fig. 7 and Fig. 9(a), in the aged sample after holding for 3 s, some bright IHI phase particles are observed to be located at GBs, revealing the shape of grains, as descried in Fig. 2.It is difficult to see IHI phase in the matrix. In the aged sample after isothermal holding for 300 s, it is seen that there are a large number of bright IHI phase particles at GBs, SGBs and in the matrix (Fig. 9(b)). The particles at GBs are larger than at SGBs. It is known that GBs have higher interfacial energy than SGBs [13,27], and therefore, IHI phase tends to nucleate earlier at GBs; moreover, solutes along GBs can generally diffuse faster than along SGBs. Consequently, after nucleation IHI phase at GBs can grow rapidly during isothermal holding and finally exhibits large sizes. In the interior of some grains, there are a high density of IHI phase particles, and they exhibit a strip distribution along the extruded direction, this is because these IHI phase particles nucleate and grow up on the dispersoids distributed in strips [9,28]. While in some grains, there are few IHI phase particles, but their sizes are larger.
In order to identify IHI phase, the samples were further examined by means of TEM and STEM.
After holding for 3 s, there are only a few η phase particles in the recrystallized grains, and most of them exhibit a rod-like shape, as seenin Fig. 10(a); appearance of the black holes is due to loss of η phase during TEM sample preparation. Most η phase particles are associated with Al3Zr dispersoids(see the inset in Fig. 10(a)); the round particle is Al3Zr dispersoid and the rod-like one is η phase; this is a common phenomenon in Zr-containing Al-Zn-M-Cu alloys during slow quenching [9,10]. After holding for 10 s, the amount of IHI phase increasessignificantly (see Fig. 10(b)); apart from bright rod-like η phase, thereare some hexagon-like particles with a dark contrast, and they are known to be T phase particles [28,29].
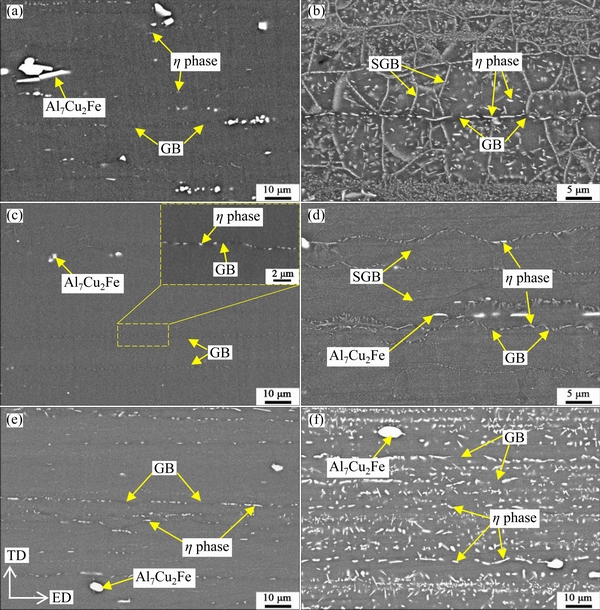
Fig. 9 SEM images of different aged samples holding at 330 °C for 3 s (a) and 300 s(b), holding at 240 °C for 3 s(c) and 300 s(d), and holding at 420 °C for 10 s (e) and 300 s(f)
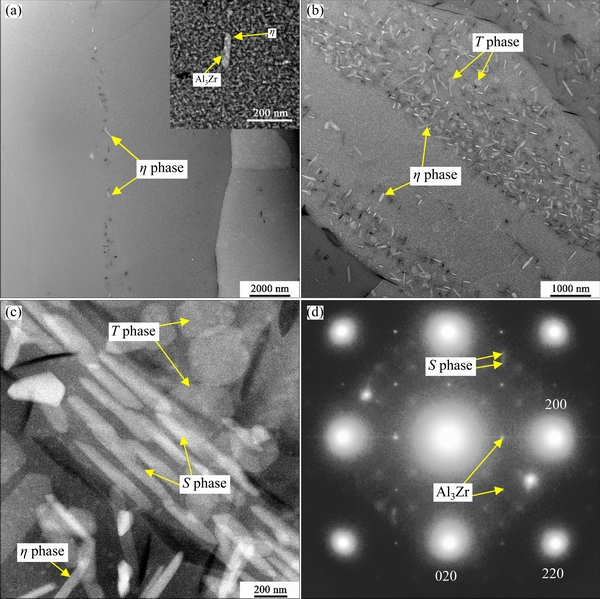
Fig. 10 HAADF-STEM images of aged samples after isothermal holding at 330 °C for 3 s (a), 10 s (b)and 30 s(c), and <001>Al SAED of lath-like S phase(d)
After holding for 30 s, some lath-like particles were also observed inside grains (see Fig. 10(c)); these particles have a length of (533.6±86.6) nm and width of (83.2±7.3) nm. EDS test results show that they contain (at.%) Al 85.3±2.8, Zn 6.4±1.2, Mg 3.8±0.8 and Cu 3.6±0.4, and Mg/Cu ratio is close to 1. The <001>Al SAED of these particles is given in Fig. 10(d), and the clear spots marked by arrows are from S phase [9,29,30]. Therefore, they are S phase particles, and some T phase particles, as shown in Fig. 10(c).
After holding for a longer time, e.g., 60 s, Y phase particles were found (see Fig. 11) for typical HAADF-STEM and high resolution transmission electron microscopy (HRTEM) images. The streaks along  direction in the corresponding FFT confirms the presence of Y phase. Y phase exhibits a platelet-shape [10,28,31], and has a high ratio of diameter to thickness.
The Y phase in Fig. 11(b) has a diameter of 1338.0 nm and a thickness of 2.0 nm with the ratio of diameter to thickness of 669. As expected, Y phase tends to be distributed in the interior of subgrains. It is known that the density of dislocations is generally higher in the subgrains than in the recrystallized grains [29], and this is favorable for the nucleation and growth of Yphase[11,29]. Al3Zr dispersoids can pin dislocations, and therefore sometimes Y phase can be seen to be associated with Al3Zr dispersoids(see Fig. 11(b)). Some T phase particles can be seen at SGBs from Fig. 11(a), and this phenomenon was observed in a slowly-cooled AA7055 alloy [29].
3.4.3 Aged sample after holding at 240 °C
In the aged samples after holding at 240 °C, η phase particles were first observed at GBs (see Fig. 9(c)), and therefore the shape of grains can be seen. With the increase of holding time, many phase particles began to nucleate at SGBs and in the matrix; and not only η phase but also T phase can be observed (see Fig. 12). The bright rod-like particles are η phase, and those hexagon-like particles are T phase. These η phase particles have a length of (116.6±40.6) nm and width of (24.6±7.7) nm, and T phase particles have a diameter of (102.3±37.2) nm.
As expected, these particles tend to be associated with round Al3Zr dispersoids(see Fig. 12(b)). They have little strengthening effect because of their large sizes; moreover, it is seen that near these particles, there are few strengthening precipitates. As a result, the hardness decreases as shown in Fig. 3. After holding for a long time, S phase and Y phase can be found, and their features are similar to those in the aged sample holding at 330 °C. The IHI phase particles at GBs and SGBs grow apparently, as a result, grain structure is revealed clearly (see Fig. 9(d)).
3.4.4 Aged sample after holding at 420 °C
In the aged samples after holding at 420 °C, η phase and T phase were detected. It was difficult to find S phase and Y phase possibly because they didnot form or their number is too small. IHI phase particles were observed first at GBs, and then ondispersoids in the matrix; there were few phase particles at SGBs. As an example, Figs. 9(e, f) showSEM images of aged samples after holding for 10 and 300 s, respectively. It is seen from Fig. 9(e) that after holding for 10 s many bright secondary phase particles are located at GBs, revealing the shape of grains; there are also some smaller bright particles in the matrix, and they exhibit a strip distribution along the extruded direction. With the increase of holding time, the amount and sizes of these particles increase (see Fig. 9(f)). These particles are about (2851.0±1430.0) nm at GBs, and about (828.6±137.6) nm in the matrix. Based on Figs. 9(b, d, f), it is seen that for the same holding time of 300 s, the size of IHI phase particles is the largest in the sample held at 420 °C, intermediate at 330 °C and the smallest at 240 °C.
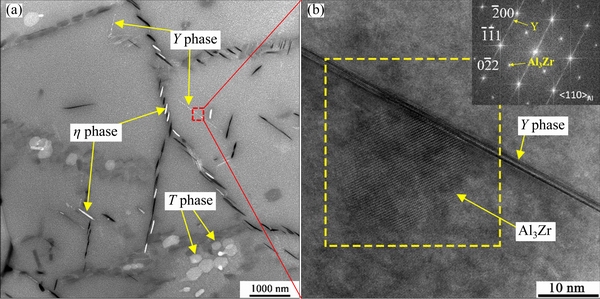
Fig. 11 HAADF-STEM image of aged sample after holding at 330 °C for 60 s(a), and HRTEM and corresponding FFT images (b) of region in box in (a)
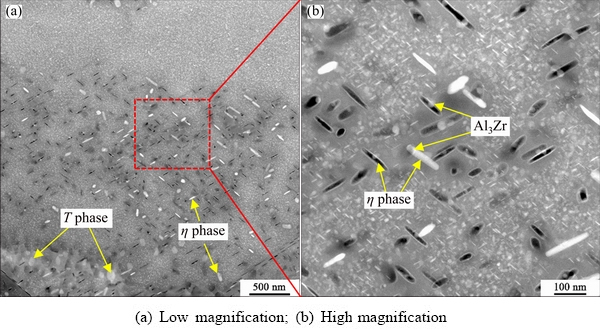
Fig. 12 HAADF-STEM images of aged sample after holding at 240 °C for 60s
3.5 Discussion
Based on the above results, the approximate time to detect different IHI phase particles at different temperatures is described in Fig. 4 together with 90.0% and 99.5% TTP curves. It is seen that for all temperatures, η phase forms first during isothermal holding, and this is in accordance with the simulated results in Fig. 6. Generally, η phase mainly contains Zn and Mg. It is known that Zn and Mg atoms tend to segregate at GBs with high interfacial energy [13,32], which is favorable for nucleation of η phase; and then, η phase can grow rapidly because GBs can act as fast diffusion channels for Zn and Mg solutes. In the matrix, as shown in Fig. 10(a), η phase also forms first because of the higher diffusion rate of Zn and Mg atoms than Cu atoms [33-35]. The formation of η phase decreases the concentration of Zn and Mg atoms in the surrounding region, leading to the precipitation of T phase with lower Zn content after a prolonged isothermal holding. This can be supported by the fact that T phase particles stay among η phase, as shown in Fig. 10(b) and Fig. 12(a). ZHANG et al [29] found the same phenomenon in a slowly-quenched AA7055 alloy. Therefore, T phase is likely the second particle to form during isothermal holding, which is different from the results in Fig. 6.
Extending the holding time at 420 °C does not result in new phase except η phase and T phase. This is likely because the growth of η phase and T phase consumes a large amount of Zn and Mg atoms and inhibits formation of other phases. At intermediate and low temperatures, however, with the increase of holding time S phase starts to form in local regions, followed by Y phase. It is shown that the dislocations are not distributed uniformly in the matrix [29], and the interaction strength between the dislocations and Zn, Mg and Cu solutes is different [36,37]. As a result, the distribution of Zn, Mg and Cu solutes is not uniform in the matrix; Cu solutes tend to segregate around dislocations because of strong interaction strength with dislocations [29,36,37]. From Fig. 10(c), S phase stays near η phase and T phase, and Y phase tends to stay near SGBs (Fig. 11(a)). In these regions, the concentration of Zn and Mg is low because of the early formation of η phase and T phase, and the concentration of Cu is high. Dislocations are rapid diffusion channels for Cu solutes. Consequently, Cu can combine with Mg and Al to form S phase, or with Zn and Al to form Y phase.
The IHI phase particles are quite large and therefore have little strengthening effect. Meanwhile, the formation of these particles reduces the amount of solutes available for strengthening precipitates during artificial aging. As a result, the hardness decreases after isothermal holding (Fig. 3); however, the shape of hardness curves is different at different temperatures. Therefore, it is essential to understand the contribution of IHI phase to loss of hardness at different temperatures. The total area fraction (An) of IHI phase was obtained using the method by TANG et al [28] and the results are shown in Fig. 13(a). It is seen that the area fraction of IHI phase increases with the increase of holding time, but the shape of the curves is different at different temperatures. The value of An is always the highest at 330 °C. Within about 100 s, the value of An at 240 °C is the lowest, but significantly higher than that at 420 °C after about 100 s. These results are basically in accordance with the change of hardness curves shown in Fig. 3(a).
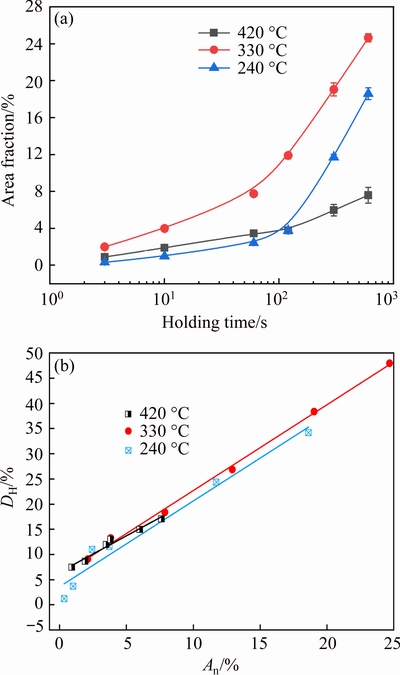
Fig. 13 Change of total area fraction of IHI phase particles with increasing holding time(a), and relationship between DH and An(b)
The hardness reduction rate (DH) due to isothermal holding can be calculated by
 (2)
(2)
whereHR is the hardness value of the aged reference sample, HV0.5 187; His hardness value of the aged samples after holding for different time at a certain temperature. Based on the data in Fig. 3(a), DH was calculated and plotted as a function of An shown in Fig. 13(b). DHincreases linearly with the increase of An, and it is described using Eq. (3):
DH=a+bAn (3)
wherea andb are the fitted coefficients, given in Table 3. The linear correlation coefficients are larger than 0.9669, indicating a good linear relationship between DH andAn. The slope is similar at 240 and 330 °C, and higher than that at 420 °C. This may be related to the location of IHI phase, as supposed by TANG et al [28], who investigated the quantitative contribution to quenching sensitivity by GBs, SGBs and dispersoids in different samples of AA7136 alloy based on the amount of quenching-induced phase associated with them.Using the same method, the area fraction of IHI phase at GBs/SGBs and in the matrix was obtained and the results are shown in Fig. 14(a). For convenience,the area fraction of IHI phase at GBs/SGBs and in the matrix will be called Agb and Am, respectively.
Table 3 Coefficients of Eq. (3) obtained by fitting
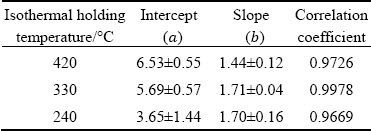
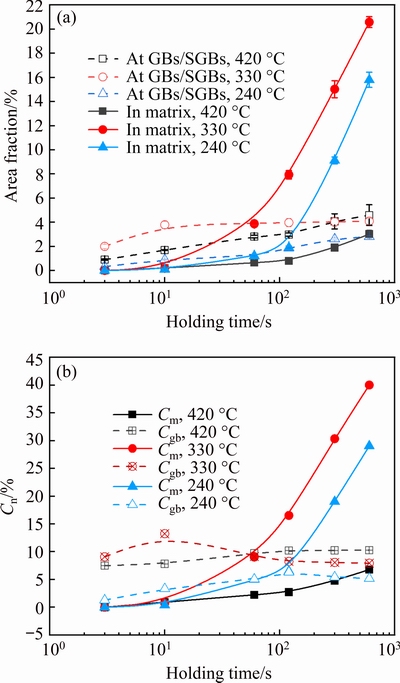
Fig. 14 Area fraction of IHI phase particles at GBs/SGBs, or in matrix(a), and change ofCm and Cgbby different nucleation sites with increasing holding time
It is seen that during the initial holding at all the temperatures, Agbis always higher thanAm, because IHI phase forms first at GBs (Fig. 9). With the increase of holding time, Agbincreases slowly, but Amexhibits a rapid increase after a certain time, which is about 10, 60and 120 s, respectively, for 330, 240 and 420 °C. Extensive precipitation occurs after holding for a longer time (Fig. 9), and therefore,Am starts to be significantly higher than Agbafter about 60 s at 330 °C, and about 100 s at 240 °C. However, during holding at 420 °C, Agb is always higher than Am.
A contribution index(Cn) is used to describe the contribution of IHI phase at GBs/SGBs and in the matrix to loss of hardness, and it is calculated by
Cn=DH(A/An) (4)
whereAis value ofAgb or Am shown in Fig. 14(a), and accordingly, the contribution index is called Cgb and Cm, respectively. A larger Cn value indicates higher contribution to loss of hardness. Based on the data in Fig. 13(b) and Fig. 14(a), the values of Cgb and Cmwere calculated, and the results are shown in Fig. 14(b).
With the increase of holding time at 420 °C, Cgb increases only slightly and exhibits no change after about 100 s, and Cgb is always higher than Cm; therefore, the loss of hardness within about 100 s (Fig. 3(a)) is due to the formation of IHI phase at GBs, and the further loss of hardness is primarily caused by IHI phase in the matrix.
At 330 °C, the loss of hardness is due to the presence of IHI phase at GBs/SGBs within about 60 s because of higher value of Cgb; at about 60 s, the values of Cgb and Cmare almost the same, and therefore, IHI phase at GBs/SGBs and in the matrix make similar contribution to the loss of hardness. After a longer time, Cgb tends to decrease slightly and then exhibits little change, while Cmincreases significantly, and therefore, the further loss of hardness is due to the extensive precipitation in the matrix. The situation is similar at 240 °C as described in Fig. 14(b). It is likely because after isothermal holding for a certain time, the heterogeneous precipitation at GBs/SGBs approaches an equilibrium state, but those IHI phases in the matrix can continue to grow.
4 Conclusions
(1) According to 99.5% TTP diagram of AA7136 alloy, the nose temperature is about 346 °C with transformation time of 0.245 s. At this temperature, the hardness decreases rapidly with increasing holding time due to the rapid precipitation of isothermal holding induced phase.
(2) During isothermal holding at 240, 330 and 420 °C,η phase tends to form first at GBs, and then at SGBs and on the Al3Zr dispersoids.η and T phases can form at 420 °C, while at 330 and 240 °C, in addition to η and T phases, S and Y phases can form. The formation of these phases leads to fewer strengthening precipitates after aging and consequently lower hardness.
(3) The size and area fraction of isothermal holding induced phase increase with the increase of holding time. The hardness reduction rate increases linearly with the increase of the area fraction of isothermal holding induced phase. Within about 60 s at 330 and 240 °C, the loss of hardness is mainly caused by isothermal holding induced precipitation at GBs/SGBs; after 60 s, isothermal holding induced precipitation in the matrix is responsible for the further loss of hardness. At 420 °C, the loss of hardness is mainly due to heterogenous precipitation at GBs/SGBs.
Acknowledgments
The authors are grateful for the financial supports from theNational Key Research and Development Program of China(No. 2016YFB0300901), andthe Scientific Research Project of Inner Mongolia Colleges and Universities, China(No. NJZY21092). The authors would like to thank Dr. Ding-ling YUAN from Light Alloy Research Institute of Central South University who helped in calculating the phase diagram.
References
[1] HIRSCH J. Recent development in aluminum for automotive applications [J]. Transactions of Nonferrous Metals Society of China,2014, 24(7): 1995-2002.
[2] DENG Yun-lai, ZHANG Xin-ming. Development of aluminium and aluminium alloy [J]. The Chinese Journal of Nonferrous Metals, 2018, 29(9): 2115-2141. (in Chinese)
[3] LIU Sheng-dan, ZHANG Meng-han, LI Qun, ZHU Qian-qian, SONG Hui, CAO Ling-fei, COUPER M J. Effect of quenching rate on strengthening behavior of an Al-Zn-Mg-Cu alloy during natural ageing [J]. Materials Science Engineering A, 2020, 793: 139900.
[4] LIM S T, YUN S J, NAM S W. Improved quench sensitivity in modified aluminum alloy 7175 for thick forging applications [J]. Materials Science Engineering A, 2004, 371: 82-90.
[5] MA Zhi-min, LIU Jia, YANG Zhen-shen, LIU Sheng-dan, ZHANG Yong. Effect of cooling rate and grain structure on the exfoliation corrosion susceptibility of AA7136 alloy [J].Materials Characterization, 2020, 168: 110533.
[6] FINK W L, WILEY L A. Quenching of 75S aluminum alloy [J]. Transactions of the American Institute Mining and Metallurgical Engineers, 1948, 175: 414-427.
[7] LIU Sheng-dan, ZHONG Qi-min, ZHANG Yong, LIU Wen-jun, ZHANG Xin-ming, DENG Yun-lai. Investigation of quench sensitivity of high strength Al-Zn-Mg-Cu alloys by time-temperature-properties diagrams [J]. Materials & Design, 2010, 31(6): 3116-3120.
[8] DOLAN G P, ROBINSON J S. Residual stress reduction in 7175-T73, 6061-T6 and 2017A-T4 aluminium alloys using quench factor analysis [J]. Journal of Materials Processing Technology, 2004, 153-154: 346-351.
[9] GODARD D, ARCHAMBAULT P, AEBY G E, LAPASSET G. Precipitation sequences during quenching of the AA 7010 alloy [J]. ActaMaterialia, 2002, 50(9): 2319-2329.
[10] STARINK M J, MILKEREIT B, ZHANG Y, ROMETSCH P A. Predicting the quench sensitivity of Al-Zn-Mg-Cu alloys: A model for linear cooling and strengthening [J]. Materials & Design, 2015, 88: 958-971.
[11] PENG Ying-hao, LIU Chong-yu, WEI Li-li, JIANG Hong-jie, GE Zhen-jiang. Quench sensitivity and microstructures of high-Zn-content Al-Zn-Mg-Cu alloys with different Cu contents and Sc addition[J]. Transactions of Nonferrous Metals Society of China, 2021, 31(1): 24-35.
[12] TIRYAKIO?LU M, ROBINSON J S, EASON P D. On the quench sensitivity of 7010 aluminum alloy forgings in the overaged condition [J].Materials Science and Engineering A, 2014, 618: 22-28.
[13] LIU Sheng-dan, ZHANG Yong, LIU Wen-jun, DENG Yun-lai, ZHANG Xin-ming. Effect of step-quenching on microstructure of 7055 aluminum alloy [J]. Transactions of Nonferrous Metals Society of China, 2010, 20(1): 1-6.
[14] XIE Peng, CHEN Kang-hua, CHEN Song-yi, YE Sheng-ping, JIAO Hui-bin, HUANG Lan-ping. Study on quenching sensitivity of 7097 aluminum alloy [J]. Materials Research Express, 2019, 7(1): 016505.
[15] ZHOU Bo, LIU Bo, ZHANG Sheng-gen. The advancement of 7XXX series aluminum alloys for aircraft structures: A review [J]. Metals, 2021, 11: 1-29.
[16] YUAN Ding-ling, CHEN Song-yi, CHEN Kang-hua, HUANG Lan-ping, CHANG Jiang-yu, ZHOU Liang, DING Yun-feng. Correlations among stress corrosion cracking, grain-boundary microchemistry, and Zn content in high Zn-containing Al-Zn-Mg-Cu alloys [J]. Transactions of Nonferrous Metals Society of China, 2021, 31(8): 2220-2231.
[17] LI Shen-lan, HUANG Zhi-qi, CHEN Wei-ping, LIU Zhi-ming, QI Wen-jun. Quench sensitivity of 6351 aluminum alloy [J]. Transactions of Nonferrous Metals Society of China, 2013, 23(1): 46-52.
[18] WANG Hui-min, YI You-ping, HUANG Shi-quan. Investigation of quench sensitivity of high strength 2219 aluminum alloy by TTP and TTT diagrams[J]. Journal of Alloys and Compounds, 2017, 690: 446-452.
[19] CHAKRABARTI D J, LIU J, SAWTELL R R, VENEMA G B. New generation high strength high damage tolerance 7085 thick alloy product with low quench sensitivity [J]. Materials Forum, 2004, 28: 969-974.
[20] TOTTEN G E, WEBSTER G M, BATES C E. Quench factor analysis: Step-by-step procedures for experimental determination [C]//Proceedings of the ?rst international non-ferrous processing and technology conference. Materials park (OH): ASM International, 1997: 305-313.
[21] GARNER A, EUESDEN R, YAO Y, ABOURA Y, ZHAO H, DONOGHUE J, CURIONI M, GAULT B, SHANTHRAJ P, BARRETT Z, ENGEL C, BURNETT T L. PRANGNELL P B. Multiscale analysis of grain boundary microstructure in high strength 7xxx Al alloys [J]. ActaMaterialia, 2021, 202: 190-210.
[22] NIE Bao-hua, LIU Pei-ying, ZHOU Tie-tao. Effect of compositions on the quenching sensitivity of 7050 and 7085 alloys [J]. Materials Science and Engineering A, 2016, 667: 106-114.
[23] SUN Yuan-wei, PAN Qin-lin, SUN Yu-qiao, WANG Wei-yi, HUANG Zhi-qi, WANG Xiang-dong, HU Quan. Localized corrosion behavior associated with Al7Cu2Fe intermetallic in Al-Zn-Mg-Cu-Zr alloy [J]. Journal of Alloys and Compounds, 2019, 783: 329-340.
[24] CHEMIN A, MARQUES D, BISANHA L, MOTHEO A J, FILHO W W B, RUCHERT C O F. Influence of Al7Cu2Fe intermetallic particles on the localized corrosion of high strength aluminum alloys [J]. Materials & Design, 2014, 53: 118-123.
[25] WEN Kai, FAN Yun-qiang, WANG Guo-Jun, JIN Long-bin, LI Xi-wu, LI Zhi-hui, ZHANG Yong-an, XIONG Bai-qing. Aging behavior and precipitate characterization of a high Zn-containing Al-Zn-Mg-Cu alloy with various tempers [J]. Materials & Design, 2016, 101: 16-23.
[26] WANG Ying, PAN Qing-lin, SONG YAN-fang, LI Chen, LI Zhi-feng, CHEN Qin, YIN Zhi-min. Recrystallization of Al-5.8Mg-Mn-Sc-Zr alloy[J]. Transactions of Nonferrous Metals Society of China, 2013, 23(11): 3235-3241.
[27] MINODA T, YOSHIDA H. Effect of grain boundary characteristics on intergranular corrosion resistance of 6061 aluminum alloy extrusion [J]. Metallurgical and Materials Transactions A, 2002, 33: 2891-2898.
[28] TANG Jian-guo, YANG Zhen-shen, LIU Sheng-dan, WANG Qing, CHEN Jing-chao, CHAI Wen-ru, YE Ling-ying. Quench sensitivity of AA 7136 alloy: Contribution of grain structure and dispersoids[J]. Metallurgical and Materials Transactions A, 2019, 50: 4900-4912.
[29] ZHANG Meng-han, LI Cheng-bo, ZHANG Yong, LIU Sheng-dan, JIANG Jing-yu, TANG Jian-guo, YE Ling-ying, ZHANG Xin-ming. Effect of hot deformation on microstructure and quenching-induced precipitation behavior of Al-Zn-Mg-Cu alloy [J]. Materials Characterization, 2021, 172: 110861.
[30] TANG Jian-guo, CHEN Hui, ZHANG Xin-ming, LIU Sheng-dan, OUYANG Hui, LI Hong-ping. Influence of quench-induced precipitation on aging behavior of Al-Zn-Mg-Cu alloy [J]. Transactions of Nonferrous Metals Society of China, 2012, 22(6): 1255-1263.
[31] ZHANG Yong, WEYLAND M, MILKEREIT B, REICH M, ROMETSCH P A. Precipitation of a new platelet phase during the quenching of an Al-Zn-Mg-Cu alloy [J]. Scientific Reports, 2016, 6: 1-9.
[32] ZHAO Huan, GEUSER F D, SILVA A K D, SZCZEPANIAK A, GAULT B, PONGE D, RAABE D. Segregation assisted grain boundary precipitation in a model Al-Zn-Mg-Cu alloy [J]. ActaMaterialia, 2018, 156: 318-329.
[33] DU Yong, CHANG Y A, HUANG Bai-yun, GONG Wei-ping, JIN Zhang-peng, XU Hong-hui, YUAN Zhao-hui, LIU Yong, HE Yue-hui, XIE F Y. Diffusion coefficients of some solutes in fcc and liquid Al: critical evaluation and correlation [J]. Materials Science and Engineering A, 2003, 363: 140-151.
[34] SHA G, WANG Y B, LIAO X Z, DUAN Z C, RINGER S P, LANGDON T G. Microstructural evolution of Fe-rich particles in an Al-Zn-Mg-Cu alloy during equal-channel angular pressing [J]. Materials Science and Engineering A, 2010, 527: 4742-4749.
[35] FUJITA T, HORITA Z, LANGDON T G. Using grain boundary engineering to evaluate the diffusion characteristics in ultrafine-grained Al-Mg and Al-Zn alloys [J]. Materials Science and Engineering A, 2004, 371: 241-250.
[36] VANNARAT S, SLUITER M H, KAWAZOE Y. First-principles study of solute-dislocation interaction in aluminum-rich alloys [J]. Physical Review B, 2001, 64: 1-8.
[37] KOSUGI T, KINO T. Ultrasonic study of the interaction potential between a dislocation and a single solute atom [J]. Materials Science and Engineering A, 1993, 164: 316-321.
AA7136合金的淬火敏感性与非均匀析出行为
马志民1,2,3,张勇1,刘胜胆1,3,邓运来1,3,张新明1,3
1. 中南大学 材料科学与工程学院,长沙 410083;
2. 包头职业技术学院,包头 014030;
3. 中南大学 有色金属材料科学与工程教育部重点实验室,长沙 410083
摘要:通过时间-温度-性能(TTP)曲线研究AA7136合金的淬火敏感性,使用扫描电镜、扫描透射电镜和高分辨电镜研究等温保温过程中的非均匀析出行为。结果显示,99.5%TTP曲线的鼻尖温度约为346 °C,鼻尖处的转变时间约为0.245s。在不同等温保温样品中观察到η(MgZn2)相、T(Al2Zn3Mg3)相、S(Al2CuMg)相或富Cu-Zn的Y相,并将这些相的析出行为描述在TTP曲线中。随着保温时间的延长,这些平衡相的尺寸和面积分数增大,导致样品时效后的硬度降低。根据晶界/亚晶界和晶内弥散粒子上非均匀析出第二相的数量分析它们对硬度下降的定量贡献。
关键词:AA7136合金;淬火敏感性;时间-温度-性能曲线;非均匀析出
(Edited by Xiang-qun LI)
Corresponding author:Sheng-dan LIU, Tel: +86-731-88830265, E-mail: lsd_csu@csu.edu.cn;
1003-6326/  2021 The Nonferrous Metals Society of China. Published by Elsevier Ltd & Science Press
Abstract:The quenching sensitivity of AA7136 alloy was investigated by time-temperature-property (TTP) diagrams, and the heterogeneous precipitation behavior during isothermal holding was investigated using scanning electron microscopy, scanning transmission electron microscopy and high resolution transmission electron microscopy. Based on 99.5% TTP diagram, the nose temperature is determined to be about 346 °C with the transformation time of about 0.245 s. The precipitation of η (MgZn2), T (Al2Zn3Mg3), S (Al2CuMg) or Cu-Zn-rich Y phases can be found depending on isothermal holding temperature and time, and it is described in a time-temperature-precipitation diagram. The size and area fraction of isothermal holding induced phase particles increase, which results in the decrease of hardness of samples after aging. The quantitative contribution to loss of hardness bygrain boundaries/subgrain boundaries and dispersoids in the matrix is discussed based on the amount of heterogeneous precipitation related to them.