

Bubble size estimation using interfacial morphological information for
mineral flotation process monitoring
YANG Chun-hua(������), XU Can-hui(���ӻ�), MU Xue-min(IJѧ��), ZHOU Kai-jun(�ܿ���)
School of Information Science and Engineering, Central South University, Changsha 410083, China
Received 29 May 2008; accepted 21 October 2008
Abstract:
To relate froth structural information with mineral flotation performance, segmentation analysis was performed on froth images characterized by fully occupied convex bubbles with white spots effect. An improved valley edge detection method was proposed to extract structural features and overcome fake white spot edges seriously affecting the segmentation performance. After preprocessing, detection template was designed based on the local minimal intensity, and a binary image containing segmented boundaries was obtained by applying logical rules, thinning and filtering. Statistical features such as bubble size were estimated for control purpose. Experimental results demonstrate that the proposed method avoids over-segmentation or ill-segmentation caused by uneven illumination, and the industrial application reveals the reliability of bubble size estimation.
Key words:
flotation; bubble size; valley edge detection; watershed segmentation;
1 Introduction
It is well recognized that flotation is a multivariate process influenced by many factors such as reagent doses of chemicals, aeration rate, and impeller speed. The modeling and the control of flotation processes are challenging due to the inherently chaotic nature of the underlying microscopic phenomena. At present, the control of flotation process depends heavily on various experience of human operators by viewing the visual appearance of the froth. Based on the fact that vision information of froth layer surface is of great importance to the flotation process monitoring and control[1], it is a breakthrough to choose digital image processing as a novel tool to gain a better understanding of the industrial flotation process.
Bubble size, which determines the froth load, collision and attachment efficiency[1], is closely related to flotation process status. To explore the relationship between froth structural features and operational status, the estimation of bubble size using image segmentation based methods has received considerable attention[2-4]. In normal case, froth images collected from the industry field are characterized by fully occupied bubbles with convex shape that leads to the appearance of white spots. Therefore, MOOLMAN et al[5] developed a threshold based white spots detection method to measure bubble size. The manually set threshold value is not reliable for various froth image types and further bubble size estimation obtained from spot size distribution is rough and inaccurate. SADR-KAZEMI and CILLIERS[3] proposed a watershed algorithm to segment coal flotation froth image. The assumption of white spot inside each bubble is difficult to be satisfied for froth images. Even among the improved watershed methods, over- segmentation can still be a problem when applying to highly detailed images[6]. The above traditional approaches limit their applications for the unreliable performance under uneven illumination conditions.
YANG and ALURICH[7-8] developed a kinetic model of the concentrate solid flux related to image parameters on laboratory scale, and presented the effects of impeller speed and aeration rate on flotation performance of sulphide ore. It is found that the impeller speed and aeration rate have influence on the froth structures, indicating that control decision on impeller and aeration rate can be made by appearance of bubbles.
This work aims to analyze structural features of froth bubbles. To avoid the white spots effect, a novel algorithm named valley edge detection was proposed to segment froth image. Statistical features such as bubble size are extracted for control strategy design.
2 Flotation process and experimental set-up
The process of froth flotation entails crushing and grinding the raw ore to a fine size. After mixing these fine particles with water, the slurry (pulp) was fed in the flotation cells, while the mixture and introduced air were agitated continuously to form a large number of bubbles [9] (Fig.1). By adding chemicals, valuable minerals were made hydrophobic in order to attach to the air bubbles that rose up to the froth layer on the top of slurry, where valuable minerals were collected.
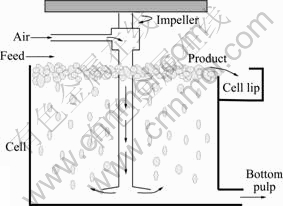
Fig.1 Scheme of individual flotation cell of process
The major chemical factors are reagent type and pH[1]. In practice, experienced human operators usually maintain pH value at a moderate level in circuit cells to improve separation efficiencies. They sample the pulp on hourly basis to check pH value, in which frequent adjustments are needed for the commonly utilized reagents like collector, and depressant[10] which are usually kept at a constant speed during stable period, except when the fed ore type is changed. While other operational parameters, such as the impeller speed and aeration rate, are generally fixed for the stability of industry process.
For the control and adjustment of pH, experiments are carried out in an industry bauxite flotation plant. The test set-up consists of a RGB camera and a lamp above the surface of froth layer. Choosing the specific position of surface for the collection is crucial to capture high quality images. Some researchers suggested that the position for installing camera should be near the cell lip [9-11]. This is not the case for flotation froth with its size varying from 1 mm to 20 mm. Therefore, we explored other possible positions for acquiring good pictures, which is significant for the following processing procedure. On the opposite side of the cell lip, position near the impeller seems to be a better choice for two reasons. The use of paddles near the cell lip to assist froth discharge will agitate bubbles around[1]. So, the position chosen needs to be far away from cell lips to avoid collision of bubbles as much as possible and keep more mineral particles attached to itself. On the other hand, bubbles are relatively ��fresh�� and newly rising with less fracture caused by the pressing. To accurately reflect froth color, environmental light is prevented from reflection by covering iron box on the cell top.
As discovered, froth images collected from industry field show that: 1) a froth image is fully occupied by bubbles, in normal case, without gaps or background region between bubbles; 2) the illumination on bubble surface is uneven; 3) each bubble has a convex shape, which leads to the appearance of white spots, generally on the top if the incident ray is right from the vertical direction of froth layer (Fig.2); and 4) edges between bubbles are weak, while edges caused by spot highlight are obvious.
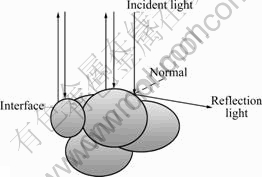
Fig.2 Reflection from surface of froth layer
3 Reported works on bubble size estimation
It is accepted that the operational process status can be characterized by bubble size distribution, which is inspected by human operators as heuristic knowledge. ?CONNOR et al[11] reported that an increase in pH causes bubble size to increase, and the bubble size distribution has a great effect on the probability of collision between mineral particles and bubbles, as well as the adhesion of these particles to the bubbles. MOOLMAN et al[1] also claimed that the result was consistent with the observation in the case of pyrite, and the recovery decreased at higher pH values. To establish the relationship between bubble distribution and flotation performance, a number of methods were reported to segment the froth images for estimating bubble size, including white spots detection[12], watershed transformation[13], and wavelet approaches[2].
3.1 White spots detection algorithm
This method assumes that each bubble includes one major white spot caused by illumination. Each white spot represents each bubble. Therefore, the number of bubbles in a froth image can be estimated by the white spot distribution. Statistically, the white spot size is proportional to the bubble size, and inversely proportional to average bubble size. A dynamic optimal thresholding technique is used to detect and extract white spots in the froth image[12].
Though this method is computationally effective, it has a strict demand of image quality and resolution. And it is uneasy to satisfy the assumption that one white spot corresponds to one bubble. Even there is one white spot, the threshold value is manually set and further bubble size estimation obtained from spot size distribution is rough and inaccurate. Other information like bubble area, diameter and shape cannot be extracted by only using this algorithm.
3.2 Watershed morphological segmentation method
Another concept of bubble image analysis is to perform full segmentation on froth image. A popular methodology is watershed method[13]. The idea of watershed is based on simulating water flows in a topographic representation of image intensity[14]. As shown in Fig.3, a three dimensional landscape can describe the topography, which consists of valleys and hills, representing the lower and the higher intensities of an image, respectively. Suppose that a hole is punched in each regional minimum. Put the model into a lake. Then water is immersed from the bottom through the hole at a uniform rate. When two lakes meet, the watershed can be identified. The flooding will eventually be accomplished until the entire landscape has been fully immersed.
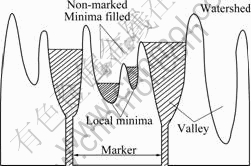
Fig.3 Immersion from marked to non-marked area
The principal objective is to find the watershed lines where the borders separate valleys belonging to different local minima. Marker-Controlled Watershed Segmenta- tion is often applied to alleviating the oversegmentation effect as a result of direct application of the watershed. In practical setup, the spotlights reflected on each bubble are used as makers.
LIN et al[6] pointed out that oversegmentation can still be a problem of the improved watershed transformation when applying it to highly detailed images, which is the case with froth images, and additionally those complex algorithms have not been reported for on-line real-time applications. By taking the preprocessing of images into consideration, the watershed segmentation is computationally intensive to be applied in real-time control system.
4 Improved valley edge detection algorithm
As discovered from the collected froth images, the edges detected are mostly located on the boundaries of white spots when using SOBEL method to obtain the gradient magnitude image in Fig.4. The edge between bubbles can hardly be detected by using classical edge detector. It is clearly shown in Fig.5 that areas with high grayscale values appear to be white spots, which seriously affect segmentation performance. In contrast, the boundaries between bubbles are weak, with lower gradient magnitude, some of which are local minimum intensity of the cross section of froth images[15]. From this perspective, a new detection scheme, called valley edge detection(VED) based segmentation can be derived based on the characteristics of froth images to avoid strong edges around the white spots.
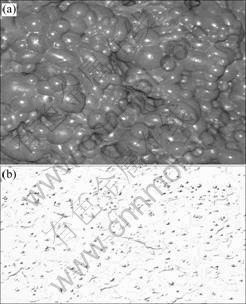
Fig.4 Edge detection results using SOBEL operator: (a) Original image; (b) Gradient magnitude image
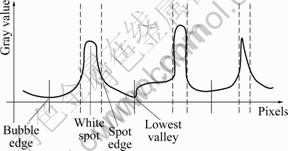
Fig.5 Intensity distribution of cross section of bubbles
The basic idea of valley edge detection is that the lowest intensity points along certain direction can be
detected when the illumination causes the formation of profile contours like valley. This method is irrelevant to real intensity value. The only need is to detect the lowest valley points and mark the location and direction as candidate edge points. The bubble edges can finally be identified by directly applying logical inequations to make judgment.
Let f(i, j) be the gray value of pixel (i, j) in original froth image, where i=1, 2, ��, M; j=1, 2, ��, N. Define a edge detection template (Fig.6) consisting of 3��3 sub-templates Xm, where m=0, 1, ��, 8.

Fig.6 Detection template
Every sub-template Xm includes k��k pixels amn, k=1, 2, 3, ��; n=0, 1, ��, k��k-1. In fact, a00 corresponds to f(i, j) of original froth image. Let g(i, j) represent the status of pixel (i, j). g(i, j) is a binary function consisting of logical ��0�� and ��1��, where ��1�� indicates that the pixel is a edge point, and vice versa.
Assume g0(i, j) is the status of f(i, j) in the horizontal direction. Let ![]() be the average gray value of k��k pixels in sub-template Xm:
be the average gray value of k��k pixels in sub-template Xm:
![]() (1)
(1)
When ![]() of sub-template X0 satisfies formula (2), gm=1; otherwise, gm=0.
of sub-template X0 satisfies formula (2), gm=1; otherwise, gm=0.
 (2)
(2)
State equation of pixel a00 is defined as
![]() (3)
(3)
where s=0?, 45?, 90?, 135?; P is a nonnegative integer representing intensity difference of local minima point and is smaller than intensity level. When g(i, j)=1, the relative pixel is considered to be an edge candidate point. However, the detected edge candidate set contains real valley edges and false boundaries caused by noise and disturbance. Therefore, after valley edge detection, post-processing procedures are needed. The detected would-be binary edge image is further dilated using morphological operator, followed by thinning processing and non-boundary filtering.
5 Experimental results and discussion
To evaluate the proposed valley edge detection based segmentation algorithm, 148 froth images were segmented by both VED and Marker-Controlled Watershed method. As shown in Fig.7, the original image Fig.4(a) with the size of 600��492 was first preprocessed by opening and closing reconstruction. The detected possible valley edge image was obtained when choosing template scale of 7 and intensity difference of 2. Fig.7(a) was further processed by thinning and filtering. The final segmentation result is shown in Fig.7(d). For comparison reason, the same froth image was segmented by traditional watershed method, as shown in Fig.8.
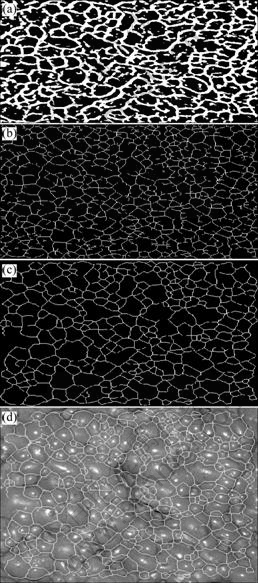
Fig.7 Process of VED based segmentation: (a) Detected valley edge; (b) Thinning result; (c) Filtering result; (d) Segmentation result by VED
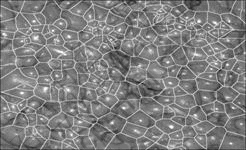
Fig.8 Segmentation results by Marker-Controlled Watershed
In comparison, both VED and watershed methods can accomplish segmentation task. Watershed segmentation is computationally slower than VED method, and more likely to over-segment the bubbles. Especially when the white spots inside each bubble are more than one spot, a bubble will be segmented into two or more bubbles. Another case is that watershed method might ill-segment several bubbles into only one bubble if there is no white spot inside bubbles. In contrast, VED method can segment froth image disregarding the white spots. So, the results are much more accurate.
Morphological parameters such as bubble area, equivalent diameter, eccentricity and bubble size distribution, are significant indicators of flotation status. They are extracted for control purpose (Table 1).
Table 1 Comparison of bubble statistical features
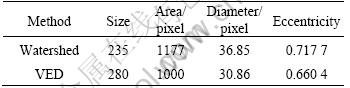
The average number of bubbles is counted manually to compare with the bubble size obtained by segmenta- tion method. The average bubble number counted of the froth image in Fig.7 is 290-340. The bubble size obtained by the proposed VED method is 280, much closer to the manual number. Statistical features such as average bubble area, equivalent diameter and eccentricity calculated from segmentation results also vary a lot, which can affect the accuracy of later process control. To conclude, the developed VED algorithm can segment froth images accurately and effectively. The estimated results are close to those of human operators. Further control strategies can be designed based on VEDsegmentation results and calculated statistical features.
6 Conclusions
1) New position for installing camera is explored and proved to be effective. The characteristics of images reflecting the flotation process are summarized.
2) Bubble structure analysis based on segmentation is investigated. Three froth segmentation approaches, including white spot detection, watershed segmentation, VED, are presented and compared. It is found that VED can disregard the white spots effect caused by illumination. Experimental results show that VED can perform segmentation more accurately than Marker- Controlled Watershed method, with a shorter computational time.
3) The calculated statistical features from VED segmented results are close to manual counts. Since on-line statistical features can be obtained automatically, the design of control strategy related to the industry process status will be presented in the near future.
References
[1] MOOLMAN D W, EKSTEEN J J, ALDRICH C, van DEVENTER J S J. The significance of flotation froth appearance for machine vision control [J]. International Journal of Mineral Processing, 1996, 48(3/4): 135-158.
[2] LIU J J, MACGREGOR J F, DUCHESENE C, BARTOLACCI G. Flotation froth monitoring using multiresolutional multivariate image analysis [J]. Minerals Engineering, 2005, 18(1): 65-76.
[3] SADR-KAZEMI N, CILLIERS J J. An image processing algorithm for measurement of flotation froth bubble size and shape distributions [J]. Minerals Engineering, 1997, 10(10): 1075-1083.
[4] BARTOLACCI G, PATRICK P Jr, TESSIER J Jr, CARL D, PIERRE-ALEXANDRE B, JULIE F. Application of numerical image analysis to process diagnosis and physical parameter measurement in mineral processes (Part I): Flotation control based on froth textural characteristics [J]. Minerals Engineering, 2006, 19(6/8): 734-747.
[5] MOOLMAN D W, ALDRICH C, van DEVENTER J S J. The interpretation of flotation froth surfaces by using digital image analysis and neural networks [J]. Chemical Engineering Science, 1995, 50(22): 3501-3513.
[6] LIN B, RECHE B, KNUDSEN J K H, JORGENSEN S B. Bubble size estimation for flotation processes [J]. Minerals Engineering, 2008, 21(7): 539-548.
[7] YANG Xiao-sheng, ALDRICH C. Relationship between solids flux and froth features in batch flotation of sulphide ore [J]. Trans Nonferrous Met Soc China, 2005, 15(6): 1373-1379.
[8] YANG Xiao-sheng, ALDRICH C. Effects of impeller speed and aeration rate on flotation performance of sulphide ore [J]. Trans Nonferrous Met Soc China, 2006, 16(1): 185-190.
[9] VENTURA-MEDINA E, BARBIAN N, CILLIERS J J. Solid loading and grade on mineral froth bubble lamellae [J]. International Journal of Mineral Processing, 2004, 74(1/4): 189-200.
[10] KAARTINENE J, HATONEN J, HYOTYNIEMI H, MIETTUNEN J. Machine-vision-based control of zinc flotation��A case study [J]. Control Engineering Practice, 2006, 14(12): 1455-1466.
[11] O��CONNOR C T, RANDALL E W, GOODALL C M. Measurement of the effects of physical and chemical variables on bubble size [J]. International Journal of Mineral Processing, 1990, 28: 139-149.
[12] WANG Wei-xing, LI Lei. Image analysis and computer vision for mineral froth [C]// Proceedings of IEEE International Conference on Mechatronics and Automation. Niagara Falls, Canada, 2005: 1790- 1795.
[13] BARTOLACCI G, SERRANTI S, VOLPE F, ZUCO R. Characterization of flotation froth structure and color by machine vision [J]. Computers and Geosciences, 2001, 27(9): 1111-1117.
[14] VINCENT L, SOILLE P. Watersheds in digital spaces: An efficient algorithm based on immersion simulations [J]. IEEE Transactions on Pattern Analysis and Machine Intelligence, 1991, 13(6): 583-598.
[15] WANG Wei-xing, WANG Lu-ya. Froth image segmentation algorithms and their validation [C]// Proceedings of International Conference on Signal Processing (WCCC-ICSP). Beijing, 2000: 2042-2045.
Foundation item: Project(60634020) supported by the Key Program of National Natural Science Foundation of China; Project(60874069) supported by the National Natural Science Foundation of China; Project(200805331104) supported by the Specialized Research Fund for the Doctoral Program of Higher Education of China
Corresponding author: XU Can-hui; Tel: +86-731-8836876; E-mail: xucanhui2005@126.com
DOI: 10.1016/S1003-6326(08)60335-0
(Edited by YANG Hua)
