
J. Cent. South Univ. (2016) 23: 1786-1798
DOI: 10.1007/s11771-016-3232-8

Optimizing bus services with variable directional and temporal demand using genetic algorithm
QU He-zhou(���)1, 2, CHIEN Steven I-Jy3, 4, LIU Xiao-bo(������)1,
ZHANG Pei-tong(����ͩ)1, BLADIKAS Athanassios5
1. School of Transportation and Logistics, Southwest Jiaotong University, Chengdu 610031, China;
2. Sichuan Province Key Laboratory of Comprehensive Transportation, Chengdu 610031, China;
3. College of Automobile, Chang��an University, Xi��an 710064, China;
4. John A. Reif Jr. Department of Civil and Environmental Engineering,
New Jersey Institute of Technology, Newark 07102-1982, USA;
5. Mechanical & Industrial Engineering, New Jersey Institute of Technology, Newark 07102-1982, USA
 Central South University Press and Springer-Verlag Berlin Heidelberg 2016
Abstract:
As a major mode choice of commuters for daily travel, bus transit plays an important role in many urban and metropolitan areas. This work proposes a mathematical model to optimize bus service by minimizing total cost and considering a temporally and directionally variable demand. An integrated bus service, consisting of all-stop and stop-skipping services is proposed and optimized subject to directional frequency conservation, capacity and operable fleet size constraints. Since the research problem is a combinatorial optimization problem, a genetic algorithm is developed to search for the optimal result in a large solution space. The model was successfully implemented on a bus transit route in the City of Chengdu, China, and the optimal solution was proved to be better than the original operation in terms of total cost. The sensitivity of model parameters to some key attributes/variables is analyzed and discussed to explore further the potential of accruing additional benefits or avoiding some of the drawbacks of stop-skipping services.
Key words:
bus transit; cost; travel time; service patterns; optimization; genetic algorithm��
1 Introduction
As a major mode choice of commuters�� daily travel, public transit is expected to offer sufficient capacity to serve as many passengers as possible in an effective way so that the level of service may be sufficiently high, but at a reasonable cost. Improving bus service and maintaining efficient system performance have been critical concerns of transit suppliers. One of the major drawbacks of bus service is frequent stops, which increase travel time and make the service unattractive. Stop-skipping (or express) service, allowing some buses to skip certain stops, can reduce passenger as well as vehicle travel time. However, all-stop service expands the service coverage and offers passengers in light demand areas a travel choice they did not have before. Thus, the success of integrating stop-skipping and all-stop services may reduce the cost to passengers and the transit provider. There are already fairly successful systems operated in the US (i.e. subways systems in New York City, NY and Boston, MA and bus transit systems in Newark, NJ and Madison, WI).
As indicated in previous studies [1-2], passenger travel time can be significantly reduced by introducing limited-stop (or called stop-skipping) service into a traditional all-stop service. EL-GENEIDY and SURPRENANT-LEGAULT [3] evaluated limited-stop service which saved vehicle running time and user travel time. The stop-skipping operation has been successful in increasing average speed while maintaining high service frequency and it is superior to the all-stop service in terms of reducing passenger travel time (VUCHIC [4]). While investigating the schedule of stop-skipping service in a congested urban setting during peak periods, NIU [5] formulated a nonlinear programming model to minimize the overall waiting times and the in-vehicle traveler costs subjected to a limited number of vehicles and using a bi-level genetic algorithm.
While analyzing transit service quality and system efficiency, several studies [6-10] indicated that the service level may be improved at a reasonable operator cost by employing optimized service strategies. FURTH and DAY [11] investigated three service strategies for planning bus operations, including short-turn, deadheading and express services. It was found that short-turn service is preferable when high-demand exists over a bus route segment, because it can reduce fleet size as well as operating cost. Short-turn and deadheading service patterns have been researched extensively [12-15]. ULUSOY et al [16] developed a model to optimize the integration of all-stop, short-turn and express services. The travel demand was assumed even on both directional services. The objective total cost was minimized subjected to frequency conservation and operable fleet size. To reduce total cost, TIRACHINI et al [17] introduced short-turn service on high demand segments, so that the negative impact of spatial demand concentration could be alleviated. Furthermore, CORT S et al [18] minimized total cost considering short turning and deadheading for a single transit line, and determined the optimal bus frequencies, vehicle capacities, and the stations where the strategy begins and ends.
Some studies focused on the integration of stop- skipping and all-stop services. FU et al [19] investigated the performance of a service strategy that allows a lead vehicle to perform all-stop service and the following one express service. A nonlinear integer model was developed to minimize the total cost incurred by both operator and passengers, while the optimal schedule was found by an exhaustive search method. CHIEN et al [20] developed an analytical model to minimize total cost for a general rail transit route with a many-to-many demand pattern. The integrated service patterns and frequencies were optimized subject to a set of constraints to ensure frequency conservation and operable fleet size. Assuming symmetric origin-destination (OD) passenger demand, ULUSOY and CHIEN [21] developed a model to optimize an integrated service (i.e. express and short-turn services, and all-stop services) which yielded the minimum total cost operation for a bus transit route with many stops considering transfer demand elasticity. Transfer demand at stops was determined by a logit model. A genetic algorithm was used to search for the optimal solution. CHIRAPHADHANAKUL and BARNHART [22] optimized a limited-stop service frequency in parallel with the local service of a transit route, to obtain the maximum users' welfare.
Many studies related to optimizing transit services focused on minimizing users�� travel time and system operating costs on an hourly basis. Previous studies [20, 23-24] concentrated on smaller networks in which the stopping patterns of express services are pre-defined. In reality, a bus route with many stops might traverse areas with different land uses and traffic conditions, which increases the difficulty of formulating the model and the computation time to search for optimal service patterns. Since the research problem discussed here is NP-hard, an efficient algorithm or heuristic is needed to search for the optimal solution. In addition, the ridership might vary temporally and spatially.
The objective of this work is to minimize the total cost of an integrated system (i.e. all-stop and stop-skipping) by optimizing the frequencies subject to directional frequency conservation, capacity and operable fleet size constraints. Unlike previous studies, the objective total cost function is developed to adapt to demand that varies by direction and over time. A genetic algorithm is developed to search for the optimal solution. In this work, a transfer penalty, and different values for the various components of users�� time (i.e., in-vehicle, transfer, and wait time) are considered. Unlike previous models, the proposed method optimizes stop-skipping services of a bus route with uneven demand. Thus, the optimized service frequencies vary temporally and skipped stops vary directionally and temporally. The needed data were collected from a real-world bus route, and are used to demonstrate the model��s efficiency and applicability. The sensitivity of model parameters to some key attributes/variables is analyzed and discussed to explore in detail the potential benefits of a stop-skipping service.
2 Model formulation
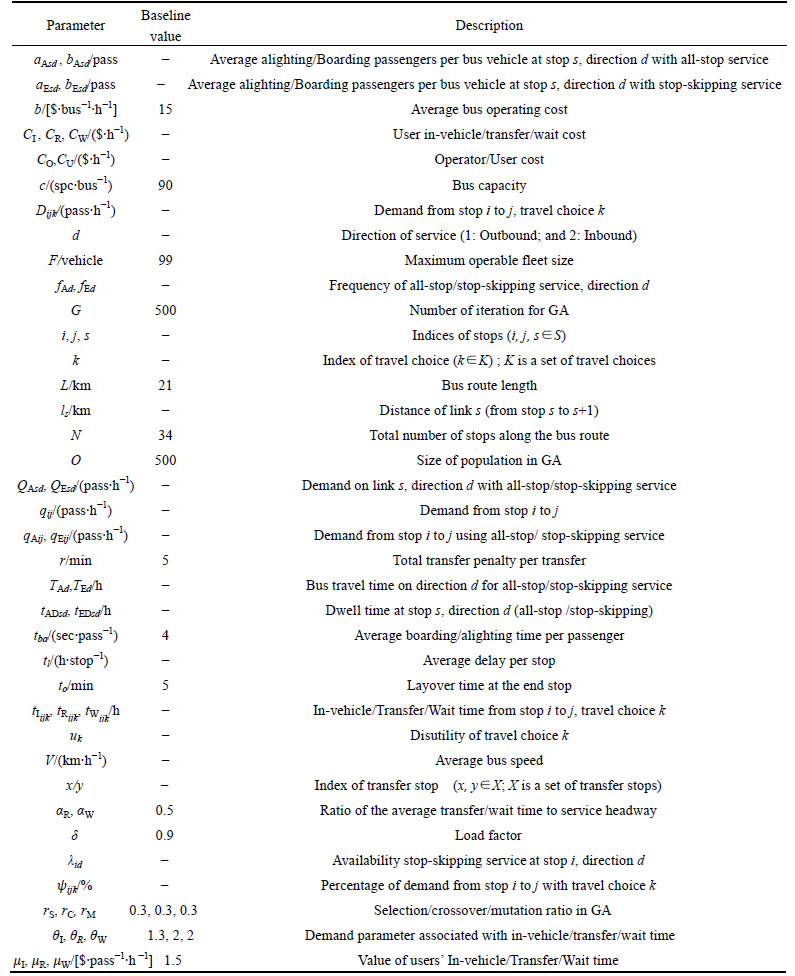
A mathematical model, consisting of an objective function and a set of constraints, is developed and discussed in this section. To minimize the objective total cost function (the sum of user and operator costs), decision variables, including bus frequencies, and stops served by stop-skipping service, shall be optimized subject to directional service frequency conservation, capacity, and fleet size constraints. The model parameters and variables utilized for formulating the proposed model are defined and summarized in Table 1. The assumptions considered in this work are as follows.

Fig. 1 A general bus route and associated services
1) A general L-kilometer long bus route with N stops (See Figure 1) is given. End terminals are served by both all-stop and stop-skipping services.
2) The frequencies of the outbound and inbound services are the same. The end stations have sufficient space for storing the required buses and there is no deadheading.
Table 1 Variable definitions and baseline values
3) The stop-skipping vehicle trips will be evenly spaced within the study time period. For instance, an integrated service with frequency of 2 stop-skipping buses and 6 all-stop buses per hour, the pattern would be dispatching 1 stop-skipping bus follow by 3 all-stop buses every half an hour.
4) The Origin-Destination (OD) demand is constant within a time period, but may vary by direction and time period. Passenger arrivals at stops are random, and the average wait/transfer time is a fraction (i.e. 0.5) of the service headway (the inverse of frequency).
5) The choice of a transfer location for passengers is determined considering the shortest travel time. The probability of more than one transfer per trip is negligible, and the single bus fare without transfer cost for passengers transferring from one service to another is considered in the model.
6) The average delay time of entering and leaving a bus stop is given. The dwell time at a stop linearly increases as the number of boarding and alighting passenger increases, and the average bus running speed is constant within a time period, but may vary over different time periods.
2.1 Demand estimation
This work considers that demand uses a specific service based on its availability at stop i in direction d (1: Outbound and 2: Inbound), denoted by the binary variables ��id, and the weighted travel time (or disutility). This variable is equal to 1 if stop-skipping service is available; otherwise, it is 0. Thus,
 (1)
(1)
A passenger may begin his/her journey with either all-stop or stop-skipping service depending on the service availability at bus stop and travel time (i.e. the sum of wait, transfer and in-vehicle times). Thus, the demand from stop i to j denoted as qij may have four alternatives (k �� K = {1, 2, 3, 4}), as illustrated in Fig. 2. The transfer location is chosen by a passenger considering his/her shortest travel time. Hence, demand Dijk from stop i to j with travel choice k can be determined by a fraction of qij. Thus,
 (2)
(2)
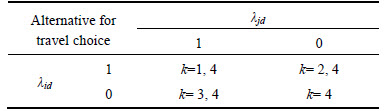
where  ijk can be estimated by a logit model using a disutility function (i.e., uk) of travel choice k, as shown in Eq. (3). The available choices for passengers originating at stop i and traveling to stop j vary with the availability of services at both stops, as listed in Table 2.
1) Situation 1
Both origin stop i and destination stop j are served by stop-skipping (��id=1; ��jd=1) and all-stop services. Thus, there are two travel choices that a passenger can make (k=1 and 4).
2) Situation 2
The stop-skipping service does serve origin stop i but not destination stop j (��id=1; ��jd=0). Some passengers may begin with the stop-skipping service and then transfer to the all-stop service (k=2), while others may take the all-stop service to stop j without transfer (k=4).
3) Situation 3
The stop-skipping service does not serve origin stop i but does serve destination stop j (��id=0; ��jd=1). Therefore, some passengers will begin their journey with the all-stop service, and then transfer to the stop-skipping service at a downstream stop (k=3), while others will not transfer (k=4).

Fig. 2 Travel choices for passengers from stop i to j
Table 2 Travel choices vs. service availability at stops
4) Situation 4
The stop-skipping service does not serve origin stop i and destination stop j (��id=0; ��jd=0). All passengers from stop i to j have to use the all-stop service without transfer.
Hence, the proportions of demand (ijk) that will use the four choices illustrated in Fig. 2 can be calculated as
 (3)
(3)
where uk is assumed to be the weighted sum of wait, transfer (if any), and in-vehicle time. Thus,
 (4)
(4)
where ��W , ��R and ��I represent the sensitivity of demand to wait (tWijk), transfer (tRijk), and in-vehicle time (tIijk), respectively.
2.2 Objective function
The objective function considered in this work minimizes the total cost (TC) and is defined as the sum of user CU and operator CO costs, shown as
 (5)
(5)
2.2.1 User cost (CU)
Considering the full path of a bus trip, the user cost is determined by including the time required for access, wait, transfer, in-vehicle travel and egress. Since the stop locations are given, the user access/egress time is constant and will not affect the optimal solution. Hence, the access/egress costs are omitted. The user cost, denoted as CU, is the sum of wait, transfer, and in-vehicle costs. Thus,
 (6)
(6)
where ��W,��R and ��I represent the value of user��s wait, transfer and in-vehicle time, respectively.
Wait cost is incurred by passengers waiting for buses at origin station i. tWijk is the average initial wait time, a fraction ��W of headway, which is the inverse of frequency. Thus,
 (7)
(7)
where fEd and fAd represent the frequencies of stop-skipping and all-stop services in direction d, respectively.
In this work, a passenger waits for the bus to transfer without extra transfer walking time and no transfer fare. Thus, tRijk represents the transfer time, which is the sum of average transfer waiting time (a fraction ��R of the pickup bus headway) and the total transfer penalty per transfer (r). There are several factors that affect passenger decisions to transfer, and include walking distance, waiting time, transfer fare, seat availability, service reliability, pedestrian environment, personal attributes etc [25-28]. In previous studies, the effects of all the factors were incorporated into a single total transfer penalty. Note that as passengers�� travel choice k is 1 and 4, they can reach their destination stops without transfer. The transfer time can be formulated as
 (8)
(8)
In-vehicle cost is incurred by the in-vehicle time for passengers. The in-vehicle time of passenger from station i to j with travel choice k, denoted as tIijk, includes the travelling time along the bus route, the average delay and dwell time at each stop. For k=1and k=4, passengers begin and end their travel with stop-skipping and all-stop service respectively, and there is no transferring. Thus,
 (9)
(9)
 (10)
(10)
Considering that passengers may use the combination of all-stop and stop-skipping services when k is equal to 2 or 3, the in-vehicle time is formulated as follows:
 (11)
(11)
where tIix1 (tIyj1) and tIxj4 (tIiy4) can be obtained using Eqs. 9 and 10. It is worth noting that x and y (x, y��X) represent transfer stops which can be identified based on the shortest travel time. V is the average bus speed; ls represents the spacing between bus stops s and s+1; tl is the average delay per stop resulting from deceleration and acceleration while a bus entering to and leaving from a stop; tEDsd and tADsd represent the dwell time at stop s in direction d of the stop-skipping and all-stop service, respectively, which can be derived by the average boarding/alighting time per passenger multiplied by the sum of boarding passengers and alighting passengers. Thus,
 (12)
(12)
 (13)
(13)
For stop-skipping service, the average boarding and alighting passengers per bus at stop s in direction d are denoted as bEsd and aEsd, respectively, and can be calculated by Eqs. (14) and (15) based on demand qEij and frequency fEd. Thus,
 (14)
(14)
 (15)
(15)
Similarly, the average boarding and alighting passengers per vehicle and the corresponding dwell time at stop s in direction d using all-stop service can be derived as Equations 16-17.
 (16)
(16)
 (17)
(17)
where qEij/qAij represents the demand from stop i to j using the stop-skipping/all-stop service and can be derived from demand Dijk, the stops served by stop-skipping and the transfer stops x and y (see Fig. 2). There are three travel choices (k=1, 2 and 3) for stop-skipping service passengers. Note that, in categories 2 and 3, passengers using the stop-skipping service would alight at transfer stop x and board at transfer stop y, respectively. Thus, qEij can be calculated as
 (18)
(18)
There are three travel choices (k=2, 3 and 4) for passengers who want to use an all-stop service. Note that, in categories 2 and 3, passengers using all-stop service would board at transfer stop x and alight at transfer stop y, respectively. Thus, qAij can be calculated as
 (19)
(19)
Note that at the last stop in both directions there are no passengers boarding the bus, and there are no passengers alighting off the bus for the first stop in both directions. The inbound traffic (direction 2) can be similarly formulated.
2.2.2 Operator cost (CO)
The operator cost is incurred by operating buses, which is the sum of the product of vehicle one-way travel time, vehicle frequency and average vehicle per hour operating cost (b). Thus, the operator cost is
 (20)
(20)
TEd and TAd are defined as the vehicle one-way travel time for stop-skipping and all-stop service in direction d, respectively, including the sum of bus moving time along the route, dwell time at each stop and layover time at the end stop (to). Thus,
 (21)
(21)
 (22)
(22)
2.3 Model constraints
Considering that vehicle operations should be realistic, directional frequency conservation, capacity and fleet size constraints are formulated and discussed below.
2.3.1 Frequency conservation constraint
The frequency conservation constraint is designed to ensure that the number of vehicles dispatched from both end stops will be the same. Thus,
 and
and  (23)
(23)
2.3.2 Capacity constraint
Equation (24) describes the capacity constraints needed to provide sufficient vehicle service capacity for all-stop and stop-skipping services to satisfy the available demand. For stop-skipping and all-stop service, the maximum demand on link s (link connects stops s to s+1) in direction d is defined as Max{QEsd} and Max{QAsd}, respectively. Thus,
 (24)
(24)
where �� is a load factor appropriate for the level of service, and c represents the vehicle capacity. QEsd and QAsd can be calculated from the stop i to j demand that uses stop-skipping and all-stop services, and denoted as qEij and qAij, respectively. Equations (25) and (26) can be used to write the outbound (direction 1) constraints. The inbound (direction 2) constraints can be formulated similarly.
 (25)
(25)
 (26)
(26)
2.3.3 Fleet size constraint
The limited operable fleet size denoted as F must be greater than or equal to the sum of the fleets for all-stop and stop-skipping services. It is noted that fleet size F is the product of vehicle travel time and its service frequency. Thus,
 (27)
(27)
It is worth noting that the total cost formulated in Eq. (5) can deal with heterogeneous demand distribution over the study bus route. With that the demand might be uneven for both directional services. Considering that the demand may vary temporally (i.e. over different time periods of a day), the proposed model may take demand of different time periods as input and output the corresponding optimal services which minimize the total cost.
3 Solution algorithm
As discussed earlier, the study problem is a combinatorial optimization problem. An efficient solution algorithm is needed to quickly search for the optimal result in a large solution space. In previous studies [16, 19] that considered small scale problems, the exhaustive search algorithm (ESA) was used as the solution approach. However, a real bus route has a greater number of stops leading to a large number of combination possibilities for stop-skipping services. Owing to increasing computation time, ESA may not be the best method to optimize the solution for such a bus route. To optimize a large scale combinatorial problem, the genetic algorithm (GA) has been regarded as an effective solution approach [20, 29-31]. GA is a powerful and broadly used tool to perform a stochastic search in large solution spaces [32], such as transit route network design [33], rail transit routes optimization [34], urban planning [35], transit scheduling optimization [36], and bus frequency optimization [29, 37]. Therefore, to reduce the computational time consumed by conventional techniques, a GA based approach is developed to search for the optimal solution.
To use the genetic algorithm, each individual in the population for a time period is represented by an encoded solution called chromosome, which is represented as
 (28)
(28)
The chromosome consists of three parts of genes encoded by a binary vector as shown in Fig. 3. In Part 1 the all-stop and stop-skipping service frequencies are represented by an integer string consisting of a series of cells, while in Parts 2 and 3 the binary vector indicates for each direction whether a stop is served or skipped. In Part 1 of the chromosome, the 1st and 2nd six-cell strings represent all-stop and stop-skipping service frequencies, respectively, which can be decoded based on the combinations of 0 and 1. The number of digits in Parts 2 and 3 are identical, representing the fact that the number of stops is equal for both directions. ��id=1 denotes that stop i is served by stop-skipping service, and ��id=0 otherwise. Considering that both end stops must be served by stop-skipping service, the variables ��1d and ��nd are set as 1 before executing the optimization processes. Thus, there are N-2 genes in both Parts 2 and 3 (N is the total number of stops along the bus route). Similarly, for special neighborhoods or CBD areas needed stop- skipping service, the corresponding genes associated with those location can be set as 1.
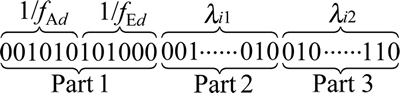
Fig. 3 Encoding illustration of chromosome
Three operators are included in GA executing processes: selection, crossover and mutation. Elitist selection is generally used to preserve the best chromosome in the new generation. Crossover is used for two randomly selected parent chromosomes to produce two better offspring by swapping corresponding segments of the parents, which intends to inherit good genes from parent chromosomes. The mutation operator is called mutation ratio which introduces genetic diversity into the population. The elitist selection, the two-point crossover operation and the two-point mutation which have been fully tested [21] are used in each generation until a terminating criteria is yielded.
In this work, the minimum total cost TC represents the best solution and the maximum fitness of the chromosomes. To ensure that the solutions always satisfy directional frequency conservation, capacity and fleet size constraints, an enormous penalty is introduced so that the infeasible solutions will be excluded. Thus, the objective function can be reformulated as follows:
 (29)
(29)
4 Solution approach
A step-to-step procedure using the developed GA to search for the optimal solution (i.e., service frequencies and skipped stops) is discussed below and illustrated in Fig. 4.
Step 1: Initialize the parameters for the GA such as population size, number of total generations, selection ratio (rS), crossover ratio (rC), mutation ratio (rM), termination rule, etc.
Step 2: Population initialization. Generate the initial group of solutions randomly and regard the initial group of solutions as the 1st generation.
Step 3: Decode the binary string into real numbers for each corresponding chromosome to obtain the service frequencies and the served or skipped stops by stop-skipping service in the outbound and inbound directions.
Step 4: Use the capacity and fleet size constraints as determined by Eqs. (23), (24) and (27) to check whether each solution satisfies the constraints.
Step 5: Calculate the objective function (total cost) value for each chromosome in the solutions by using Eq. (5).
Step 6: Sort the chromosomes in the population in ascending order by their objective function values.
Step 7: Implement the elitist mechanism in the selection process, and use the crossover and mutation operations to reproduce the new solutions.
Step 8: Use the constraints to check whether the new solutions satisfy the constraints. Re-evaluate the new solutions in terms of total cost and apply the constraint handling method via Eq. (29) to discard the infeasible solutions. Copy the remaining solutions to the next generation.
Step 9: Update the next generation and best solution.
Step 10: Check if the stop criteria (i.e. maximum iterations) is satisfied. Otherwise, go to Step 3.
Step 11: Terminate the GA search and output the best solution.
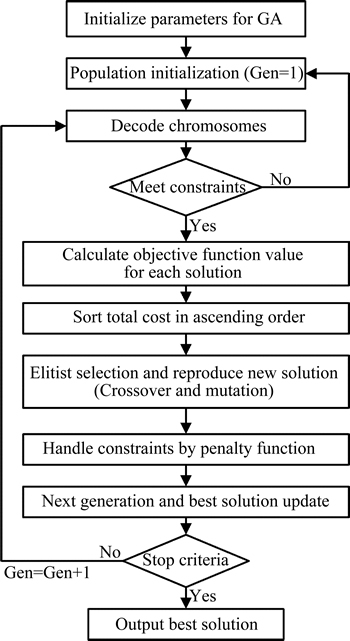
Fig. 4 Flow Chart of Genetic algorithm
5 Case study
5.1 Study area
The studied bus Route No. 56 in Chengdu (China), shown in Fig. 5, is approximately 21-km long providing all-stop service at 34 stops in a heavy-demand corridor. The service hours are segmented into 5 time periods that represent EA (Early Morning: 6:00 am-7:00 am), AM (Peak Morning: 7:00 am-9:00 am), MD (Middle Day: 9:00 am: -5:00 pm), PM (Peak Afternoon: 5:00 pm-7:00 pm) and NT (Night: 7:00 pm-11:00 pm). The services in the AM and PM periods were of concern to the agency. Therefore, the associated passenger Origin-Destination (OD) demand during the AM and PM periods of weekdays was collected by a 3-week survey and the results are presented in Fig. 6.

Fig. 5 Study route No. 56 in Chengdu, China
The values of model parameters were provided by the operating agency. The average bus operating speeds in the AM and PM periods are 30 km/h and 25 km/h (excluding dwell time and average delay at bus stop), respectively. A load factor of 0.9 was used to represent an acceptable level of service, making the effective capacity of a bus 81 passengers. Based on the survey at bus stops, the average delay of entering and leaving the stop in the AM and PM periods was 50 s and 55 s, respectively. The values of other model parameters were presented in Table 1. The optimization process was programmed using the MATLAB software. The distance between adjacent stops, OD demand matrix and formulations were entered into the program. Figure 7 shows the value of objective function versus number of iterations during the optimized process. It is notable that the total cost reduced quickly at the beginning 100 iterations and then a converged result was found around 200 iterations.
5.2 Original vs. optimal operations
The costs incurred by passengers and vehicles under the original and two scenario operations (S-I: All-stop service only and S-II: integrated all-stop and stop-skipping service) are summarized in Table 3 where the optimal service frequencies for both all-stop and stop-skipping services in the AM and PM periods are included.

Fig. 6 Hourly passenger demand distribution:
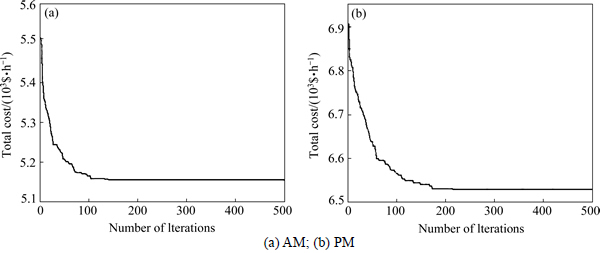
Fig. 7 Total cost vs. iteration number:
Table 3 Optimal solutions for various scenarios (AM and PM)

5.2.1 Original operation
Based on the original operation, the frequency of all-stop service is 22 and 26 buses/h in the AM and PM periods, respectively. In the AM period, the associated total cost is 5483 $/h, consisting of 4421 and 1062 $/h user and operator costs, respectively. In the PM period, the associated total cost is 6938 $/h, consisting of 5575 $/h user cost and 1363 $/h operator cost.
5.2.2 Scenario I (S-I): All-stop only service
The optimal frequency of all-stop service in the AM period is 21 buses/h and achieves a minimum cost of 5445 $/h, and 23 buses/h in the PM period that achieves a minimum cost of 6808 $/h. Compared to the original service, nearly 38 $/h and 130 $/h can be saved in the AM and PM periods, respectively. The reduced cost is a result of a reduced service frequency, which leads to a higher vehicle utilization rate and lower fleet size and operator cost, albeit the slight increase in waiting cost.
5.2.3 Scenario II (S-II): Integrated all-stop and stop- kipping service
The optimal service frequencies for all-stop and stop-skipping services are 14 and 7 vehicles per hour, respectively in the AM period and 16 and 8 vehicles per hour, respectively in the PM period (Fig. 8). For the outbound stop-skipping service in the AM period, stops 1, 2, 14, 15, 16, 17, 18 and 34 are served, while in the inbound direction, the served stops include 1, 5, 6, 7, 8, 9, 10, 25, 28, 29, 30, 31, and 34. For the outbound PM period service, stops 1, 6, 7, 10, 11, 15, 16, 21, 22, 23 and 34 are served by the stop-skipping service, while in the inbound, the served stops include 1, 5, 7, 10, 14, 15, 25, 28, 29, 30, 33 and 34.Compared to the original service, nearly 328 $/h and 408 $/h can be saved in the AM and PM periods, respectively. Implementing integrated service may reduce the in-vehicle time, vehicle running time per trip, and fleet size, albeit the slight increase in wait and transfer times. It is worth noting that with integrated stop-skipping and all-stop service, bus average speed increases by 32.1% in the AM period and 26.2% in the PM period.

Fig. 8 Total cost vs frequency:
5.3 Sensitivity analysis
In this section, the sensitivity of model parameters to some key attributes/variables is analyzed and discussed based on the data for the AM period.
The sensitivity of the user��s value of time (the same value for wait, transfer and in-vehicle time) to the optimized service frequencies is illustrated in Fig. 9(a). It was found that increasing the user��s value of time leads to increasing frequencies for both all-stop and stop-skipping services so that the users�� wait and transfer costs can be reduced. However, if the user��s value of time less than 6 $/(pass��h), the optimal frequency of stop-skipping service increases faster than that of all-stop service, because the in-vehicle time of a passenger using the stop-skipping service is shorter than that of a passenger using the all-stop service, which induces more passengers to use the stop-skipping service. It was also found that if the user��s value of time exceeds 7 $/(pass��h), the all-stop and stop-skipping service frequencies remain constant due to the constraint of fleet size.
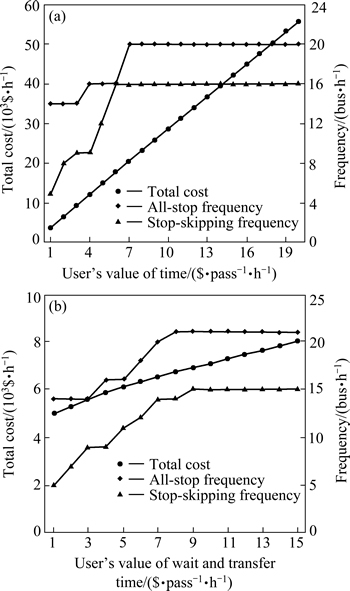
Fig. 9 Minimized total cost and optimized frequency vs. value of time (a) and minimized total cost and optimized frequency vs. value of wait/transfer time (b)
The effects of the user��s value of wait and transfer time on the minimum total cost and optimized frequencies are illustrated in Fig. 9(b). In this analysis, the in-vehicle time remains the same at 1.5 $/(pass��h) and the users�� values of wait and transfer times vary. It was found that increasing the user��s value of wait and transfer time leads to increasing frequencies for both all-stop and stop-skipping services so that the expensive wait cost can be reduced. However, the rate of increase in stop-skipping service frequency is greater than that of the all-stop service. If the user��s value of time exceeds 9 $/(pass��h), the optimal frequencies of the all-stop and stop-skipping service remains constant because of the fleet size constraint.
The impact of the transfer penalty on transfer demand and optimized frequencies is shown in Fig. 10. It was found that increasing the transfer penalty results in decreasing transfer demand. Hence, the frequency of the stop-skipping service is reduced, while the frequency of the all-stop service increases.
Figure 11 indicates that as bus capacity increases, the optimized frequencies of all-stop and stop-skipping services decrease and lead to a higher total cost. Increasing bus capacity may reduce the service frequency and increases wait time. The frequency of all-stop service decreases faster than that of the stop-skipping service. If the bus capacity is between 100 and 120 space/bus, the optimal frequency of the stop-skipping service remains constant and the frequency of the all-stop service is reduced. The same variation of frequencies exists between the stop-skipping and all-stop services when the bus capacity is between 130 and 150 space/bus and more. However, the operator cost increases slightly as the average bus operating cost increases due to the larger bus size.
The sensitivity of optimized service frequencies and costs on the bus operating cost is presented in Fig. 12. As the bus operating cost increases from 5 to 25 $/(bus��h), the optimized stop-skipping service frequencies decrease. However, the all service frequencies remain the same when the bus operating cost is over 25 $/(bus��h) due to the capacity constraint.

Fig. 10 Transfer passengers and optimized frequency vs. transfer penalty

Fig. 11 Costs and optimized frequency vs. bus capacity

Fig. 12 Cost and frequency vs. average bus operating cost
6 Conclusions
Considering a temporally and directionally variable demand, this study developed a mathematical model to optimize integrated bus services (all-stop and stop-skipping) and determined the associated service frequencies which minimize the total cost subject to capacity and fleet size constraints. The study problem is a combinatorial optimization problem. Because of the number of stops on the route, a large number of stop combinations served by stop-skipping service are candidates for implementation. To search for an optimal solution quicker, a genetic algorithm (GA) was developed. As demonstrated in the case study, the proposed method offers a practical approach to design an efficient transit service, which improves system performance and generates savings for Route 56 in Chengdu, China. In this study, the modeling approach proposed is very flexible, and can be utilized to optimize a generalized transit route when the OD demand and the route/stop locations are available. Transit agencies may easily adopt the developed model and solution algorithm with minor modification to estimate user and operator costs.
A sensitivity analysis investigated the impacts of changes in some key model attributes/variables and generated the following insights:
1) Compared with the conventional pure all-stop service, stop-skipping service is an effective strategy to improve transit service quality and operating efficiency. User��s in-vehicle cost and operator cost can be reduced, although the waiting cost may slightly increase. Because of increased travel speed, the benefit of reduced in-vehicle time and fleet size is sufficient to compensate for the increased waiting and transfer costs.
2) When all components of the user��s value of time or only the value of wait and transfer time increase, operator cost increases because the frequencies for both bus services increase in to reduce the expensive wait and transfer user costs. It was found that increasing the transfer penalty leads to the decreased transfer demand and the increased total cost.
3) As bus capacity increases, the optimized service frequencies decrease, leading to a higher user as well as operator cost due to the higher average operating cost of bigger buses.
4) Increasing bus operating costs tend to decrease frequencies of both all-stop and stop-skipping services. However, if the operator cost continuously increases, the optimal frequencies of all-stop and stop-skipping services and user cost remain constant due to the capacity constraint.
Since the highest demand section in both directions of the studied route is nearly equal, in this case equal frequencies per direction were considered. Designing unequal integrated service frequencies for each travel direction may be beneficial in cases where the demand between the two directions is quite unbalanced, and this can be an immediate extension of this study. Including other strategies such as deadheading should be explored also to improve potentially the system��s performance. In addition, optimal dispatching solutions of all-stop and stop-skipping services at the starting terminal could be developed to coordinate transfer and analyze passenger waiting time in depth. Considering that the bus fare may affect the passenger trip choice, the relation among the demand, passenger trip cost and bus fare can be established as soon as the bus fare configuration information is collected,which can be an immediate extension of this study.
References
[1] ERCOLANO J M. Limited-stop bus operations: An evaluation [J]. Transportation Research Record, 1984(994): 24-29.
[2] CASELLO J M, HELLINGA B. Impacts of express bus service on passenger demand [J]. Journal of Public Transportation, 2008, 11(4): 1-23.
[3] EL-GENEIDY A M, SURPRENANT-LEGAULT J. Limited-stop bus service: An evaluation of an implementation strategy [J]. Public Transport, 2010, 2(4): 291-306.
[4] VUCHIC V R. Skip-stop operation as a method for transit speed increase [J]. Traffic Quarterly, 1973, 27(2): 307-327.
[5] NIU H. Determination of the skip-stop scheduling for a congested transit line by bi-level genetic algorithm [J]. International Journal of Computational Intelligence Systems, 2011, 4(6): 1158-1167.
[6] TZENG G H, SHIAU T A. Multiple objective programming for bus operation: A case study for Taipei city [J]. Transportation Research Part B: Methodological, 1988, 22(3): 195-206.
[7] CHIEN S. Optimization of headway, vehicle size and route choice for minimum cost feeder service [J]. Transportation Planning and Technology, 2005, 28(5): 359-380.
[8] ZHAO F, ZENG X. Optimization of transit network layout and headway with a combined genetic algorithm and simulated annealing method [J]. Engineering Optimization, 2006, 38(6): 701-722.
[9] HAFEZI M H, ISMAIL A. Balancing between headway and frequency scheduling for bus service [C]// Applied Mechanics and Materials. 2011, 97: 669-673.
[10] VERBAS 
 , FREI C, MAHMASSANI H S, CHAN R. Stretching resources: Sensitivity of optimal bus frequency allocation to stop-level demand elasticities [J]. Public Transport, 2015, 7(1): 1-20.
[11] FURTH P G, DAY F B. Transit routing and scheduling strategies for heavy demand corridors [J]. Transportation Research Record, 1985(1011): 23-26.
[12] FURTH P G. Short turning on transit routes [J]. Transportation Research Record, 1987(1108): 42-52.
[13] CEDER A. Optimal design of transit short-turn trips [J]. Transportation Research Record, 1989(1221): 8-22.
[14] CEDER A, STERN H I. Deficit function bus scheduling with deadheading trip insertions for fleet size reduction [J]. Transportation Science, 1981, 15(4): 338-363.
[15] FURTH P G. Alternating deadheading in bus route operations [J]. Transportation Science, 1985, 19(1): 13-28.
[16] ULUSOY Y, CHIEN S, WEI C H. Optimal all-stop, short-turn, and express transit services under heterogeneous demand [J]. Transportation Research Record, 2010(2197): 8-18.
[17] TIRACHINI A, CORTS C E,  S R. Optimal design and benefits of a short turning strategy for a bus corridor [J]. Transportation, 2011, 38(1): 169-189.
[18] CORTS C E, S, TIRACHINI A. Integrating short turning and deadheading in the optimization of transit services [J]. Transportation Research Part A: Policy and Practice, 2011, 45(5): 419-434.
[19] FU L, LIU Q, CALAMAI P. Real-time optimization model for dynamic scheduling of transit operations [J]. Transportation Research Record, 2003(1857): 48-55.
[20] CHIEN S I J, ULUSOY Y Y, WEI C H. Integrated transit services for minimum cost operation considering heterogeneous demand [J]. Transportation Planning and Technology, 2010, 33(7): 605-624.
[21] ULUSOY Y Y, CHIEN S I J. Optimal bus service patterns and frequencies considering transfer demand elasticity with genetic algorithm [J]. Transportation Planning and Technology, 2015, 38(4): 409-424.
[22] CHIRAPHADHANAKUL V, BARNHART C. Incremental bus service design: combining limited-stop and local bus services [J]. Public Transport, 2013, 5(1/2): 53-78.
[23] LEIVA C,  J C, GIESEN R, LARRAIN H. Design of limited-stop services for an urban bus corridor with capacity constraints [J]. Transportation Research Part B: Methodological, 2010, 44(10): 1186-1201.
[24] LARRAIN H, GIESEN R, J. Choosing the right express services for bus corridor with capacity restrictions [J]. Transportation Research Record, 2010(2197): 63-70.
[25] ALGERS S, HANSEN S, TEGNER G. Role of waiting time, comfort, and convenience in modal choice for work trip [J]. Transportation Research Record, 1975(534): 38-51.
[26] HAN A F. Assessment of transfer penalty to bus riders in taipei: A disaggregate demand modeling approach [J]. Transportation Research Record, 1987(1139): 8-14.
[27] GUO Z, WILSON N. Assessment of the transfer penalty for transit trips geographic information system-based disaggregate modeling approach [J]. Transportation Research Record, 2004(1872): 10-18.
[28] GUO Z, WILSON N. Modeling effects of transit system transfers on travel behavior: case of commuter rail and subway in downtown boston, massachusetts [J]. Transportation Research Record, 2007(2006): 11-20.
[29] ULUSOY Y Y, CHIEN S I J. Optimizing integrated bus service for minimum cost operation with genetic algorithm�Ca case study in new jersey [C]// Transportation Research Board 90th Annual Meeting. 2011: No.11-1910.
[30] HOLLAND J H. Adaptation in natural and artificial systems: An introductory analysis with applications to biology, control, and artificial intelligence [M]. Ann Arbor, USA: U Michigan Press, 1975.
[31] GOLDBERG D E. Genetic algorithms in search optimization and machine learning [M]. Reading Menlo Park: Addison-Wesley, 1989.
[32] GEN M, CHENG R. genetic algorithms and engineering design [M]. New York: John Wiley & Sons, 1997.
[33] FAN W, MACHEMEHL R B. Optimal transit route network design problem with variable transit demand: Genetic algorithm approach [J]. Journal of Transportation Engineering, 2006, 132(1): 40-51.
[34] JHA M K, SCHONFELD P, SAMANTA S. Optimizing rail transit routes with genetic algorithms and geographic information system [J]. Journal of Urban Planning and Development, 2007, 133(3): 161-171.
[35] BALLING R J, TABER J T, BROWN M R, DAY, K. Multiobjective urban planning using genetic algorithm [J]. Journal of Urban Planning and Development, 1999, 125(2): 86-99.
[36] CHAKROBORTY P, DEB K, SUBRAHMANYAM P S. Optimal scheduling of urban transit systems using genetic algorithms [J]. Journal of Transportation Engineering, 1995, 121(6): 544-553.
[37] YU B, YANG Z, YAO J. Genetic algorithm for bus frequency optimization [J]. Journal of Transportation Engineering, 2009, 136(6): 576-583.
(Edited by DENG L��-xiang)
Foundation item: Project (B01B1203) supported by Sichuan Province Key Laboratory of Comprehensive Transportation, China; Project (SWJTU09BR141) supported by the Southwest Jiaotong University, China
Received date: 2015-09-20; Accepted date: 2016-03-01
Corresponding author: LIU Xiao-bo, PhD; Tel: +86-13688002461; E-mail: xiaobo.liu@swjtu.cn
Abstract: As a major mode choice of commuters for daily travel, bus transit plays an important role in many urban and metropolitan areas. This work proposes a mathematical model to optimize bus service by minimizing total cost and considering a temporally and directionally variable demand. An integrated bus service, consisting of all-stop and stop-skipping services is proposed and optimized subject to directional frequency conservation, capacity and operable fleet size constraints. Since the research problem is a combinatorial optimization problem, a genetic algorithm is developed to search for the optimal result in a large solution space. The model was successfully implemented on a bus transit route in the City of Chengdu, China, and the optimal solution was proved to be better than the original operation in terms of total cost. The sensitivity of model parameters to some key attributes/variables is analyzed and discussed to explore further the potential of accruing additional benefits or avoiding some of the drawbacks of stop-skipping services.
