
Numerical simulation of current distribution in metal pad of aluminum reduction cells
QI Xi-quan(��ϲȫ), FENG Nai-xiang(������), CUI Jian-zhong(����)
(School of Materials and Metallurgy, Northeastern University, Shenyang 110004, China)
Abstract:
Based on the numerical calculation of 3-D potential distribution in aluminum reduction cells, current distribution in the metal pad is calculated under the following conditions: 1) pot ledge ideally formed; 2) ledge extension to below anode; 3) different metal heights; 4) AC and 5) Spike. It is found that Jy in metal pad increases first to a highest point and then decreases along anode length. At normal status, the largest Jy is about 0.4A/cm2 and it locates at about 2/3 of anode length. With longer ledge, the maximum value of Jy decreases and its position moves center-ward. The longer the side ledge, the larger the negative current flowing center-ward at side channel. Jz in metal pad increases with anode length and it is not affected by metal height; while Jy increases with metal height. At AC, current flows toward metal under new anode. At spike, current concentrates at spike rather than evenly distributes. Normally, Jx is almost negligible in metal pad.
Key words:
aluminum reduction cell; current density; numerical simulation; metal pad CLC number: TF821;
Document code: A
1 INTRODUCTION
It is troublesome to have a larger horizontal current fraction in the metal pad of aluminum reduction cells, because it acts with vertical magnetic field fraction Bz to produce a driving force which causes flowing, waving and instability of the metal. Therefore, current distribution in metal has always been the research topic of aluminum experts. Tarapore[1] determined the horizontal current in the metal by measuring the current in steel collector bars. Arita et al[2] and Robl[3] studied the effects of side ledges on horizontal current in metal pad. It was found that longer ledges cause larger inward flowing currents in metal pad. Fraser et al[4] and El-demerdash et al[5] calculated the current density of different metal layers under different ledge lengths. Zoric et al[6] ever studied the current distribution in prebake anodes and its relationship with anode shape. MEI et al[7, 8] calculated the current distribution in metal pad by second bound method and presented in detail the current distribution in every part of reduction cell especially under normal cell status. LI et al[9,10] solved the potential field of the cell by commercial software ANSYS and got the current distribution in the metal as well as in anodes and further studied cell thermal field. LI et al[11] ever studied the potential field of cell cathode with their own software. LIU et al[12] calculated the current distribution of a drained cathode cell with ANSYS. FENG et al[13] and QI et al[14-16] also studied cell current distribution and proposed their ideas for anode design. However, up to now, few reports have been found for the study of the effects of metal height, ledge length and anode change on vertical and horizontal current pattern in the metal. These studies should be very helpful for understanding the effects of these factors on cell operation and taking necessary actions to minimize their negative influences.
In this paper, definite difference method is adopted to calculate the 3-D potential field of the whole cell first and then the current distributions under such conditions as normal cell status, AC, different metal height, long ledge and spike are gotten. All the calculations are on 190kA cell. The structure and process parameters of 190kA cell are listed in Table 1.
2 MATHEMATICAL MODEL AND CALCULATION METHOD
The governing equation for potential field is expressed as follows:
![]() ����V=0(1)
����V=0(1)
where �� is electric conductivity, V is potential. Differentially, equation (1) represents one energy balance. Therefore, its differential equations can be derived according to energy balance. Based on Kirhoff Law, the algebraic sum of all the current fractions entering into governing volume P(the central volume) is zero, i.e.,
Table 1 Structure and process parameters of 190kA cell

Ii-1, j, k+Ii+1, ,j, k+Ii, j-1, k+Ii, j+1, k+Ii, j, k-1+Ii, j, k+1=0(2)
Governing volumes and their relationships are shown in Fig.1. W��E direction is designated as X-direction with E as positive direction, S��N as Y-direction with N as positive direction. According to Right-hand Law, H��L will be Z-direction with H as positive direction. The current entering into governing volume P from governing volume W can be expressed by Ohm Law:
Ii-1, j, k=(Vi-1, j, k-Vi, j, k)/Ri-1, j, k(3)
where Vi-1, j, k and Vi, j, k are the potentials at the nodes at the centers of governing volumes W and P. Ri-1, j, k is the resistance between governing volume W and P and it consists of two components: the Ohm resistances (Ro) of the neighboring two volumes and the contact resistance (Rc) between them.
Here Ro, i-1 is expressed as follows:
Ro, i-1=2��Xi-1��(��i-1, j, k+��i, j, k)/((��Yj-1+��Yj+1)��(��Zk-1+��Zk+1))(4)
Rc, i-1 is calculated by the following equation:
Rc, i-1=4��c, i-1/((��Yj-1+��Yj+1)��(��Zk-1+��Zk+1))(5)
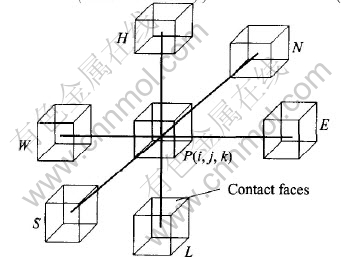
Fig.1 Governing volumes and their relationships
where ��i-1, j, k is the resistivity of governing volume W, so is ��i, j, k for volume P. ��c, i-1 is the contact resistivity between volumes W and P. ��X, ��Y and ��Z are the corresponding sizes of the volumes in three directions. Hence, the total resistance between volumes W and P is
Ri-1=((2��Xi-1��(��i-1, j, k+��i, j, k))+4��c, i-1)/((��Yj-1+��Yj+1)��(��Zk-1+��Zk+1))(6)
As resistivity is a function of temperature, 2-D electro-thermal field of reduction cell is simulated with software provided by Ref.[13] to determine the temperature distribution which in turn is used for resistivity calculation. All the data of resistivities and heat conductivities of all the lining materials are from Ref.[13] too.
Similarly, currents entering into governing volume P from governing volumes E, S, N, H and L can also be expressed by Ohm Law as follows:
Ii+1, j, k=(Vi+1, j, k-Vi, j, k)/Ri+1, j, k(7)
Ii, j-1, k=(Vi, j-1, k-Vi, j, k)/Ri, j-1, k(8)
Ii, j+1, k=(Vi, j+1, k-Vi, j, k)/Ri, j+1, k(9)
Ii, j, k-1=(Vi, j, k-1-Vi, j, k)/Ri, j, k-1(10)
Ii, j, k+1=(Vi, j, k+1-Vi, j, k)/Ri, j, k+1(11)
where W, E, N, S, H and L represent the West, East, North, South, High and Low volumes respectively. Corresponding resistances are calculated with equation (6).
Introduce equations (7), (8), (9), (10), (11) and (12) into equation (2) and make some treatment, equation (12) is gotten:
Vi, j, k/Ri, j, k-Vi-1, j, k/Ri-1, j, k-
Vi+1, j, k/Ri+1, j, k-Vi, j-1, k/Ri, j-1, k-
Vi, j+1, k/Ri, j+1, k-Vi, j, k-1/Ri, j, k-1-
Vi, j, k+1/Ri, j, k+1=0(12)
where
1/Ri, j, k=1/Ri-1, j, k+1/Ri+1, j, k+1/Ri, j-1, k+ 1/Ri, j+1, k+1/Ri, j, k-1+1/Ri, j, k+1(13)
Equation (12) is the discrete equation of any node inside the calculation system. Consequently, all the discrete equations can be obtained for all the nodes and one equation group is formed. By solving the equation group, we can get the potential distribution of the calculation system. As current density is the negative gradient of potential, current densities inside each unit can be calculated easily with equations (14), (15) and (16):
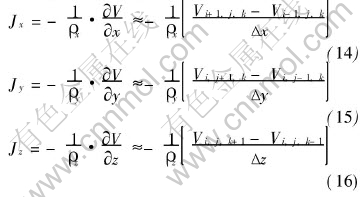
where J is the current density, V is the potential, and �� is the added resistivity of the three neighboring volumes in the same direction.
3 CALCULATION SYSTEM AND BOUNDARY CONDITIONS
For the 190kA cell in problem, there are 36 cathodes and 28 anode assemblies. To keep the continuity of boundary conditions and the accuracy of calculation, a whole cell is chosen as the object of study. Suppose that all the 28 anodes equally share 1/28 of the total current and all 4 pins on one anode equally divide the current flowing through one anode. Hence, the current densities of the 4 pins on surface T are the same. Other areas on surface T are electrically isolated, as shown in Fig.2.
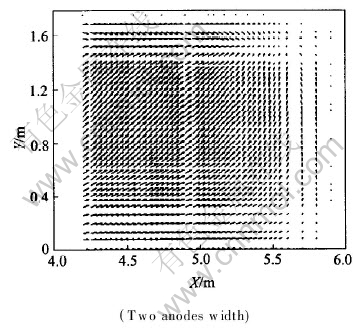
Fig.2 Diagram of calculation system and boundary conditions
Meanwhile, suppose that all the 36 cathodes equally share the total current and the two bars equally divide the current flowing through one cathode. Therefore, for all the steel collector bars, the current densities at the bar ends(surface Q) are the same. The origin point of the calculation system is located at the horizontal center of the cathode block bottom. X points to the length direction of the cell, Y parallels to the potline current, Z directs vertical up. X, Y and Z fulfill Right-hand Law.
4 RESULTS AND DISCUSSION
Current distributions in metal pad are calculated under conditions of normal cell status, long ledge, AC, different metal height and spike.
4.1 Jy in metal pad
4.1.1 Normal cell conditions (zero ledge length)
Current density (Jy) is shown in Fig.3 and J distribution in Y-Z plane is shown in Fig.4.

Fig.3 Jy in metal pad along Y axis under normal conditions
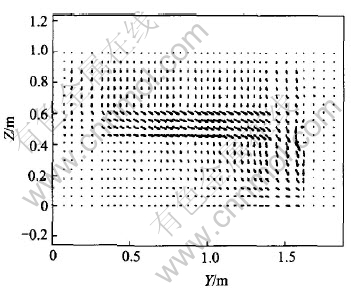
Fig.4 J distribution in Y-Z plane
It is shown from Fig.3 and Fig.4 that in the metal layer (the highest metal layer) next to bath, there is small negative current at cell center, i.e., small current flows center-ward. With the lowering of metal layers, the negative current density disappears gradually. This indicates that the horizontal current turns to flow sideward, which is embodied by positive current densities. Meanwhile, in the metal layers under anodes, the varying tendencies of current densities are very similar: all of them gradually increase to a maximum point fall down to zero. However, on the right side (outside) of anodes, the varying tendencies of current densities are somewhat different. Between anode edge and cell ledge (in side channel), current densities are negative, i.e., current flows inward. It can also be seen in Fig.4. This verifies that part of the current flows outward from anodes into bath and then into metal where it flows along the internal-arc surface of the ledge and finally converges to cathode surface. Hence, negative current density appears. Moreover, below half length of the anodes, current density increases with anode length, then decreases. It may be determined by the flowing patterns of current in aluminum reduction cell: current flows out of anodes into bath vertically (almost) and then into metal where it converges into cathodes and out of the cell from collector bars on cell sides. It is certain that the more the current flows toward cell side, the more vertical-oriented the current in metal pad and the less horizontal-oriented. Hence a maximum point will appear and the biggest current density is about 0.4A/cm2. As to its position, it is dependent on the length of anode as well as ledge profile. In this case, the highest point occurs at about 2/3 of anode length from cell center.
4.1.2 Ledge extends to below anodes
Jy and J distribution in Y-Z plane with longer (200mm) ledges are shown in Fig.5 and Fig.6 respectively.
From Fig.5, it can be seen that the first difference from case 4.1.1 is a smaller maximum current density and its corresponding Y-position moves center-ward: the biggest current density decreases to about 0.25A/cm2 and its position occurs at about 1/2 of anode length from cell center. The second difference is a bigger negative current density. This is certainly the result of a longer ledge forcing current to flow a longer reversal way as shown in Fig.6. In the meantime, except for the metal layer next to cathode, the lower the metal layer, the bigger the negative current density will be, because with the lowering of metal layer, more and more reversal current converges to ledge��s inside edges.
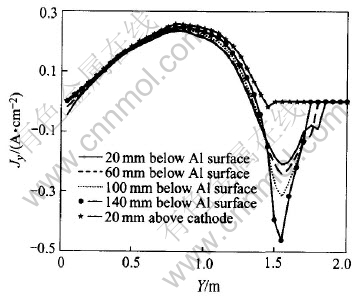
Fig.5 Jy in metal pad while ledge extends to below anodes
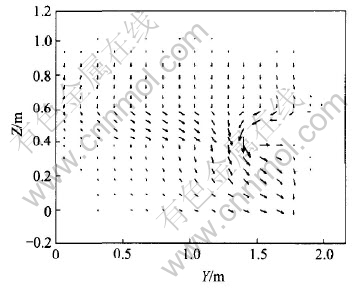
Fig.6 J distribution in Y-Z plane
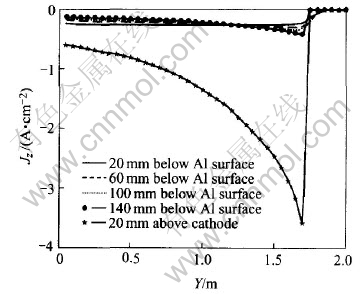
Fig.7 Jz in metal pad under normal conditions
4.2 Jz in metal pad
Jz tendency in metal pad along Y-direction is shown in Fig.7.
It can be seen from Fig.7 that with the lowering of metal layers, Jz increases with cathode length. Jz varies between about -0.1A/cm2 and -0.5A/cm2. This is also determined by the flowing patterns of current inside the cell. However, for Jz in the layer next to cathode, it increases sharply with cathode length. This is the result of top cathode layer��s influences on the current density in metal pad.
4.3 Current density in metal pad under different metal heights
To study the influences of metal height on current density distribution in metal pad, cases of metal height of 140mm and 200mm are studied respectively. For the same layers (same height from cell bottom) under the two different metal height, their current density tendencies are shown in Fig.8, Fig.9 and Fig.10, respectively.
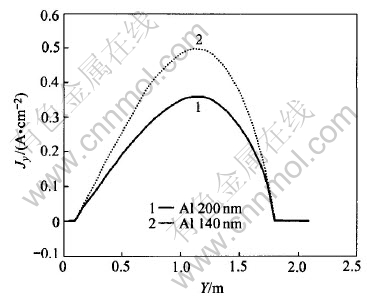
Fig.8 Jy under different metal heights
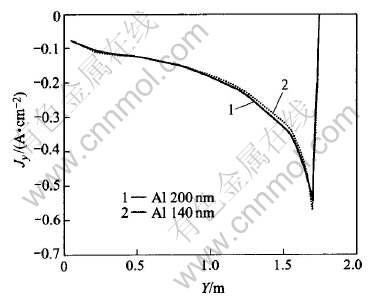
Fig.9 Jz under different metal heights
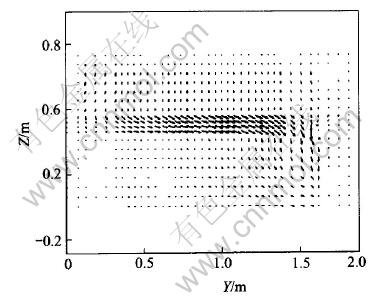
Fig.10 J distribution in Y-Z plane with metal height of 140mm
It can be seen from Fig.8 that in the same metal layer, the lower the metal height, the bigger the Jy will be. This can also be seen from Fig.10, in which current vectors are more horizontal-oriented than those in Fig.4 (metal height of 200mm). So, a lower metal height will cause bigger horizontal current in metal pad than that with a higher metal height. However, Fig.9 shows that Jz has almost nothing to do with metal height. Jz increases outwards, which just coincides with those in Fig.7.
4.4 Current density in metal pad with anode change (AC)
Anode change is one of the regular cell operations which often causes cell instability. To study the influences of anode change on current distribution, typically, current density field in metal pad is calculated while a corner anode is replaced. Here, suppose there is no current flowing through the newly changed anode. J distributions in X-Z and X-Y planes are shown in Fig.11 and Fig.12, respectively.

Fig.11 J distribution in X-Z plane with AC
Fig.12 J distribution in X-Y plane with AC
It is shown in Fig.11 and Fig.12 that because of AC, current distribution changes a lot in the whole metal: current tends to flow toward the metal under the newly changed anode. Hence, bigger horizontal current is triggered. While J distributions in the same X-Z and X-Y planes under normal conditions are shown in Fig.13 and Fig.14 respectively with the same two corner width. Compared with Fig.11 and Fig.12, current distributions under normal status are obviously different, in which current vectors usually parallel to coordinate axis in metal pad (Jx is negligible). To reduce the influences of anode change on cell operation, some methods, such as raising anode-cathode distance (ACD), are usually taken to offset them as supported by the result of case 4.3.
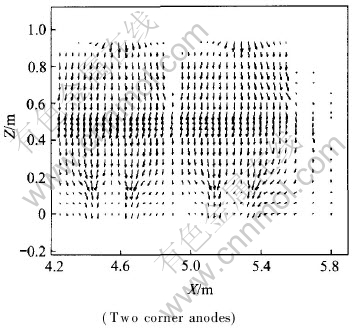
Fig.13 J distribution in X-Z plane under normal condition
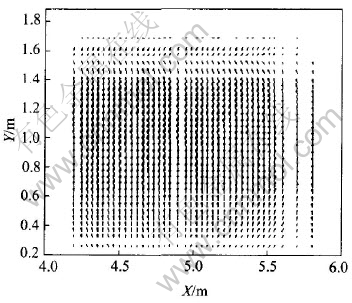
Fig.14 J distribution in X-Y plane
4.5 Current density in metal pad with anode spikes
Anode spikes seriously influence cell operations. Here current density distribution is studied with spike (300mm��300mm��25mm) on one anode. J distributions in X-Y and Y-Z planes are shown in Fig.15 and Fig.16 respectively. It can be seen from Fig.15 and Fig.16 that when there is an anode spike, the even current distribution is severely disturbed. More currents gather at spike and flow through it rather than evenly distribute on all anodes. This will surely cause operation uncertainties and even hot cell if it is not treated in time.
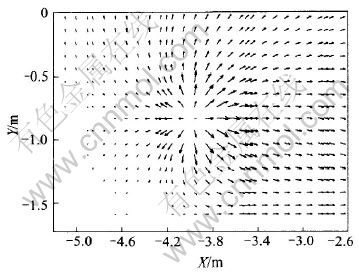
Fig.15 J distribution in X-Y plane with anode spike
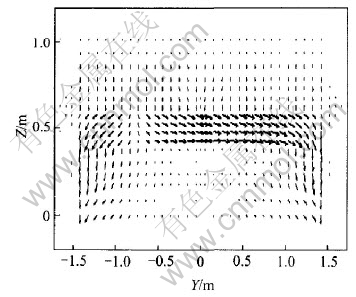
Fig.16 J distribution in Y-Z plane with anode spike
5 CONCLUSIONS
1) In the metal pad, Jy increases along anode length outward to a maximum and then decreases. A reversal current appears at the side of the cell. With the lowering of metal layers, Jy increases a little.
2) The longer the ledge length, the smaller the maximum of Jy and its corresponding Y-position moves center-ward. Meanwhile, the longer the ledge and the lower the metal layers, the bigger the reversal current density will be.
3) Jz in metal pad increases along anode length outward, but it is not affected by metal height. Jy increases with higher metal height. Under normal cell conditions, Jx can be neglected.
4) While at AC, current flows towards the metal under the newly replaced anode. Hence, bigger horizontal current will be triggered.
5) With anode spike, more currents flow out of anode and into metal at spike rather than evenly distribute under normal condition.
REFERENCES
[1]Tarapore E D. The effect of some operating variables on flow in aluminum reduction cells[A]. Light Metals [C]. Warrendale, Pennsylvannia, USA, TMS, 1981. 341-355.
[2]Arita Y, Ikeuchi H. Numerical calculation of bath and metal convection patterns and their Interface profile in Al reduction cells[A]. Light Metals [C]. Warrendale, Pennsylvannia, USA, TMS, 1981. 357-371.
[3]Robl R F. Metal flow dependence on ledging in hall-heroult cells[A]. Light Metals [C]. Warrendale, Pennsylvannia, USA, TMS, 1983. 449-456.
[4]Fraser K J, Billinghurst D, Chen K L, et al. Some applications of mathematical modelling of electric current distributions in hall heroult cells[A]. Light Metals [C]. Warrendale, Pennsylvannia, USA, TMS, 1989. 219-226.
[5]El-Demerdash M F, Khali E E, Ahmed H A, et al. Modelling of metal topography and flow regimes in working prebaked aluminum pot[A]. Light Metals [C]. Warrendale, Pennsylvannia, USA, TMS, 1993. 369-374.
[6]Zoric J, Rousar I, Thonstad J. Mathematical modeling of current distribution and anode shape in industrial aluminum cells with prebaked anodes[A]. Light Metals [C]. Warrendale, Pennsylvannia, USA, TMS, 1997. 449-454.
[7]MEI Chi. Simulation and Optimization for Non-ferrous Metal Kilns[M]. Beijing: Metallurgical Industry Press, 2001.
[8]MEI Chi, YOU Wang, WANG Qian-pu. On-line theoretical study of the internal ledge profile of reduction cells[J]. The Chinese Journal of Nonferrous Metals, 1998, 8(4): 695-699.(in Chinese)
[9]LI Jie, CHENG Ying-jun, ZHOU Nai-jun, et al. Simulation and optimization for thermo-electric prebaked anode cells[J]. The Chinese Journal of Nonferrous Metals, 2003, 13(2): 485-489.(in Chinese)
[10]CHENG Ying-jun, LI Jie, LAI Yan-qing, et al. Thermo-electric models of aluminum reduction cells and its applications[J]. Nonferrous Metals(Extractive Metallurgy), 2002, 52(6): 23-27.(in Chinese)
[11]LI Jing-jiang, QIU Zhu-xian. Computer simulation of cathode potential field of reduction cells[J]. Journal of Northeast Institute of Technology, 1989, 10(6): 591-595.(in Chinese)
[12]LIU Ye-xiang, LI Xiang-peng, LAI Yan-qing, et al. Heat balance of a drained aluminum reduction cell[J]. Trans Nonferrous Met Soc China, 2003, 13(5): 1199-1202.
[13]FENG Nai-xiang, SUN Yang, LIU Gang. The Thermal Field, Magnetic Field, Flow Field and their Numerical Calculation in Aluminum Reduction Cells(1st edition) [M]. Shenyang: NEU Press, 2001.(in Chinese)
[14]QI Xi-quan, FENG Nai-xiang. 3-D potential computation and analysis for aluminum reduction cell cathode[J]. Journal of Materials and Metallurgy, 2003, 2(2): 103-107.(in Chinese)
[15]QI Xi-quan, FENG Nai-xiang, CUI Jian-zhong. Simulation of current distribution in the metal of aluminum reduction cells[J]. Journal of Materials and Metallurgy, 2003, 2(3): 66-70.(in Chinese)
[16]QI Xi-quan, FENG Nai-xiang, CUI Jian-zhong. Dynamic simulation of current distribution in metal pad of reduction cells[J]. Nonferrous Metals (Quarterly), 2004, 53(3): 63-66.(in Chinese)
Foundation item: Project(50274031) supported by the National Natural Science Foundation of China
Received date: 2004-10-19; Accepted date: 2005-03-23
Correspondence: QI Xi-quan, PhD; Tel: +86-24-83686463; E-mail: qixiquan@yahoo.com.cn
