

Potential��pH diagrams of Cr-H2O system at elevated temperatures
YOU Hai-xia (�Ⱥ���)1, 2, XU Hong-bin(����)1, ZHANG Yi(�� ܲ)1,ZHENG Shi-li (֣ʫ��)1, GAO Yi-ying(����ӱ)1
1. National Engineering Laboratory for Hydrometallurgical Cleaner Production Technology, Beijing 100190, China;
2. Graduate School of the Chinese Academy of Sciences, Beijing 100039, China
Received 6 July 2009; accepted 30 December 2009
____________________________________________________________________________________________
Abstract:
The potential��pH diagrams of the Cr-H2O system at temperatures of 298, 323, 373 and 423 K were established through thermodynamic calculation with coupling of experimental results. The potential��pH diagram at 298 K agrees well with the previously reported results. Based on the potential��pH diagrams of the Cr-H2O and Fe-H2O systems, IR spectra and XRD pattern, the existence forms of iron in the potassium chromate were analyzed, and the methods of iron removal were investigated. The results show that the existence forms of iron in the potassium chromate are potassium ferrate. These results are instructive and helpful to the hydrometallurgical processing of chromite ore.
Key words:
Cr-H2O system; thermodynamic calculation; potential��pH diagram; iron removal; potassium chromate;
____________________________________________________________________________________________
1 Introduction
As a powerful tool in hydrometallurgy, potential��pH diagram obtains a wide application. In the process of leaching, purifying, oxidation and reduction, precipitation and dissolution, replacement of metal deposition and electrolytic refining, the potential��pH diagram is used for analyzing the physicochemical principle and determining the thermodynamic condition. In addition, the potential��pH diagram is also very important in the fields of analytical chemistry, mineral geology, biology, nuclear power technology and corrosion and anticorrosion of metal[1-8].
Unfortunately, the utilization of published diagrams is somewhat limited that they had been constructed at a single temperature and the thermodynamic data at higher temperatures are lacking in most cases. This article has done some work in order to extend the effect of the diagram. Based on the obtained data at lower temperatures, calculations using empirical formulas must be made to obtain the necessary data that can not be measured at higher temperatures.
2 Experimental
2.1 Thermodynamic calculation
The following half cell reaction represents a general electrochemical reaction. When the coefficient (n) of ��e�� is zero, Eq.(1) represents a chemical reaction.
aA+mH++ne=bB+cH2O (1)
where a, m, b and c are the stoichiometric coefficients for species A, H+, B, and H2O in the electrochemical reaction, respectively; and n is the electron transfer number of the electrode reaction. In dilute solution, when ![]() for the activity of water, the equilibrium potential can be simplified as follows according to the Nernst isothermal equation:
for the activity of water, the equilibrium potential can be simplified as follows according to the Nernst isothermal equation:
![]()
![]() (2)
(2)
where ET or ![]() is the electrochemical potential or standard electrochemical potential for reaction at a certain temperature T ; F is the Faraday��s constant and R is the molar gas constant; and aA or aB is the overall activity of species A or B.
is the electrochemical potential or standard electrochemical potential for reaction at a certain temperature T ; F is the Faraday��s constant and R is the molar gas constant; and aA or aB is the overall activity of species A or B.
The relationship between the potential and pH value is shown explicitly.
![]() (3)
(3)
where ![]() is the standard free energy of reaction at temperature T, and K is the reaction equilibrium constant. From Eq.(2), we can obtain the diagram of potential��pH curves at a certain temperature as long as whenever
is the standard free energy of reaction at temperature T, and K is the reaction equilibrium constant. From Eq.(2), we can obtain the diagram of potential��pH curves at a certain temperature as long as whenever ![]() , K and
, K and ![]() can be known.
can be known.
2.2 Thermodynamic calculation of high-temperature aqueous solution method selection
At arbitrary temperature and pressure, the standard free energy of substance formation can be calculated through the relationship of the thermodynamic parameters.
![]()
![]() (4)
(4)
where ![]() (T) is the standard free energy of formation at a certain temperature T ; at 573 K, the volume V is believed to have small impact, and
(T) is the standard free energy of formation at a certain temperature T ; at 573 K, the volume V is believed to have small impact, and ![]() can be neglected, p0=1.01��105 Pa;
can be neglected, p0=1.01��105 Pa; ![]() is the standard entropy of substance in 298 K, cp is the constant-pressure molar heat capacity of substance in the temperature range from 298 K to T, and can be expressed as follows:
is the standard entropy of substance in 298 K, cp is the constant-pressure molar heat capacity of substance in the temperature range from 298 K to T, and can be expressed as follows:
![]() (5)
(5)
where xi(i=0, 1, 2, 3) is a constant. Therefore, as long as the values of ![]() and cp are obtained, the standard free energy of formation can be calculated from Eq.(4).
and cp are obtained, the standard free energy of formation can be calculated from Eq.(4).
2.3 Correspondence principle
Based on many results of experiments, CRISS[9-11] summarized a correspondent principle as follows:
![]() (6)
(6)
where ![]() refers to the ionic entropies on the absolute scale at 298 K; aT and bT refer to the constants at a certain temperature T.
refers to the ionic entropies on the absolute scale at 298 K; aT and bT refer to the constants at a certain temperature T.
3 Results and discussion
3.1 Potential��pH diagrams of Cr-H2O system at elevated temperature
The data of the thermodynamic calculation in this paper are obtained from Refs.[12-16] except as otherwise indicated, and the thermodynamic data of the main substances in Cr-H2O system are listed in Table 1.
Table 1 Thermodynamic data of main substances in Cr-H2O system

In Table 1, ![]() is the standard Gibbs free energy of formation at 298 K; and
is the standard Gibbs free energy of formation at 298 K; and ![]() is the third law entropy at 298 K; and
is the third law entropy at 298 K; and ![]() is the standard specific heat capacity.
is the standard specific heat capacity.
The various considered reactions are listed in Table 2. The diagrams for other values of activity and pressure can be easily obtained by pH��potential functions listed in Table 2. The pH potential relations are shown in Figs.1-4.
Table 2 Electrode reaction and standard potential value (�� refers to pH value in standard state)
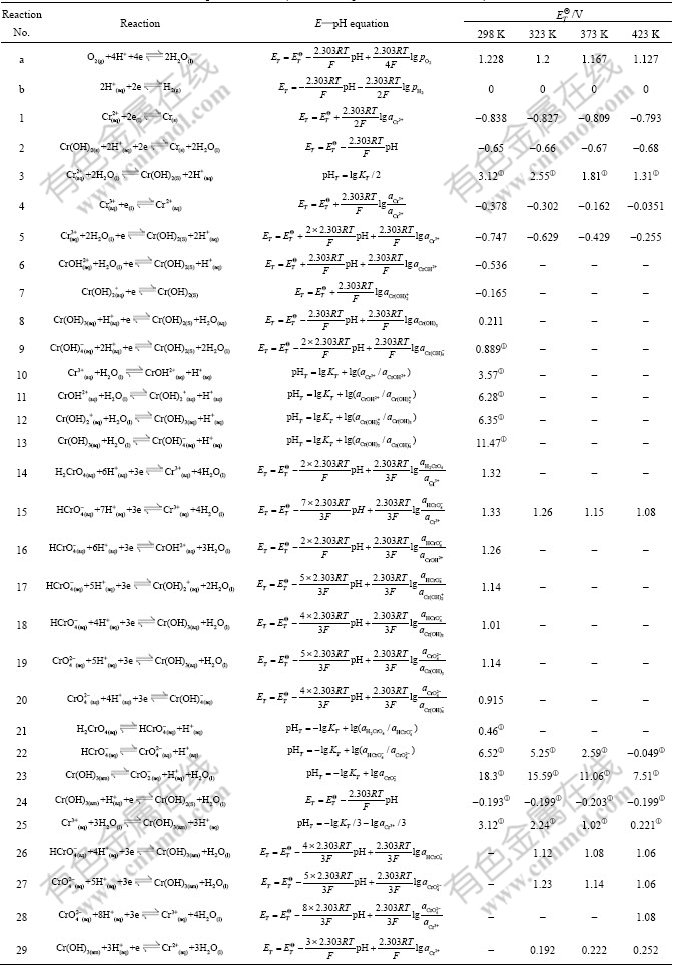
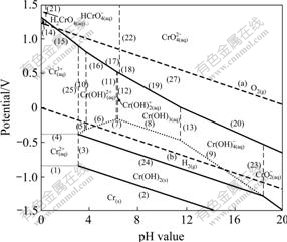
Fig.1 Potential��pH diagrams of Cr-H2O system at 298 K
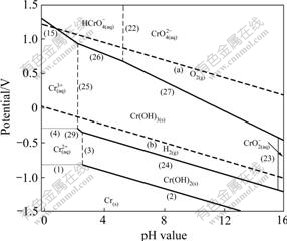
Fig.2 Potential��pH diagrams of Cr-H2O system at 323 K
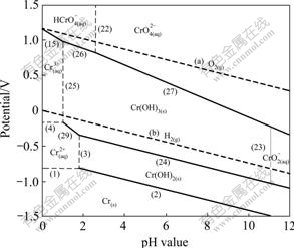
Fig.3 Potential��pH diagrams of Cr-H2O system at 373 K

Fig.4 Potential��pH diagrams of Cr-H2O system at 423 K
The potential��pH diagram at 298 K agrees well with the previously reported results in Ref.[12]. The principal effects of temperatures can be summarized as follows.
1) The Cr/Cr2+ equilibrium is seldom affected in the temperature range of 298-423 K.
2) The stability region for the Cr2+ and Cr3+ decreases, and the stability region for the ![]() and
and ![]() increases.
increases.
3) The stability of Cr(OH)3 increases apparently in low pH value region. However, in high pH value region its stability decreases.
3.2 Forms of iron in potassium chromate and methods of iron removal
3.2.1 Forms of iron in potassium chromate
The pH��potential dagrams[12-17] are plotted in Fig.5. It can be seen that, when the pH value is higher than 7.0, the line of FeO42-/Fe(OH)3 equilibrium is higher than that of CrO42-/Cr(OH)3 equilibrium. The FeO42- ion demonstrates stronger oxidative performance than the CrO42- ion, and the two ions can coexist in the alkaline solutions.
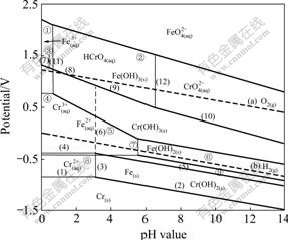
Fig.5 Potential��pH diagrams of Cr-H2O system and Fe-H2O system at 298 K (��-�� are reactions of Fe-H2O system; (1)-(12) are reactions of Cr-H2O system)[12-17]
Fig.6 shows the IR spectra of the high pure potassium ferrate[18]. The wide and strong peak at (807��3) cm-1 is the characteristic absorption peak of the anti-symmetric stretch vibration of iron-oxygen bond, and the weak peak at (1 110��5) cm-1 is stretch vibration characteristic peak of the iron-oxygen bond. From the FT-IR spectra of the potassium chromate product from the demonstration plant shown in Fig.7, the characteristic peak of iron-oxygen bond appears at 1 110 cm-1. Because of the effect of the strong characteristic peak of potassium chromate which is the main component at 880 cm-1, the anti-symmetric stretch vibration peak of iron- oxygen bond of a spot of potassium ferrate is shaded.

Fig.6 IR spectra of high pure K2FeO4

Fig.7 FT-IR spectra of reagent K2CrO4 and demonstration K2CrO4
Fig.8 shows the XRD pattern with some peaks of potassium ferrate. It can be concluded that the iron in the potassium chromate product from our demonstration plant exists in the form of potassium ferrate.
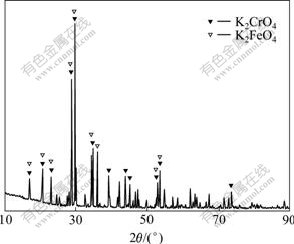
Fig.8 XRD pattern of demonstration K2CrO4
3.2.2 Method of iron removal
The above analysis indicate that the potassium ferrate may exist in the potassium chromate. The decomposition of ferrate ion is given by the following reaction.
![]() ��Fe(OH)3+O2��+OH- (7)
��Fe(OH)3+O2��+OH- (7)
Based on the thermal instability (see Eq.(7)) and photolysis of potassium ferrate, a method is brought forward that potassium ferrate can be removed by the sequential process of heat dissolution, laying in light, filtration and re-crystallization. Fig.9 shows the removal rate of iron by re-crystallization. In the experiment two samples of potassium chromate with iron contents of 1.04 % and 0.74% are respectively dissolved and heated and laid in light for 60 min. The separating experiment results show that the content of iron drops under the detection line.

Fig.9 Removal rate of iron by re-crystallization
4 Conclusions
1) The Cr/Cr2+ equilibrium is not much affected in the temperature range of 298-423 K. The stability region for the Cr2+ and Cr3+ ions decreases, and the stability region for the ![]() and
and ![]() ions increases. There is a considerable increase in the stability of Cr(OH)3 in low pH value region. However, in high pH value region its stability decreases.
ions increases. There is a considerable increase in the stability of Cr(OH)3 in low pH value region. However, in high pH value region its stability decreases.
2) The pH��potential dagrams, IR sepctra, and XRD pattern show that K2FeO4 and K2CrO4 can coexist under alkaline condition. Based on the thermal instability and photolysis of potassium ferrate, a method is brought forward that potassium ferrate can be removed by the sequential process of heat dissolution, laying in light, filtration and re-crystallization. The iron content of potassium chromate, after laying in light for 60 min, drops under the detection line.
References
[1] LINKSON P B, PHILLIPS B D, ROWLES C D. Computer methods for the generation of Eh��pH diagrams [J]. Min Sci Eng, 1979, 11(2): 65-79.
[2] ANGUS J C, ANGUS C T. Computation of Pourbaix diagrams using virtual species: Implementation on personal computers [J]. J Electrochem Soc, 1985, 132(5): 1014-1019.
[3] ANGUS J C, LU B, ZAPPIA M J. Potential��pH diagrams for complex systems [J]. J Appl Electrochem, 1987, 17(1): 1-21.
[4] YOKOKAWA H, SAKAI H, KAWADA T, DOKIYA M. Generalized electrochemical potential diagrams for complex aqueous(M-X-H-O-e-) systems [J]. J Electrochem Soc, 1990, 137(2): 388-398.
[5] ANDERKO A, SANDERS S J, YOUNG R D. Real-solution stability diagrams: A thermodynamic tool for modeling corrosion in wide temperature and concentration ranges [J]. Corrosion, 1997, 53(1): 43-53.
[6] THOMPSON W T, KAYE M H, BALE C B, PELTON A D. In Uhlig��s corrosion handbook [M]. New York: John Wiley & Sons, 2000: 125-126.
[7] KINNIBURGH D G, COOPER D M. Predominance and mineral stability diagrams revisited [J]. Environ Sci Technol, 2004, 38(13): 3641-3648.
[8] FISHTIK I. Thermodynamic stability relations in redox systems [J]. Environ Sci Technol, 2006, 40: 1902-1910.
[9] CRISS C M, COBBLE J W. The thermodynamic properties of high temperature aqueous solutions. IV. Entropies of the ions up to 200�� and the correspondence principle [J]. J Am Chem Soc, 1964, 86(24): 5385-5390.
[10] TAYLOR D F. Thermodynamic properties of metal-water systems at elevated temperatures [J]. Journal of the Electrochem Society, 1978, 125(5): 808-812.
[11] YANG X W, HE A P, YUAN B Z, HU H. The thermodynamic calculation in high-temperature aqueous solution [J]. Nonferrous Metals: Extractive Metallurgy, 1979(6): 27-37.
[12] BALL J W, NORDSTROM D K. Critical evaluation and selection of standard state thermodynamic properties for chromium metal and its aqueous ions, hydrolysis species, oxides, and hydroxides [J]. Journal of Chemical and Engineering Data, 1998, 43(6): 895-918.
[13] LIANG Ying-jiao, CHE Yin-chang. Handbook of inorganic thermodynamics [M]. Shenyang: Northeastern University Press, 1993. (in Chinese)
[14] ZHONG Z Q, MEI G G. Application of diagrams of chemical potential in hydrometallurgy and purification of waste water [M]. Changsha: Central South University of Technology Press, 1986. (in Chinese)
[15] FENDORF S, LA FORCE M J, LI Guang-chao. Heavy metals in the environment-temporal changes in soil partitioning and bioaccessibility of arsenic, chromium and lead [J]. Journal of Environmental Quality, 2004, 33(6): 2049-2055.
[16] BARNER H E, SCHEUERMAN R V. Handbook of thermochemical data for compounds and aqueous species [M]. New York: John Wiley & Sons, 1978: 41-73.
[17] WOOD R H. The heat free energy and entropy of the ferrate (VI) ion [J]. Journal of the American Chemical Science, 1958, 80(9): 20-38.
[18] PEI Hui-xia. Study on stability and preparation of potassium ferrate (VI) [D]. Taiyuan: Taiyuan University of Technology, 2007: 40-41. (in Chinese)
______________________________
Foundation item: Project(2007CB613501) supported by the National Basic Research Program of China; Project(2006BAC02A05) supported by the National Science and Technology Pillar Program of China; Project(50904058) supported by the National Natural Science Foundation of China
Corresponding author: XU Hong-bin; Tel: +86-10-82627096; Fax: +86-10-82621022; E-mail: ipecas_hbxu@263.net
