
J. Cent. South Univ. (2017) 24: 114-126
DOI: 10.1007/s11771-017-3414-z

Online residual useful life prediction of large-size slewing bearings��A data fusion method
FENG Yang(����), HUANG Xiao-diao(�����), HONG Rong-jing(���پ�), CHEN Jie(�½�)
Jiangsu Key Laboratory of Digital Manufacturing for Industrial Equipment and Control Technology
(School of Mechanical and Power Engineering), Nanjing Tech University, Nanjing 210009, China
 Central South University Press and Springer-Verlag Berlin Heidelberg 2017
Abstract:
To decrease breakdown time and improve machine operation reliability, accurate residual useful life (RUL) prediction has been playing a critical role in condition based monitoring. A data fusion method was proposed to achieve online RUL prediction of slewing bearings, which consisted of a reliability based RUL prediction model and a data driven failure rate (FR) estimation model. Firstly, an RUL prediction model was developed based on modified Weibull distribution to build the relationship between RUL and FR. Secondly, principal component analysis (PCA) was introduced to process multi-dimensional life-cycle vibration signals, and continuous squared prediction error (CSPE) and its time-domain features were employed as equipment performance degradation features. Afterwards, an FR estimation model was established on basis of the degradation features and relevant FRs using simplified fuzzy adaptive resonance theory map (SFAM) neural network. Consequently, real-time FR of equipment can be obtained through FR estimation model, and then accurate RUL can be calculated through the RUL prediction model. Results of a slewing bearing life test show that CSPE is an effective indicator of performance degradation process of slewing bearings, and that by combining actual load condition and real-time monitored data, the calculation time is reduced by 87.3% and the accuracy is increased by 0.11%, which provides a potential for online RUL prediction of slewing bearings and other various machineries.
Key words:
slewing bearing; life prediction; Weibull distribution; failure rate estimation; data fusion��
1 Introduction
Large-size slewing bearings are critical rolling rotational connections used in heavy machineries. They are not very expensive themselves, but an unexpected break down and replacement may bring great loss to an enterprise. Therefore, accurate RUL prediction of slewing bearings can help enterprises to make timely proactive maintenance schedules and avoid catastrophic incidents. There are basically two kinds of methods for RUL prediction: one is the conventional method, which uses history and event data to generate a life prediction model with a proper method; the other is the data driven method, which builds a prediction model based on condition monitoring data (CMD).
Generally speaking, conventional methods include two kinds of models: models built based on modified ISO 281 and models built based on statistical approaches. On one hand, POTOCNIK et al [1-3] combined strain-life theory and ISO 281 to calculate the fatigue life using finite element method (FEM). However, given the large size of a slewing bearing, the finite element method can be time-consuming and not reliable. GAO et al [4] developed a modified ISO 281 model to evaluate rolling contact fatigue (RCF) reliability of slewing bearings, which took into consideration the contact load, the geometric parameters of contact pairs and so forth. But the detailed parameters estimation procedures were not given. On the other hand, SHIMIZU [5] built a life model using a three-parameter Weibull distribution, and an S-N curve was obtained accordingly. Besides, ROBINSON [6] proposed a universal statistical model based on a bivariate Weibull distribution to forecast the RCF life under hundreds of observations, and pointed out that the Weibull distribution parameters could be constantly modified with more history data. As known to all, the parameters estimation of a statistical model usually requires large amount of history or event data, i.e., a lot of life experiments need to be conducted. However, given the size and the heavy load of a slewing bearing, it is unacceptable both in terms of cost and time to implement a batch of life tests. More important, all the above RUL prediction models focus on factors such as geometry parameters, materials, and load conditions, the influence of occasional factors (such as sudden load change, environmental variation, and maintenance) on the performance degradation procedure of a slewing bearing is not considered, which makes conventional models not suitable for online life prediction.
In contrast, data driven RUL prediction models can adjust to online prediction properly. A typical data driven model includes an offline training model and an online prediction model, in which the performance degradation features extraction and RUL prediction modeling are two critical steps. Since the rotational speed of a slewing bearing is very low, commonly used signal processing methods can hardly be applied to such unstable signals. CAESARENDRA et al [7] transformed vibration signals from time domain to circular domain, and used four circular-domain features to identify the slight changes of bearing condition. However, they also pointed out that the circular-domain features are unable to assess the failure degradation trend. In addition, largest Lyapunov exponent (LLE) was introduced to extract features in slewing bearing condition monitoring, and better results than time-domain features were obtained [8]. Nevertheless, the fluctuation of LLE is relatively high, and thus it can not be directly used for RUL prediction modeling. Moreover, BENKEDJOUH et al [9] used ISOMAP to reduce the features dimensionality, and employed SVR to build an online RUL prediction model, which was similar to the works described in Refs. [10-12]. Besides, KIM et al [13] divided the bearing condition into several health states, and calculated the RUL with real-time estimated health state and history failure data. ALI et al [14] used SFAM to predict real-time degradation level, and then obtained the RUL with a smoothing algorithm. In general, typical online data driven RUL prediction models firstly trained an offline model based on historical CMD and real RUL obtained from an experiment, and then used real-time CMD to achieve online prediction. In other words, an offline model was usually built based on one or just several load cases. However, a practical load case can be very random, and different load cases will lead to different service lives, which makes the offline model not accurate in most engineering practices.
It can be observed from the above that conventional methods can not be directly used for online prediction, while the offline model of a data driven method is not suitable for different practical load cases. Therefore, the main aim of the present research was to address these challenges, and a novel data fusion method for online RUL prediction of slewing bearings was proposed. The proposed method took both reliability and real-time CMD into consideration by combining a modified Weibull distribution with an FR estimator, which was finally validated by a life-cycle test.
2 Background knowledge
2.1 Weibull distribution
There is a variety of failure modes for mechanical components, but the life distribution of the same type components may be in accordance with a certain statistics. Weibull distribution, among the most widely used models, was proposed by WEIBULL [15] in 1951 while he was studying the fatigue lives of ball bearings. For a Weibull random variable T, the probability density function is presented as
 t�ݦ� (1)
where �� is the shape parameter, �� is the scale parameter, and �� is the location parameter.
By integrating Eq. (1), the cumulative failure probability function for the Weibull distribution can be obtained as
 t�ݦ� (2)
Therefore, the reliability function is computed as
 t�ݦ� (3)
As a quality measure with a time attribute, equipment reliability reflects the ability to perform certain functions under specific conditions in a given period of time. To quantify this measure, reliability index, cumulative failure probability, FR and mean time between failures (MTBF) are commonly used indicators to describe the equipment reliability. Among these, FR represents the failure rate of equipment at time t, which can be calculated as
 t�ݦ� (4)
Apparently, as time goes by, the reliability of an equipment decreases from 1 to 0 while ��(t) increases from 0 to 1. Therefore, �� is usually greater than 1 in a performance degradation model.
2.2 PCA
PCA de-correlates variables through extraction of linear relationships between variables, and uses several unrelated components to represent all variables. For matrix X(p��q), where p represents the number of samples and q stands for the number of variables, PCA decomposes it into principal components space and residual subspace:
 (5)
(5)
where bj (p��1) is the j-th principal component (PC), kj (q��1) stands for the j-th load vector, and E represents the residual error. X can also be presented as
 (6)
(6)
where B(p��r) is the principal component matrix, and K(q��r) is the load matrix.
Therefore, the projection on residual space is:
 (7)
(7)
To implement condition monitoring, most PCA based schemes use two typical statistical indices: Hotelling��s T2 and squared prediction error (SPE, ESP), also known as Q statistic. According to Ref. [16], SPE can better demonstrate the differences between new datasets and the original dataset. Meanwhile, it would be seen as abnormality if the overall trend of the vector SPE is greater than its threshold Q��, and they can be calculated by
 (8)
(8)
 (9)
(9)
where c�� is the standard normal deviate corresponding to the upper (1-��) percentile, h0=1-2��1��3/3��22, ��d= for d=1, 2, 3, and ��j is the j-th eigenvalue of the variance�Ccovariance matrix of input data X.
2.3 SFAM neural network
Adaptive resonance theory map (ARTMAP) neural network is a supervised learning system proposed by CARPENTER and GROSSBERG [17] in 1991. By combining fuzzy theory with ARTMAP, the fuzzy ARTMAP may accept analog fuzzy input with component values between 0 and 1. In addition, the fuzzy ARTMAP is also a fast incremental learning system, which can learn continuously without forgetting what it has previously learned. In 1993, VENKATESAN and SURESH [18] proposed the SFAM through replacing the original ARTb layer by complement coding, which increases the computational efficiency and reduces the complexity of the architecture.
A typical SFAM neural network is illustrated in Fig. 1, which consists of an ART network cell ARTa and a mapping field Fab. The ARTa contains three layers: input layer F0, matching layer F1 and competitive layer F2. The activity patterns of layers F1 and F2 are fully interconnected. Each neuron is initially connected to every neuron on the other layer. All connections are weighted by synaptic weights lying between 0 and 1. To begin with, the normalized input vector I is obtained by F0, and then F2 is used to select the category that is the most similar to the input X. Meanwhile, F1 is designed to decide the similarity between the input I and the weight vector W. Finally, the Fab layer is connected with the competitive layer F2 by the Wab weights to determine the appropriate class result of the input vector. More detailed information please refer to Refs. [14, 17, 18]. In a word, compared with commonly used machine learning techniques such as support vector machine (SVM) [19], SFAM has a much faster speed of convergence, and thus it is very suitable for online computation. Therefore, the current study is based on the potential use of SFAM network for the FR estimation modeling.
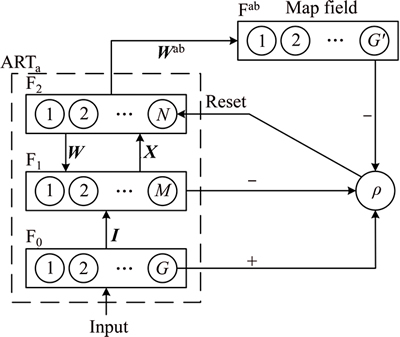
Fig. 1 A typical SFAM neural network
3 Methodology
3.1 Overall description of proposed method
The proposed method focuses on accurate online RUL prediction of slewing bearings by taking into account actual load conditions and real-time CMD. As illustrated in Fig. 2, two critical steps are presented: offline modeling and online RUL prediction, where R denotes reliability. In the offline step, a reliability based RUL prediction model is established based on modified Weibull distribution, and a failure rate (FR, Rf) estimation model is built on basis of extracted degradation features. The parameters of both models are evaluated by a run-to failure life test. In the online step, features that extracted from CMD are used to obtain real-time FR, and thus RUL can be calculated by the estimated FR and the RUL prediction model. A detailed description of the proposed methodology is given as follows.
3.2 Reliability based RUL prediction model
For decades, Weibull distribution has been used in a variety of researches concerning bearing fatigue life.
Therefore, in this work, Weibull distribution is used to establish the RUL prediction model, i.e., to build the relationship between RUL and FR. It is widely accepted that the fatigue life of a ball bearing conforms to a two-parameter Weibull distribution [20], hence the cumulative failure probability function can be simplified as
 (10)
(10)
and the reliability function is
 (11)
(11)
where the shape parameter �� (��>0) stands for Weibull slope and the scale parameter �� (��>0) represents characteristic life.
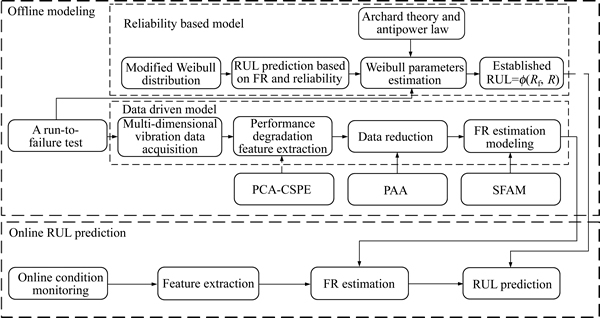
Fig. 2 Framework of the proposed method
The fatigue cracks and spalls caused by alternating stress cycles occurred in the raceway are the main reasons of a slewing bearing failure, which increase proportionally with the turning laps of a slewing bearing. If a slewing bearing has been turned t (t��0) laps and still performs well, it can be called a t-lap slewing bearing. Therefore, the RUL Tt of a t-lap slewing bearing can be defined as the residual turning laps when a t-lap slewing bearing runs to failure. For any x (x��0), the probability that Tt��x can be calculated from
 (12)
(12)
By combining Eq. (11) and Eq. (12), Ft(x) can also be computed as


 (13)
(13)
Afterwards, the RUL probability distribution function of a t-lap slewing bearing can be represented as Eq. (14) according to Eqs. (11) and (13).

 (14)
(14)
Therefore, the reliability for a t-lap slewing bearing to have a residual life of x turning laps can be obtained as
 (15)
(15)
Consequently, the RUL x of a t-lap slewing bearing under probability Rt(x) can be expressed as
 (16)
(16)
Meanwhile, as presented in Eq. (4), the relationship between failure rate ��(t) and turning laps t can also be described as
 (17)
(17)
Finally, the reliability based RUL prediction model is established by combining Eqs. (16) and (17):
 (18)
(18)
It can be observed that once the Weibull parameters are determined, the RUL x depends only on ��(t) and Rt(x). In fact, the Rt(x) here can be regarded as a confidence factor, under the same case, the higher the Rt(x), the lower the RUL x. As a result, Rt(x) is usually set between 0.85 to 0.99 in practice, and thus the RUL is only related to ��(t). In other words, if real-time ��(t) can be obtained, the accurate RUL can be calculated accordingly.
In addition, the effect of Weibull parameters on the relationship between RUL and FR is studied and exhibited in Fig. 3. It can be seen from both Figs. 3(a) and (b) that FR increases gradually as RUL decreases rapidly in the early stage, while it takes only 10% of the entire life time for the FR to increase from 50% to 90%. As a matter of fact, this phenomenon is in accordance with a typical bearing performance degradation process. Specifically, a bearing runs steadily and the FR keeps low in both the run-in period and the normal service period, while it is very close to a complete failure after a critical fault occurs. Therefore, the proposed RUL prediction model is close to engineering practice, and can be used for accurate RUL prediction.
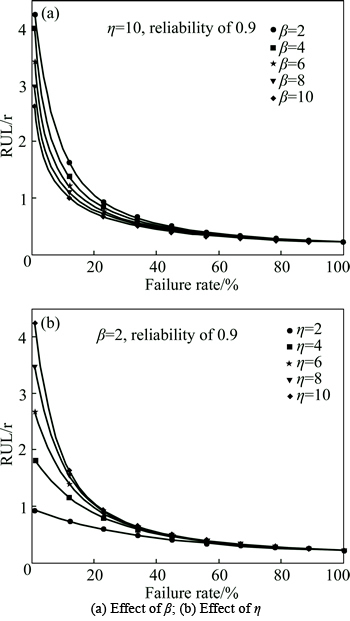
Fig. 3 Effect of Weibull parameters on relationship between RUL and FR:
Besides, it can be seen from Figs. 3(a) and (b) that the RUL decreases faster as �� increases while the initial RUL increases drastically as �� grows, and that is why �� and �� are named as shape factor and characteristic life respectively in Weibull distribution.
3.3 FR estimation model
The general procedure of failure rate estimation modeling is illustrated in Fig. 2. To begin with, multi-dimensional vibration signals are acquired, and then performance degradation features are extracted by a novel method. Finally, the features and their relevant FRs are used to build an FR estimation model.
In terms of performance degradation feature extraction, it should be noted that the diameter of a large size slewing bearing is usually 800 to 5000 mm, and multi-dimensional vibration signals can better describe a slewing bearing condition than one dimensional signal [21, 22]. However, current feature extraction methods [9-13] focus on time-domain, frequency-domain and time-frequency domain features, which may bring dimensional disasters if directly applied to multi- dimensional cases. In contrast, PCA is a robust tool to achieve dimensionality reduction, and SPE can effectively demonstrate the difference (abnormity) between new dataset and normal dataset. Therefore, PCA is introduced to process multi-dimensional signals, and CSPE and its time-domain features are employed as the performance degradation features. Specifically, taking four-group vibration signals aI, aII, aIII and aIV for example, each group of signal is firstly divided into Z segments according to a certain time period, and then the z-th (z��[1, Z])) segments of all four-group signals are combined into a matrix Az:
 (19)
(19)
Afterwards, a PCA model is established based on A1, and then A1, A2, A3, ��, AZ are projected onto the PCA model to obtain SPE respectively. As a result, by connecting every SPE, CSPE can be acquired and used as the input of the FR estimation model.
To determine the output of the FR estimation model, Fig. 4 shows two ways to calculate the FR from a degradation feature curve. A typical calculation approach [14] is shown in Fig. 4(a), where FR changes linearly with time, regardless of the amplitude of the degradation feature. In contrast, the proposed calculation method is demonstrated in Fig. 4(b), where FR is the result of the feature amplitude divided by its maximum amplitude.Apparently, the FR trend shown in Fig. 4(b) is more consistent with the description of a bearing degradation process and the discussions given in Section 3.2. Therefore, the FR here is determined as shown in Fig. 4(b).
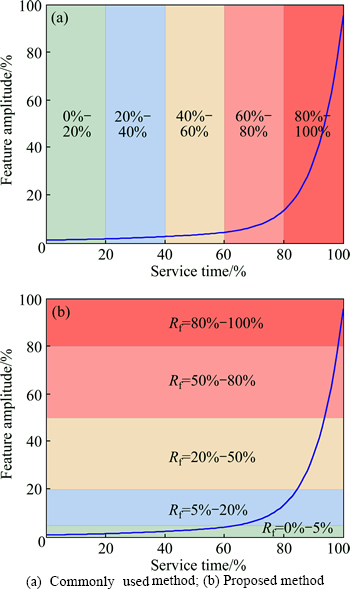
Fig. 4 Two methods to calculate FR:
Moreover, it should also be noted that both the degradation features and the FRs are extracted from vibration signals, which contain a large amount of data. It will occupy too much computation time if they are directly used for training the FR estimation model. Hence, the data length of the features should be reduced in advance. Piecewise aggregate approximation (PAA), firstly developed by YI and FALOUTSOS [23], is a data reduction technique for large time series data whilst keeping its characteristic. For a data sequence y=(y1, y2, ��, yL) with L number of data points, PAA divides y into several segments, and the mean value of each segment and the vector of these mean values becomes the PAA result.
Consequently, the reduced CSPE time-domain features are introduced as input, and the relevant FRs are regarded as output, an FR estimation model can be trained utilizing SFAM.
3.4 Online RUL prediction
With the two models built in Section 3.2 and Section 3.3, online RUL prediction becomes possible for slewing bearings. In practice, Weibull parameters �� and �� of the RUL prediction model are firstly decided by the actual load condition of a slewing bearing, and then real-time FR can be obtained by the FR estimation model using CMD. Finally, online RUL can be predicted according to the real-time FR and the RUL prediction model. The core merit of the proposed method is the combination of practical load condition and real-time CMD, and hence it is also named as a data fusion method. In addition, the proposed method overcomes the disadvantage of current methods that only one aspect is considered. Therefore, it has the potential to provide more accurate and robust online RUL prediction.
4 Experimental validation and discussion
4.1 Experimental setup and results
To evaluate the performance of the proposed method, a home-made test rig was developed to implement an experiment. The prototype of the test rig is shown in Fig. 5, where G1, G2 and G3 are hydraulic rams to apply axial force, radial force and turnover movement to a tested slewing bearing, and G4 is the hydraulic motor to drive the accompanied slewing bearing. More detailed information of the test rig can be found in Table 1.
The main tested slewing bearing, QNA-730-22, is an inner-geared slewing bearing, of which the inner ring is the rotatable ring, the outer ring is the fixed ring, and the main properties are shown in Table 2. To implement an experiment on such a slewing beating, some improvements are made to the test rig. With the frocks shown in Fig. 6, the inner ring (with gears) of the main tested slewing bearing is connected with the outer ring of the accompanied slewing bearing, and the outer(fixed) ring of the main tested slewing bearing is fixed with the upper flange.
Afterwards, as shown in Fig. 7, extreme loads are applied to the main tested slewing bearing and the experiment starts at a constant rotational speed of 4 r/min.
Meanwhile, to implement condition monitoring, as illustrated in Fig. 7, four 495 mV/g Kistler-8395A010 accelerometers a1-a4 were mounted along the radial direction of the slewing bearing for vibration measurement, and the vibration signals are collected by a high-accuracy data acquisition (DAQ) module NI PXIe- 4492 at a sampling rate of 2 kHz. Besides, to assist monitoring the slewing bearing condition, the grease temperature, driven torque and rotational speed are also measured by NI PXI-6238 at a sampling rate of 10 Hz. What is more, the main data acquisition (DAQ) system, NI PXIe-1062Q collected all the data from both PXIe-4492 and PXI-6238 through a LabVIEW interface. The schematic of the DAQ system is shown in Fig. 8.
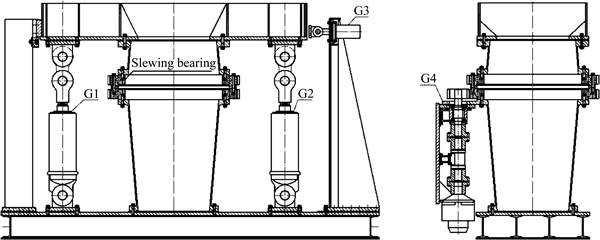
Fig. 5 Prototype of slewing bearing test rig
Table 1 Capability of test rig

Table 2 Properties of main tested slewing bearing

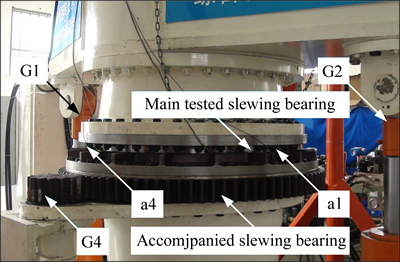
Fig. 6 Picture of slewing bearing test rig
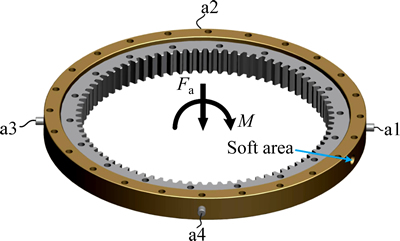
Fig. 7 Applied loads and distribution of four accelerometers
The test stops when the slewing bearing gets stuck and comes to a critical failure after 11 d, and the final amount of the revolutions of the slewing bearing is 6.33��104. Figures 9(a) and (b) show the trends of thegrease temperature and the driven torque respectively. It should be specially explained that, to study the slewing bearing condition when its fatigue life reaches the Chinese standard [24] of 30000 r, the test is suspended and the tested slewing bearing is maintained on the 7th day, and that is the reason that both the grease temperature and the driven torque decrease after the 7th day. Besides, Fig. 9 also illustrates that both the grease temperature and the driven torque increase dramatically after the 9th day until the slewing bearing comes to a critical failure. In addition, Fig. 10(a) shows the slip zone occurred in the outer ring raceway of the tested slewing bearing on the 7th day, while Figs. 10(b) and (c) show the damaged outer ring and the cracked balls respectively when the slewing bearing gets stuck.
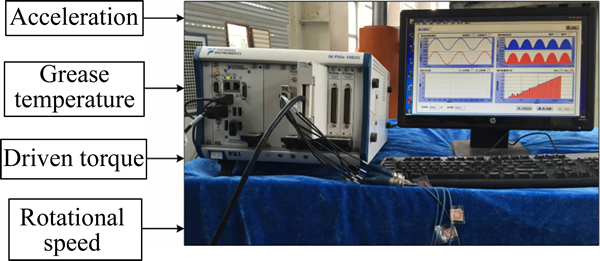
Fig. 8 DAQ system schematic diagram
4.2 RUL prediction and discussion
After the experiment, the main tested slewing bearing is disassembled and the outer ring raceway is divided into several segments. Then the wear volume of each segment is obtained through scanning the change of the raceway cross section before and after the experiment. By doing so, the Weibull parameters can be determined using Archard theory and anti-power law model [20]. The detailed procedures and the validation of the results are presented in our earlier work [25] and hence will not be thoroughly described here. In a word, the determination of Weibull parameters �� and �� depends on the type of slewing bearing and actual load condition, which makes the RUL prediction model suitable for any practical load cases. Consequently, the reliability based RUL prediction model is obtained as

 (20)
(20)
where ��(t) is the real time FR and Rt(x) is defined as a time-independent confidence factor. Once Rt(x) is set, RUL x is only related to ��(t). In other words, if real-time ��(t) can be obtained, the accurate RUL can be calculated accordingly. Therefore, a real time FR estimation model is required to achieve online RUL prediction.
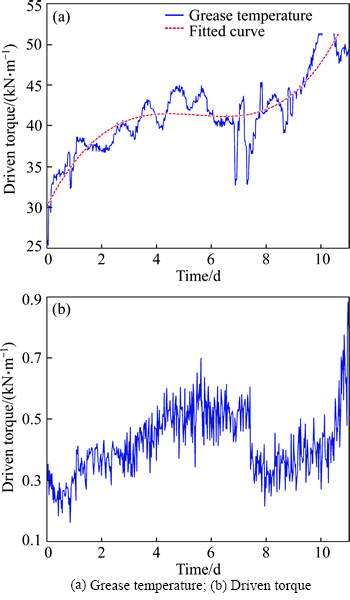
Fig. 9 Trends of both grease temperature and driven torque:
Given that the real time FR changes gradually in practice, it is unnecessary to use all acquired dataset. Therefore, 1 s (2048 data points) vibration data of every 4 h is chosen for further modeling, and the four groups of vibration signals are shown in Fig. 11.
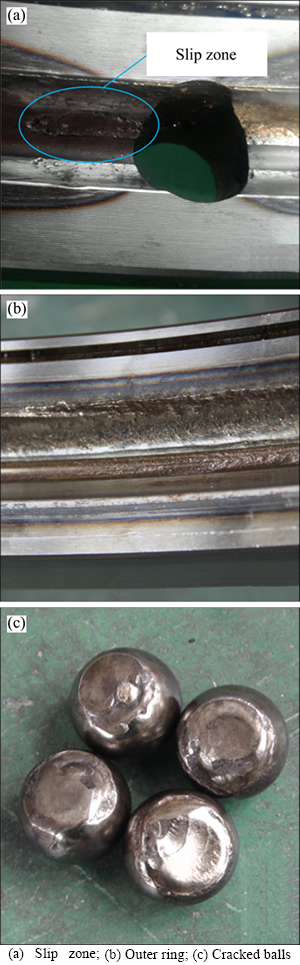
Fig. 10 Damaged slewing bearing parts:
The principle to build the FR estimation model is to build the relationship between performance degradation features and relevant FRs. According to commonly used methods [9-13], root mean square (RMS) and impulse factor of the four groups of signals are firstly calculated and shown in Fig. 12.
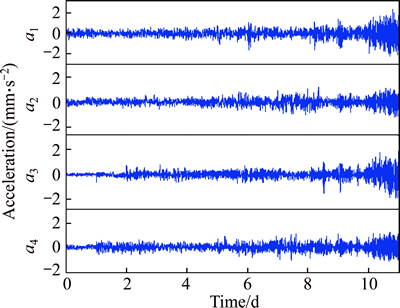
Fig. 11 Four groups vibration signals during life cycle
It can be seen from Fig. 12(a) that the overall trend of the RMS for each vibration signal is in accordance with a general performance degradation trend of equipment, while the detail differences are caused by some random factors such as geometric errors, processes and loads. Figure 12 (b) illustrates the potential faults development in different positions of the slewing bearing. On one hand, since the accelerometer a1 and a3 are mounted near the load points, their peak values of the impulse factors are quite high, which indicates severe damages of the slewing bearing around sensors a1 and a3. On the other hand, the peak values of the impact factor of a1 appear more and earlier than a3, which demonstrates that the slewing bearing raceway around a1 damages earlier and more severe because of the soft area. It is worthy to be found that all the phenomena observed from Fig. 12 are consistent with the conclusions drawn in our earlier work [25]. In a word, compared with one dimensional signal, multi-dimensional vibration signals can explain the performance degradation trend of the slewing bearing more thoroughly and precisely.
Nevertheless, the number of time-domain, frequency-domain and time-frequency-domain features of the four groups of vibration signals can reach up to 120 [10, 11], which will bring great challenges to FR estimation modeling. Therefore, according to Section 3.3, the vibration signals are divided into 11 segments: A1, A2, A3, ��, A11, and a PCA model is then established based on A1. Afterwards, A1, A2, A3, ��, AZ are projected onto the PCA model to obtain SPE respectively. As a result, by connecting every SPE, CSPE is acquired and exhibited in Fig. 13, as well as the envelope curve and the overall trend curve of CSPE. In addition, the RMS of CSPE is calculated and illustrated in Fig. 14.
It can be seen from Figs. 13 and 14 that CSPE and its RMS are exactly in accordance with the performance degradation process of the slewing bearing observed above. The trends of the first three days reflect the run-in period, while the normal service period is demonstrated from the 3rd day to the 7th day. After maintenance, the condition of the slewing bearing improves a little on the 8th day, and soon after that, the condition becomes worse dramatically since the 9th day until a critical failure occurs. Therefore, CSPE can be an effective feature to reduce the dimensionality of the vibration signals and meanwhile accurately assess the performance degradation process as much as possible.
Afterwards, several normalized time-domain features of CSPE: mean, variance, skewness, kurtosis and RMS are calculated and shown in Fig. 15, which indicate the performance degradation process of the slewing bearing from different aspects. In addition, to improve training efficiency, the 2048 data points in 1 s are reduced to 16 data points using PAA.
Meanwhile, the normalized trend curve of CSPE is regarded as the FR, of which the data length is also reduced with PAA. Nevertheless, it is worthy to note that, in practice, the FR of equipment should remain a constant in a short period of time, such as 1 min or even 1 h. Hence the corresponding FR of the 16 data points (stand for one second) here should be a constant while not 16 different FRs. Therefore, the FR curve is divided into plenty of segments and the mean value of each segment is defined as the corresponding FR, as illustrated in Fig. 16. Consequently, an FR estimation model can be trained using SFAM neural network by employing the time-domain features of CSPE and the segmented FRs as input and output respectively.
The performance of the trained FR estimation model is shown in Fig. 17. Although there are some local fluctuations in the predicted FR curve, the prediction accuracy is up to 99.3%, which makes the FR estimation model suitable for online RUL prediction.
As a result, for practical online RUL prediction, the real-time FR is firstly obtained by the above FR estimation model with CMD, and then accurate RUL can be acquired through the RUL prediction model. In this case, the RUL prediction model of the tested slewing bearing is demonstrated in Fig. 18(a), of which the calculation time is 1.293 s and the accuracy is 99.51%. For comparison, the RUL prediction models built by two commonly used methods are also exhibited in Figs. 18(b) and (c), respectively. The reliability based RUL prediction model shown in Fig. 18(b) is established based on Eq. (16), of which the calculation time is 0.174 s and the accuracy is 99.75% when the confidence factor is set to 0.95. Meanwhile, as illustrated in Fig. 18(c), the data driven RUL prediction model is trained by a typical machine learning technique: least square-support vector machine (LS-SVM) [10], which employs the time-domain features of CSPE as input and the actual RULs as output. The calculation time of the data driven method is 10.215 s and the accuracy is 99.40%. Furthermore, it should be specially noted that, to avoid misunderstandings, both service life and RUL are expressed in revolutions instead of days (e.g. 0.45 d can be very confusing) in Fig. 18.
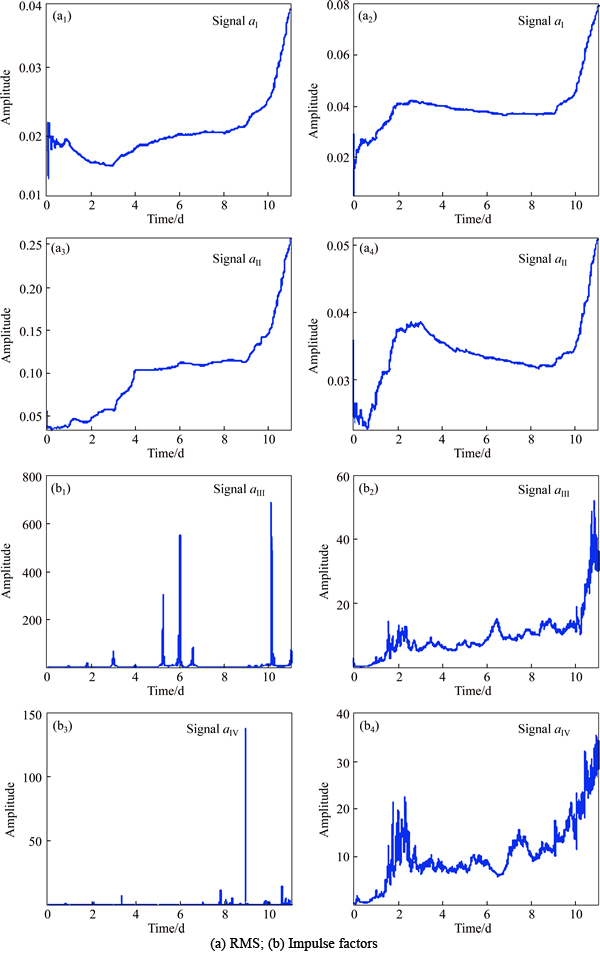
Fig. 12 Two time-domain features of four groups of vibration signals:
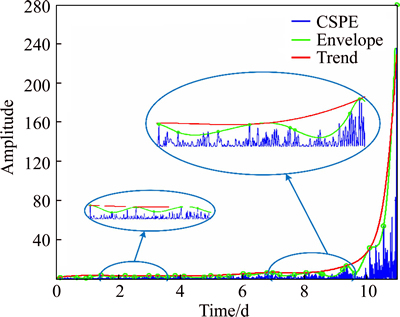
Fig. 13 CSPE of four groups of vibration signals
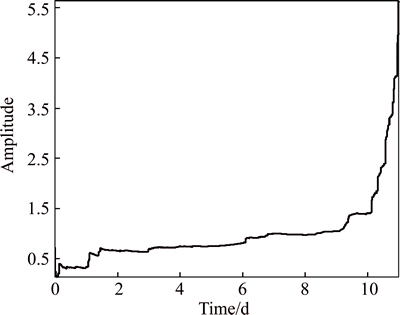
Fig. 14 RMS of CSPE
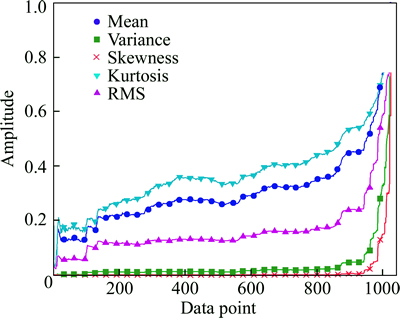
Fig. 15 Time-domain features of CSPE (after PAA)
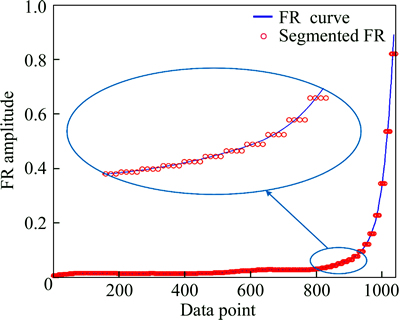
Fig. 16 Segmented FR (after PAA)
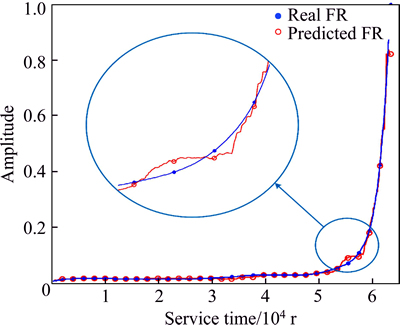
Fig. 17 Established FR estimation model using SFAM
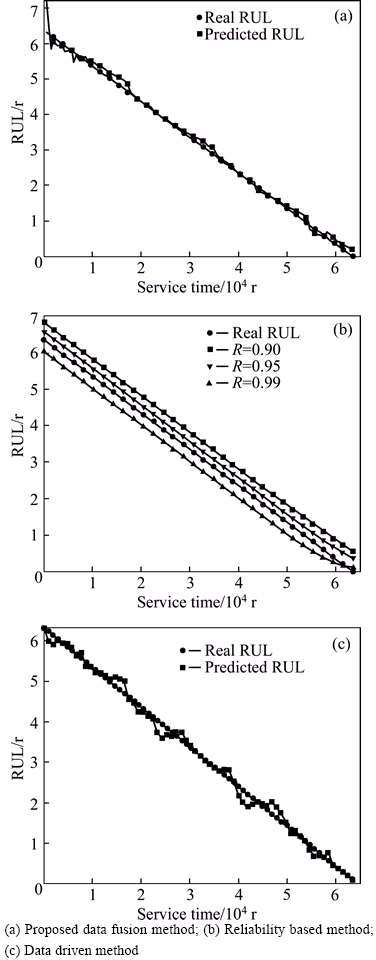
Fig. 18 Comparison of three different RUL prediction methods:
It can be observed from Fig. 18 that the reliability based RUL prediction model shown in Fig. 18(b) has the best calculation efficiency and accuracy compared with the other two models. However, the RUL curve of the reliability based model is nearly a straight line since it is obtained simply based on Eq. (16), regardless of actual random factors other than load condition, which further makes it not suitable for online RUL prediction. On the contrary, the data driven RUL prediction model exhibited in Fig. 18(c) is established based on CMD, which takes random factors into account and achieves an accuracy of 99.40%. Nevertheless, the calculation time of the data driven method is more than 10 s, and this is obviously unacceptable in practical online RUL prediction. What is more, the data driven RUL prediction model may be less accurate under practical load conditions since it is built based on the CMD of one experiment under a certain load condition. In comparison, the proposed method takes the advantages of both the above methods, of which the model parameters are self adaptively determined according to practical load condition and real-time CMD. In addition, the proposed method achieves better RUL prediction results at a lower time cost, and thus can be a reliable tool for practical online RUL prediction.
5 Conclusions
1) In this work, a novel data fusion approach is proposed to achieve performance degradation features extraction and accurate online RUL prediction for slewing bearings, which combines a reliability-based RUL prediction model and a data-driven failure rate evaluation model.
2) A reliability-based RUL prediction model is developed based on a modified Weibull distribution to build the relationship between RUL and FR, which is verified by a life-cycle experiment.
3) Experimental results show that multi-dimensional vibration signals provide a better insight into the performance degradation nature of a slewing bearing than one channel signal. In addition, instead of excessive features of multi-dimensional signals, C-PSE and its time-domain features can better assess the performance degradation process of a slewing bearing.
4) Compared with other machine learning techniques such as SVM, the SFAM neural network has a much higher calculation efficiency, and the established FR estimation model is close to experimental results.
5) Above all, the accuracy and the calculation efficiency of the proposed method are improved by 0.11% and 87.3% respectively compared with the data driven method, which provides a potential for online RUL prediction of large-size slewing bearings.
References
[1] POTOCNIK R, FLASKER J, GLODEZ S. Fatigue analysis of large slewing bearing using strain-life approach [C]// 12th International Conference on Fracture 2009. Ottawa, 2009: 3891-3898.
[2] POTOCNIK R, GONCZ P, FLASKER J, GLODEZ S. Fatigue life of double row slewing ball bearing with irregular geometry [J]. Procedia Eng, 2010, 2(1): 1877-1886.
[3] GONCZ P, POTOCNIK R, GLODEZ S. Lifetime determination of the raceway of a large three-row roller slewing bearing [C]// 10th International Conference on Fracture and Damage Mechanics. Dubrovnik: Trans Tech Publications Ltd, 2012: 113-116.
[4] GAO Xue-hai, HUANG Xiao-diao, HONG Rong-jing, WANG Hua, CHEN Jie. A rolling contact fatigue reliability evaluation method and its application to a slewing bearing [J]. J Tribol, 2012, 134(1): 011101.
[5] SHIMIZU S. P-S-N/P-F-L curve approach using 3-parameter Weibull distribution for life and fatigue analysis of structural and rolling contact component [C]// Proceedings of the ASME/STLE International Joint Tribology Conference. United States: American Society of Mechanical Engineers, 2005: 973-979.
[6] ROBINSON E Y. A universal bivariate Weibull model for static and dynamic fatigue reliability forecasting [C]// 2011 ASTM International Symposium on Rolling Element Bearings. United States: American Society for Testing and Materials, 2012: 26-46.
[7] CAESARENDRA W, KOSASIH B, TIEU A K, MOODIE C A S. Circular domain features based condition monitoring for low speed slewing bearing [J]. Mech Syst Signal Pr, 2014, 45(1): 114-138.
[8] CAESARENDRA W, KOSASIH B, TIEU A K, MOODIE C A S. Application of the largest Lyapunov exponent algorithm for feature extraction in low speed slew bearing condition monitoring [J]. Mech Syst Signal Pr, 2015, 50-51(1): 116-138.
[9] BENKEDJOUH T, MEDJAHER K, ZERHOUNI N, RECHAK S. Remaining useful life estimation based on nonlinear feature reduction and support vector regression [J]. Eng Appl Artif Intel, 2013, 26(7): 1751-1760.
[10] DONG Shao-jiang, LUO Tian-hong. Bearing degradation process prediction based on the PCA and optimized LS-SVM model [J]. Measurement, 2013, 46(9): 3143-3152.
[11] DONG Shao-jiang, YIN Shi-rong, TANG Bao-ping, CHEN Li-li, LUO Tian-hong. Bearing degradation process prediction based on the Support Vector Machine and Markov model [J]. Shock Vib, 2014, 2014: 1-15.
[12] CHEN Xue-feng, SHEN Zhong-jie, HE Zheng-jia, SUN Chuang, LIU Zhi-wen. Remaining life prognostics of rolling bearing based on relative features and multivariable support vector machine [J]. Proceedings of the Institution of Mechanical Engineers, Part C: J Mech Eng Sci, 2013, 227(12): 2849-2860.
[13] KIM H E, TAN A C C, MATHEW J, CHOI B K. Bearing fault prognosis based on health state probability estimation [J]. Expert Syst Appl, 2012, 39(5): 5200-5213.
[14] ALI J B, CHEBEL-MORELLO B, SAIDI L, MALINOWSKI S, FNAIECH F. Accurate bearing remaining useful life prediction based on Weibull distribution and artificial neural network [J]. Mech Syst Signal Pr, 2015, 56-57: 150-172.
[15] WEIBULL W. A statistical distribution function of wide applicability [J]. J Appl Mech, 1951, 18(3): 293-297.
[16] SHEN Zhong-jie, CHEN Xue-feng, HE Zheng-jia, SUN Chuang, ZHANG Xiao-li, LIU Zhi-wen. Remaining life predictions of rolling bearing based on relative features and multivariable support vector machine [J]. J Mech Eng, 2013, 49(2): 183-189. (in Chinese)
[17] CARPENTER G A, GROSSBERG S. Pattern recognition by self-organizing neural networks [M]. Cambridge: MIT Press, 1991.
[18] VENKATESAN P, SURESH M. Classification of renal failure using simplified fuzzy adaptive resonance theory map [J]. Int J Com Sci Net Secur, 2009, 9(11): 129-134.
[19] ZHANG Meng, LI Guo-xi, GONG Jing-zhong, WU Bao-zhong. Predicting configuration performance of modular product family using principal component analysis and support vector machine [J]. J Cent South Univ, 2014, 21: 2701-2711.
[20] JOHN H. Principles of tribology [M]. London: McMillan, 1975.
[21] ZVOKELJ M, ZUPAN S, PREBIL I. Non-linear multivariate and multiscale monitoring and signal denoising strategy using kernel principal component analysis combined with ensemble empirical mode decomposition method [J]. Mech Syst Signal Pr, 2011, 25(7): 2631-2653.
[22] ZVOKELJ M, ZUPAN S, PREBIL I. Multivariate and multiscale monitoring of large-size low-speed bearings using ensemble empirical mode decomposition method combined with principal component analysis [J]. Mech Syst Signal Pr, 2010, 24(4): 1049- 1067.
[23] YI B K, FALOUTSOS C. Fast time sequence indexing for arbitrary Lp norms [C]// Proceeding on 26th VLBD Conference. Egypt, 2000: 385-394.
[24] Chinese Standard No. JB/T2300��1999. Slewing bearing [S]. (in Chinese)
[25] FENG Yang, HUANG Xiao-diao, CHEN Jie, WANG Hua, HONG Rong-jing. Reliability-based residual life prediction of large-size low-speed slewing bearings [J]. Mech Mach Theory, 2014, 81: 94-106.
(Edited by FANG Jing-hua)
Cite this article as: FENG Yang, HUANG Xiao-diao, HONG Rong-jing, CHEN Jie. Online residual useful life prediction of large-size slewing bearings��A data fusion method [J]. Journal of Central South University, 2017, 24(1): 114-126. DOI: 10.1007/s11771-017-3414-z.
Foundation item: Projects(51375222, 51175242) supported by the National Natural Science Foundation of China
Received date: 2015-09-16; Accepted date: 2016-05-11
Corresponding author: HUANG Xiao-diao, Professor; Tel: +86-18651625647; E-mail: njgdhxd@yeah.net
Abstract: To decrease breakdown time and improve machine operation reliability, accurate residual useful life (RUL) prediction has been playing a critical role in condition based monitoring. A data fusion method was proposed to achieve online RUL prediction of slewing bearings, which consisted of a reliability based RUL prediction model and a data driven failure rate (FR) estimation model. Firstly, an RUL prediction model was developed based on modified Weibull distribution to build the relationship between RUL and FR. Secondly, principal component analysis (PCA) was introduced to process multi-dimensional life-cycle vibration signals, and continuous squared prediction error (CSPE) and its time-domain features were employed as equipment performance degradation features. Afterwards, an FR estimation model was established on basis of the degradation features and relevant FRs using simplified fuzzy adaptive resonance theory map (SFAM) neural network. Consequently, real-time FR of equipment can be obtained through FR estimation model, and then accurate RUL can be calculated through the RUL prediction model. Results of a slewing bearing life test show that CSPE is an effective indicator of performance degradation process of slewing bearings, and that by combining actual load condition and real-time monitored data, the calculation time is reduced by 87.3% and the accuracy is increased by 0.11%, which provides a potential for online RUL prediction of slewing bearings and other various machineries.
