
J. Cent. South Univ. (2016) 23: 59-67
DOI: 10.1007/s11771-016-3049-5

Rapid and simultaneous determination of ten off-flavor compounds in water by headspace solid phase microextraction and gas chromatography-mass spectrometry
ZOU Pan(����)1, WANG Lin(����)1, YANG Zhao-guang(����)1, 2, LEE Hsiaowan(����)1, LI Hai-pu(���)1
1. Center for Environment and Water Resources, School of Chemistry and Chemical Engineering,
Central South University, Changsha 410083, China;
2. Shenzhen Research Institute of Central South University, Shenzhen 518057, China
 Central South University Press and Springer-Verlag Berlin Heidelberg 2016
Abstract:
A simple and sensitive analytical procedure for the determination of multi-component compounds in water samples was developed and optimized using the headspace solid-phase microextraction (HSSPME) coupled with gas chromatography-mass spectrometry (GC-MS). Ten off-flavor compounds, including geosmin (GSM), 2-methylisoborneol (2-MIB), 2-isopropyl-3- methoxypyrazine (IPMP), 2-isobutyl-3-methoxypyrazine (IBMP), ��-ionone, trans-2,cis-6-nonadienal (NDE), 2,3,4-trichloroanisole (2,3,4-TCA), 2,3,6-trichroloanisole (2,3,6-TCA), 2,4,6-trichloroanisole (2,4,6-TCA), and 2,4,6-tribromoanisole (2,4,6-TBA) were used as the target analytes. The optimization of extraction parameters including fibers types, extraction time, extraction temperature, stirring rate, sample volume, and ionic strength was carried out through the univariate approach. Ten off-flavor compounds were quantified within 50 min under the optimal conditions. Calibration curves with good linearity (r2=0.990-0.998) were obtained in the range 1.0/2.0-100 ng/L, while the limits of detection for all compounds were lower than or close to the odor threshold concentration. Furthermore, the proposed method was applied to analyzing and determining the off-flavor compounds in real water samples from water-treatment plants.
Key words:
off-flavor compounds; microextraction; gas chromatography-mass spectrometry (GC-MS); water quality��
1 Introduction
It is essential to identify and quantify the trace amounts of volatile organic compounds (VOCs) as these compounds are responsible for the off-flavor and can dramatically impact the esthetic quality and consumer acceptability of drinking water. The most common off-flavor compounds include geosmin (GSM), 2-methylisoborneol (2-MIB), 2-isopropyl-3- methoxypyrazine (IPMP), 2-isobutyl-3-methoxypyrazine (IBMP), as secondary metabolites produced by actinomycetes (bacteria) and cyanobacteria [1-2]. Because of their extremely low odor threshold concentrations (OTCs) [3-5], these compounds can easily cause off-flavor problems in source water such as lakes and reservoirs [6-7]. To make matter worse, these off-flavor compounds are hard to remove using conventional water treatment process like chlorination, coagulation and sedimentation [8]. In addition, some other off-flavor compounds, such as trichloroanisoles (TCAs) and tribromoanisole (TBA), could be produced during the water treatment processes and/or from the water distribution network [9-11]. In recent years, it was found that trans-2,cis-6-nonadienal (NDE) and ��-ionone can also contribute to off-flavor of drinking water [12-15]. Therefore, a rapid and sensitive method to be used for the daily testing of water supplies is required to determine the common and newly-emerged off-flavor compounds.
Generally, trace amount of off-flavor compounds can be determined by gas chromatography-mass spectrometry (GC-MS) after the preconcentration step. To date, a variety of enrichment techniques have been established and developed for this purpose. Liquid- liquid extraction (LLE), a simple and conventional step, has been successfully used in enrichment of VOCs [16-17], but this method is less sensitive and calls for additional solvents [18]. Solid phase extraction (SPE) is another widely used technique for the extraction of trace amounts of off-flavors compounds [19-20]. However, it is time and solvent consuming. Purge and trap (P&T) can analyze some off-flavors at ng/L levels [2, 21], yet necessarily requiring the specific P&T concentrator as well as a complicated flow path.
Solid-phase microextraction (SPME) is a simple, fast, sensitive, inexpensive and solvent-free method for the analysis of volatile and semi-volatile compounds in a wide variety of food, water, and environmental samples [22-24]. A fused silica fiber can be directly immersed into a liquid sample or placed in the headspace above the sample for qualitative analysis. The latter is also known as the headspace solid-phase microextraction (denoted as HSSPME), which is based on the equilibrium among liquid phase, vapor phase and fiber coating.
Fibers used in HSSPME for trace VOCs have been investigated and reported, such as polydimethylsiloxane (PDMS) [25], polydimethyl-siloxane /divinylbenzene (PDMS/DVB) [1, 26], and divinylbenzene/carboxen/ polydimethylsiloxane (DVB/CAR/PDMS) [27-28]. Lloyd et al [25] applied HSSPME using the PDMS fiber, 6 mL sample, with 5 min extraction time to quantify geosmin and 2-MIB in standards at concentrations as low as 0.1 ��g/L, approximately 10 times the odor threshold concentration. Sung et al [27] developed the HSSPME method by optimizing the SPME procedure using DVB/CAR/PDMS fiber, and reported the detection limit of IPMP (0.34 ng/L), 2-MIB (0.59 ng/L), 2,4,6-TCA (0.40 ng/L), and GSM (0.48 ng/L), respectively. Zhang et al [28] reported a HSSPME GC-MS method for simultaneous picogram determination of ��earthy and musty�� odorous compounds in water, aided by the initial cool programmable temperature vaporized inlet, which is not widely available in most labs or drinking water industries. Chen et al [29] and Wright et al [30] recently described the determination of common taste and odor compounds in drinking water using SPME technology. However, some concerned off-flavor compounds like ��-ionone, 2,4,6-TBA, and other TCA isomers have not been yet practiced by the above SPME investigation, which together with GSM, 2-MIB, IPMP, IBMP and NDE cover a span of typical off-flavor compounds produced from the source to water distribution network. In a related report, Gao et al [31] recently proposed a LLE-GC-MS procedure for the determination of ��-ionone with detection limit of 1.98 ��g/L. Montes et al [32] applied a SPE-GC-MS method to 2,4,6-TBA with limit of quantification (LOQ) of 0.5 ng/L. Zhang et al [5] developed a method involving the large-volume injection (LVI) via programmable temperature vaporizing (PTV) inlet and continuous liquid-liquid extraction to earthy-musty compounds including 2-MIB, GSM, 2,4,6-TBA and TCAs. Nevertheless, a simultaneous determination of such a whole collection of concerned ten off-flavor compounds is still both needed and practical for the related origin, migration and transformation research.
Extraction performance is greatly affected by the operational parameters; and therefore careful optimization of the parameters is required, performed by a multivariate approach [29-33] or classical univariate approach. In this work, a simple and sensitive analytical procedure based on GC-MS hyphenated with HSSPME was established for simultaneous quantification of as many as ten off-flavor compounds with different properties in water samples, by probing the efficient SPME fiber and optimizing the operational parameters. Extraction parameters, such as extraction time, extraction temperature, ionic strength, sample volume, and stirring rate, were optimized using univariate approach. Then quality parameters including linearity, repeatability, and limit of detection were employed to test and check the above established procedure. In a further step, the optimized HSSPME method was applied in a practical view to determining off-flavor compounds in raw surface water and water-treatment plant (WTP) water.
2 Materials and methods
2.1 Reagents and materials
2-methylisoborneol (2-MIB), geosmin (GSM), 2,3,4-trichloroanisole (2,3,4-TCA), 2,3,6-trichrolo anisole (2,3,6-TCA), 2,4,6-trichloroanisole (2,4,6-TCA) and 2,4,6-tribromoanisole (2,4,6-TBA) were purchased from Dr. Ehrenstorfer Gmbh(Bgm Schlosser-Str.,Augsburg,Germany).2-isopropyl-3-methoxypyrazine(IPMP) and 2-isobutyl-3-methoxypyrazine (IBMP) were purchased from Supelco (Bellefonte, PA, USA). Trans-2,cis-6-nonadienal (NDE), ��-ionone were purchased from CNW Technologies (Shanghai, China). Methanol was of HPLC grade and obtained from Sigma-Aldrich (Saint Quentin Fallaviers, France). Sodium chloride (analytical grade, Aladdin, Shanghai, China), which was added to the samples before extraction, was conditioned by heating at 450 ��C for 2 h prior to use. Sodium thiosulfate (99.99%) was purchased from Aladdin (Shanghai, China). Standard solutions of 1 g/L of 2,4,6-TCA, 2,3,6-TCA, 2,3,4-TCA, 2,4,6-TBA and ��-ionone were prepared in methanol. Standard solutions of 100 mg/L of 2-MIB, GSM, NDE, IBMP, and IPMP were also prepared in the same way. All the standard solutions were stored at -20 ��C in darkness.
2.2 Apparatus
SPME apparatus was purchased from Supelco (Bellefonte, PA, USA), including four commercially available fibers (100 ��m PDMS, 75 ��m CAR/PDMS, 65 ��m PDMS/DVB and 50/30 ��m DVB/CAR/PDMS) and a manual holder. The fibers were conditioned in the GC injector port at the first use according to the manufacturer��s instructions. Gas chromatograph used for this work was Agilent 7890 series GC coupled with 5975 series mass spectrometer. The HP-5MS column (30 m�� 0.25 mm��0.25 ��m, Agilent, USA) was used. The oven temperature was programmed at 40 ��C for 3 min, raised to 140 ��C at 10 ��C/min and kept for 5 min, then raised to 230 ��C at 15 ��C/min and kept for 1 min. The carrier gas was helium of purity 99.9995% and kept at 1 mL/min constant flow (average linear velocity 36.8 cm/s). A special SPME glass liner with a constant inner diameter of 0.75 mm (Supelco) was employed. Splitless injection mode was used with a split time of 1 min. The mass spectra were obtained at a mass-to-charge ratio scan range from 50 to 400 amu to determine appropriate masses for selected ion monitoring (SIM). Mass spectra matches were made by comparison with NIST MS search 2.0 standard spectra. The EI ion source temperature was set at 230 ��C. The solvent delay time was set to 4.5 min. Selected ion monitoring mode was used in quantization. The retention time (TR), retention window, selected ions (m/z), odor characteristics and odor threshold concentrations of the selected ten off-flavor compounds are listed in Table 1.
2.3 SPME procedure
For SPME optimization, 100 ng/L aqueous solution was prepared by diluting the 10 ��g/L standard solution with the appropriate volume of ultra-pure water (18.2 M��, Purkinje, Beijing, China). The mixed work solution was placed into a 15 mL headspace vial with a PTFE septum cap. After the addition of NaCl (0-3.0 g, depending on the specific runs), a small PTFE-coated stirring bar (5 mm��10 mm) was then introduced. A water bath was used to heat the vial to maintain the extraction temperature (40-70 ��C) for 5 min before HSSPME procedure. The outer needle of the fiber assembly was passed through the septum in proper length and the fiberwas extended into the headspace for a designated time (15-60 min). After workup, the fiber was immediately inserted into a GC injection port for 3 min for desorption. In order to achieve complete desorption, the fiber was ��checked�� by placing it in the injector of another gas chromatograph at 250 ��C for at least 5 min.
2.4 Sample collection and preparation
The WTP samples were collected from Shenzhen, Guangdong, China, in May, 2014. All water samples for analyses were stored in darkness at 4 ��C in cleaned and ashed (450 ��C>4 h) amber glass bottles until analysis. All analyses were performed within 2 d after sampling. Before analysis, all water samples were filtered through 0.45 ��m pore glass-fiber-filter. Sodium thiosulfate was added for the removal of residual chlorine in tap water samples.
3 Results and discussion
The GC-MS analysis can fundamentally separate the selected ten off-flavor compounds well enough except IBMP and 2-MIB, which owe similar molecule weight and easily give rise to overlapped peaks. To distinguish these two compounds from each other, different temperature ramps from references were investigated [27, 29], and an improved temperature programming was accordingly proposed (held at 40 ��C for 3 min, raised to 230 ��C at 10 ��C/min and kept for 1 min), resulting in the optimized chromatograms (Fig. 1).
All the analytes were separated in 22 min. The resulting peak area was then integrated to draw calibration curves and to determine concentrations of analytes in samples. The comparison of non-spiked water samples and the same matrix spiked with target compounds has suggested that there were no interfering peaks from the sample matrix.
Table 1 retention time (TR), retention window, selected ions (m/z), odor characteristics and odor threshold concentrations (OTCs) of selected ten off-flavor compounds
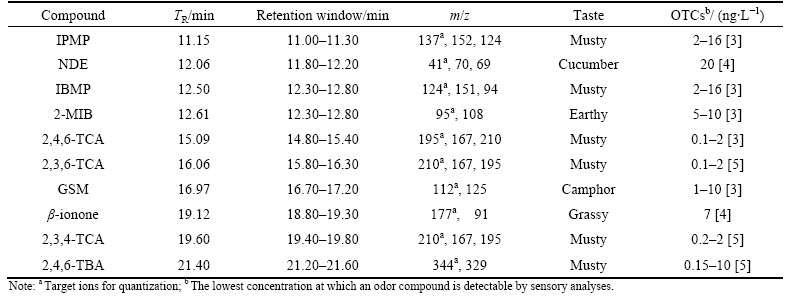
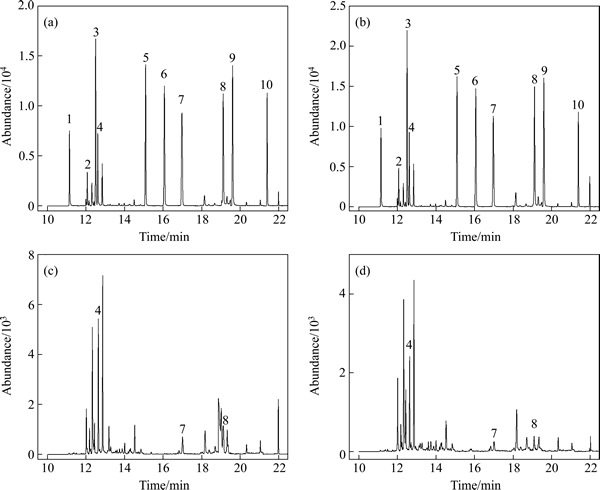
Fig. 1 GC-MS chromatograms of spiked reservoir water (50 ng/L) (a), spiked tap water (50 ng/L) (b), non-spiked reservoir water (c) and non-spiked tap water (d) (Numbered peaks were responsible for IPMP (1), NDE (2), IBMP (3), 2-MIB (4), 2,4,6-TCA (5), 2,3,6-TCA (6), GSM (7), ��-ionone (8), 2,3,4-TCA (9) and 2,4,6-TBA (10), respectively)
3.1 Fiber evaluation
Four commercial fibers (PDMS, CAR/PDMS, PDMS/DVB and DVB/CAR/PDMS) were chosen for evaluating the extraction efficiency of the ten analytes. PDMS, a nonpolar polymer, is designed for the absorption of nonpolar organic compounds, and both DVB and CAR are porous absorbents. Consequently, PDMS/DVB, CAR/PDMS and DVB/CAR/PDMS have stronger absorption capacity than PDMS. In addition, the film thickness of PDMS/DVB is thinner than that of CAR/PDMS or DVB/CAR/PDMS, so it would take less time to reach adsorption and desorption equilibrium for the organic volatile flavor compounds in PDMS/DVB [34]. In the preliminary experiments, the extraction results with three replicates (n=3) indicated that the extraction efficiencies of these SPME fibers towards the ten compounds were in the following order: PDMS/DVB >DVB/CAR/PDMS > CAR/PDMS > PDMS (Fig. 2).
Among the fibers studied, the most suitable fiber for the extraction of the analytes was the PDMS/DVB- coated fiber, which extracted all of the analytes with the best efficiency in short time. Thus, the PDMS/DVB fiber was chosen for further investigations.
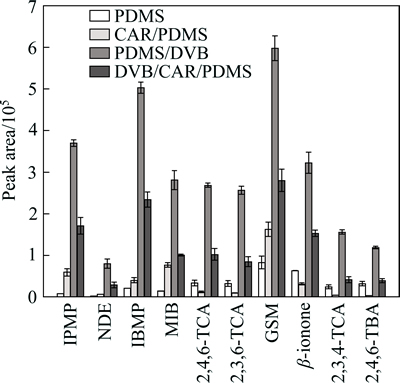
Fig. 2 Influence of fiber coating (PDMS, CAR/PDMS, PDMS/DVB, DVB/CAR/PDMS) on extraction efficiency of ten analytes from spike water (100 ng/L) (Extraction conditions: extraction time, 30 min; extraction temperature, 50 ��C; sample volume, 8 mL; stirring rate, 500 r/min; addition of NaCl, 1 g; n=3)
3.2 Extraction time profiles
Generally, the extraction efficiencies of analytes increase with the extraction time until it reaches equilibrium. Watson et al [35] found that the response for 2-MIB reached apparent equilibrium at 1 h while within the same time span 80% of maximum response for GSM was achieved. As such the extraction time ranged from 15 to 60 min was studied. The extraction time profiles (Fig. 3) were obtained by plotting the GC-MS response versus the extraction time. The peak area response of analytes roughly doubly increased when the extraction time was increased from 15 to 30 min. Thereafter, the increasing tendency was quite tardy.
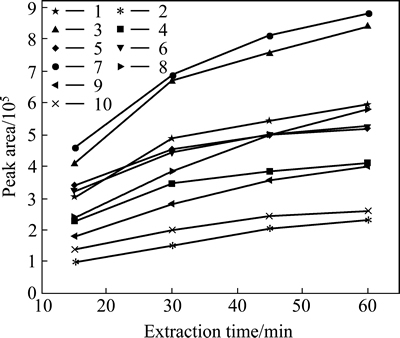
Fig. 3 Influence of extraction time (15, 30, 45, and 60 min) on extraction efficiency of ten analytes from spike water(100 ng/L) (Extraction conditions: extraction fiber, 65 ��m PDMS/DVB; extraction temperature, 50 ��C; sample volume, 8 mL; stirring rate, 500 r/min; addition of NaCl, 1 g. Numbered labels were IPMP (1), NDE (2), IBMP (3), 2-MIB (4), 2,4,6-TCA (5), 2,3,6-TCA (6), GSM (7), ��-ionone (8), 2,3,4-TCA (9), and 2,4,6-TBA (10), respectively; n=3)
Accordingly, 30 min was taken as the extraction time for further experiments, which provides sufficient extraction efficiency and allows the headspace SPME procedure to be performed approximately in the same time as that required for GC analysis (23 min).
3.3 Extraction temperature
The suitability of the HSSPME technique for the extraction of compounds from water mainly depended on the transfer of the analyte from the aqueous phase to the vapor phase. The extraction efficiency of HSSPME is in line with the absorption of analytes on fiber coating. On the other hand, extraction temperature has a great impact on the extraction efficiency by influencing the distribution of the analytes kept in the liquid sample or vaporized in the headspace. Higher temperature might also prompt the transfer of analytes from fiber coating to vapor phase. The extraction efficiency of analytes reached the top value at 60 ��C of extraction temperature (Fig. 4). However, when temperature increased to 70 ��C, the extraction efficiency uniformly decreased. Consequently, the extraction temperature was set at 60 ��C.
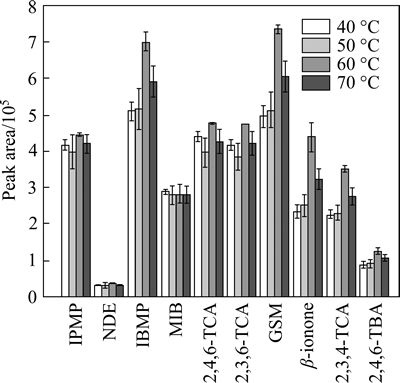
Fig. 4 Influence of extraction temperature (40, 50, 60, and 70 ��C) on extraction efficiency of ten analytes from spike water (100 ng/L) (Extraction conditions: extraction fiber, 65 ��m PDMS/DVB; extraction time, 30 min; sample volume, 8 mL; stirring rate, 500 r/min; addition of NaCl, 1 g; n=3)
3.4 Stirring rate and sample volume
Sample agitation could considerably enhance the volatility of compounds in water, contributing to a higher concentration of the vapor components in headspace. It was found that the extraction efficiency increased with the increase of stirring rate (300-700 r/min). Nevertheless, when stirring rate was higher than 700 r/min, the vial will be heavily shacked due to the stirrer vibration. Thus, the stirring rate was chosen as 700 r/min.
The effects of the sample volume (Vs) on the extraction of the ten off-flavor compounds by HSSPME were investigated using the same 15 mL headspace vial, added with different volume of water (4, 6, 8, and 10 mL). The volumes of headspace (Vh) are therefore 11, 9, 7, and 5 mL. As shown in Fig. 5, when Vs increased from 4 to 8 mL, a nearly linear increase of peak area can be observed.
But when Vs was set at 10 mL, the response dropped slightly in all cases. In previous related work [18], the increase in Vs, and also a decrease in Vh, generally improve the sensitivity and lead to an increase in the analytical signal. However, more practically, a sufficient free space should be kept to prevent direct contact between the organic drop and the aqueous solution.
When Vh was too small, the fiber could come too near to the bulk water and thus was liable to be heated by the sample, which would in turn weaken the absorption of the analytes on fiber coating. Hence, sample volume was chosen as 8 mL for further optimization.
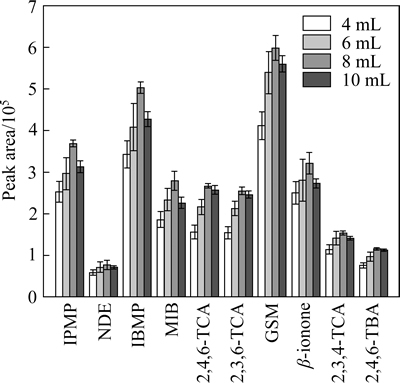
Fig. 5 Influence of sample volume (4, 6, 8, and 10 mL) on extraction efficiency of ten analytes from spike water(100 ng/L) (Extraction conditions: extraction fiber, 65 ��m PDMS/DVB; extraction time, 30 min; extraction temperature, 60 ��C; stirring rate, 700 r/min; addition of NaCl, 1 g; n=3)
3.5 Ionic strength
As known in the HSSPME technique, the extraction largely depends on the phase transfer of the analyte. Higher ionic strength (salt addition) could remarkably enhance the volatility of the analytes in water and had a significant positive effect on the extraction of most off-flavor compounds [36]. However, under intense condition, the formation of hydration spheres of water molecules could unnegligibly reduce the amount of water available for dissolving the analytes, and the excessive NaCl solid might also have a chance to adsorb the analytes [6], so as to decrease the extraction efficiency. In the current work, the effect of ionic strength was determined by preparing samples with the addition of salt (NaCl) ranging from 0 to 3 g. As shown in Fig. 6, the extraction efficiencies of analytes were substantially enhanced when the mass of sodium chloride was increased from 0.5 to 2.5 g.
After that, a decrease of extraction efficiency was observed at higher NaCl concentrations in all cases. When compared to the control, the addition of 2.5 g NaCl was able to noticeably improve the extraction efficiency (2-3 times for all analytes except 2,4.6-TCA and 2,4,6-TBA). Consequently, the ionic strength was fixed by adding 2.5 g NaCl into the 8 mL sample.
3.6 Desorption
Incomplete desorption could largely depress the sensitivity of the proposed procedure, contaminate the subsequent samples and even lessen the fiber��s lifetime. Desorption temperature was set at recommended operation value 250 ��C. The effect of desorption time (3 and 5 min) was then investigated. It was found that a 3 min of desorption time was sufficient for the complete desorption of all concerned off-flavor compounds from the fibers. However, lengthened desorption time will in turn shorten the fibers�� lifetime. Accordingly, 3 min was decided to be the optimal desorption time, under which the fibers could withstand almost over 150 desorption operations.
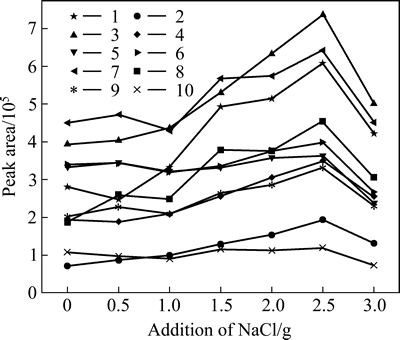
Fig. 6 Influence of NaCl addition (0, 0.5, 1.0, 1.5, 2.0, 2.5, and 3.0 g) on extraction efficiency of ten analytes from spike water (100 ng/L) (Extraction conditions: extraction fiber, 65 ��m PDMS/DVB; extraction time, 30 min; extraction temperature, 60 ��C; stirring rate, 700 r/min; sample volume, 8 mL. Numbered labels were IPMP (1), NDE (2), IBMP (3), 2-MIB (4), 2,4,6-TCA (5), 2,3,6-TCA (6), GSM (7), ��-ionone (8), 2,3,4-TCA (9) and 2,4,6-TBA (10), respectively; n=3)
3.7 Quality control of developed method
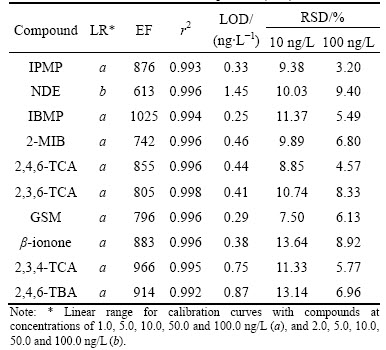
Quality parameters for the optimized procedure (fiber, PDMS/DVB; extraction time, 30 min; extraction temperature, 60 ��C; stirring rate, 700 r/min; sample volume, 8 mL; addition of NaCl, 2.5 g) were determined by evaluating the linearity, limit of detection, and repeatability (RSD) of the calibration curves. Linearity for the analytes was obtained by performing extractions on samples spiked with standard solutions of off-flavor compounds in the concentration range of 1.0/2.0-100 ng/L. The enrichment factor (EF) was defined as the ratio of the analyte concentration in the solid phase (Cs) to the initial concentration of analyte within the sample (Co) [37-38], where Cs was obtained from calibration graph of direct injection of ten off-flavor compounds standard solution in tetrachloroethylene (0.05-0.25 mg/L). As listed in Table 2, the repeatability of the optimized HSSPME procedure was performed in concentration levels of 10 and 100 ng/L, respectively, with seven replicates (n=7).
All curves exhibited good linearity (r2>0.992) for the samples examined. The relative standard deviations (RSDs) of regression were calculated to be 7.50%-13.64% (10 ng/L) and 3.20%-9.40% (100 ng/L), respectively. The limits of detection (LOD) (three times the signal-to-noise ratio) were found to be 0.25-1.45 ng/L. The enrichment factors of this procedure were moderately high and ranged between 613-1025.
Table 2 Linear range (LR), r2, enrichment factor (EF), limit of detection (LOD), and relative standard deviations (RSD) of calibration curves of off-flavor compounds (n=7)
3.8 Application in real water samples of WTP
The developed HSSPME procedure was applied to the analysis of real samples from reservoir water and tap water treated at WTP, collected from Shenzhen, China. To evaluate the recovery of the extraction, known amounts of the standard solution were spiked into the reservoir water or tap water at concentrations of, respectively, 5, 10, and 50 ng/L. The recovery of the extraction was calculated by comparing the peak areas of spiked and non-spiked samples [29]. As listed in Table 3, recoveries of ten off-flavor compounds for spiked reservoir water samples were in the range of 71%-112% at 5 ng/L and 72%-97% at 10 ng/L, respectively. In the case of higher concentration 50 ng/L, most recoveries were found over 83%, except for NDE (72%) that appears to be less likely affected by the change of concentration. As for spiked tap water samples, good recoveries (74%-125%) were also obtained. At all three concentrations, the recoveries (74%-85%) of ��-ionone were found to be relatively low than those of other nine compounds.
The established SPME-GC-MS procedure was also applied to analyzing the off-flavor compounds in non-spiked WTP water samples, including raw water (RW), clarification water (CW), filtration water (FW), and tap water (TW), collected from Shenzhen, China. As listed in Table 4, the concentration levels of target ten off-flavor compounds ranged from not detected (n.d.) to around twenty nanograms per liter. IPMP, NDE, IBMP, 2,4,6-TBA, 2,4,6-TCA and its isomers 2,3,6-TCA and 2,3,4-TCA were not detected in collected samples.
Table 3 recoveries of spiked solutions
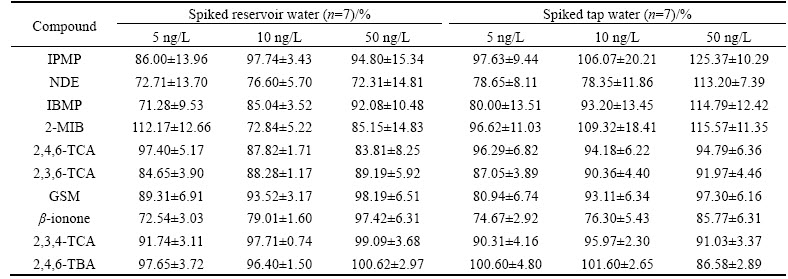
Table 4 Determination of ten off-flavor compounds in WTP water samples
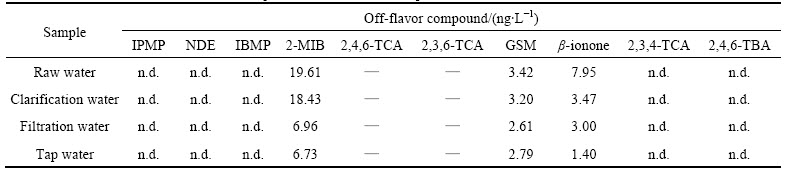
In the investigated WTP water, 2-MIB concentrations ranged from 6.73 to 19.61 ng/L, which were significantly higher than its OTC (5-10 ng/L) [3]. GSM was detected in the concentration range of 2.79-3.42 ng/L. These data were comparable to those in previous reports [29, 39]. ��-ionone gave relatively low concentrations from 1.40 to 7.95 ng/L, which were lower than its OTC (7 ng/L) [4]. It is suggested that 2-MIB and GSM may be mainly responsible for the odor of the concerned samples.
4 Conclusions
The aim of this work is to develop a simple, rapid and cost-efficient procedure that can be used widely in most labs and drinking water industries, using standard equipment. At first, a screening study of the different types of coatings showed that the most suitable fiber for the extraction of all ten compounds is PDMS/DVB. Then a series of univariate experiments are performed to optimize the extraction time, extraction temperature, sample volume, stirring rate and ionic strength. The obtained calibration curves showed good linearity in the range of 1.0/2.0-100 ng/L and the limits of detection are lower than or close to odor threshold concentration for the ten off-flavor compounds. Finally, the optimized procedure is applied to analyzing the off-flavor compounds in WTP water with 2-MIB, GSM and ��-ionone simultaneously.
References
[1] Saito K, Okamura K, Kataoka H. Determination of musty odorants, 2-methylisoborneol and geosmin, in environmental water by headspace solid-phase microextraction and gas chromatography-mass spectrometry [J]. Journal of Chromatography A, 2008, 1186(1/2): 434-437.
[2] Salemi A, Lacorte S, Bagheri H, Barcelo D. Automated trace determination of earthy-musty odorous compounds in water samples by on-line purge-and-trap-gas chromatography-mass spectrometry [J]. Journal of Chromatography A, 2006, 1136(2): 170-175.
[3] Young W, Horth H, Crane R, Ogden T, Arnott M. Taste and odour threshold concentrations of potential potable water contaminants [J]. Water Research, 1996, 30(2): 331-340.
[4] Mackey E, Baribeau H, Crozes G, Suffet I, Piriou P. Public thresholds for chlorinous flavors in US tap water [J]. Water Science and Technology, 2004, 49(9): 335-340.
[5] Zhang L, Hu R, Yang Z. Routine analysis of off-flavor compounds in water at sub-part-per-trillion level by large-volume injection GC/MS with programmable temperature vaporizing inlet [J]. Water Research, 2006, 40(4): 699-709.
[6] Ma K, Zhang J N, Zhao M, He Y J. Accurate analysis of trace earthy-musty odorants in water by headspace solid phase microextraction gas chromatography-mass spectrometry [J]. Journal of Separation Science, 2012, 35(12): 1494-1501.
[7] Palmentier J P F P, Taguchi V Y. The determination of six taste and odour compounds in water using Ambersorb 572 and high resolution mass spectrometry [J]. The Analyst, 2001, 126(6): 840-845.
[8] Peter A, von Gunten U. Taste and odour problems generated in distribution systems: a case study on the formation of 2,4,6-trichloroanisole [J]. Journal of Water Supply Research and Technology-Aqua, 2009, 58(6): 386-394.
[9] D��az A, Ventura F, Galceran M T. Determination of odorous mixed chloro-bromoanisoles in water by solid-phase micro-extraction and gas chromatography�Cmass detection [J]. Journal of Chromatography A, 2005, 1064(1): 97-106.
[10] Omur-Ozbek P, Dietrich A M. Determination of temperature-dependent Henry��s law constants of odorous contaminants and their application to human perception [J]. Environmental Science and Technology, 2005, 39(11): 3957-3963.
[11] Whelton A J, Dietrich A M. Relationship between intensity, concentration, and temperature for drinking water odorants [J]. Water Research, 2004, 38(6): 1604-1614.
[12] Benanou D, Acobas F, de Roubin M R, David F, Sandra P. Analysis of off-flavors in the aquatic environment by stir bar sorptive extraction-thermal desorption-capillary GC/MS/olfactometry [J]. Analytical and Bioanalytical Chemistry, 2003, 376(1): 69-77.
[13] Bruce D, Westerhoff P, Brawley-Chesworth A. Removal of 2-methylisoborneol and geosmin in surface water treatment plants in Arizona [J]. Journal of Water Supply Research and Technology-Aqua, 2002, 51(4): 183-197.
[14] Hockelmann C, Juttner F. Off-flavours in water: hydroxyketones and beta-ionone derivatives as new odour compounds of freshwater cyanobacteria [J]. Flavour and Fragrance Journal, 2005, 20(4): 387-394.
[15] Juttner F. Detection of lipid degradation products in the water of a reservoir during a bloom of Synura uvella [J]. Applied and Environmental Microbiology, 1981, 41(1): 100-106.
[16] Ma X, Gao N, Chen B, Li Q, Zhang Q, Gu G. Detection of geosmin and 2-methylisoborneol by liquid-liquid extraction-gas chromatograph mass spectrum (LLE-GCMS) and solid phase extraction-gas chromatograph mass spectrum (SPE-GCMS) [J]. Frontiers of Environmental Science & Engineering, 2007, 1(3): 286-291.
[17] Shin H S, Ahn H S. Simple, rapid, and sensitive determination of odorous compounds in water by GC-MS [J]. Chromatographia, 2004, 59(1/2): 107-113.
[18] Bagheri H, Salemi A. Headspace solvent microextraction as a simple and highly sensitive sample pretreatment technique for ultra trace determination of geosmin in aquatic media [J]. Journal of Separation Science, 2006, 29(1): 57-65.
[19] Schmarr H G, Koschinski S, Sang W, Slabizki P. Trace level analysis of corky off-flavor compounds: development of a new analytical method based on solid phase extraction and analysis by multidimensional gas chromatography with mass spectrometric detection [J]. Journal of Chromatography A, 2012, 1226: 96-102.
[20] Sun W, Jia R, Gao B. Simultaneous analysis of five taste and odor compounds in surface water using solid-phase extraction and gas chromatography-mass spectrometry [J]. Frontiers of Environmental Science & Engineering, 2012, 6(1): 66-74.
[21] Deng X, Liang G, Chen J, Qi M, Xie P. Simultaneous determination of eight common odors in natural water body using automatic purge and trap coupled to gas chromatography with mass spectrometry [J]. Journal of Chromatography A, 2011, 1218(24): 3791-3798.
[22] Eisert R, Levsen K. Solid-phase microextraction coupled to gas chromatography: a new method for the analysis of organics in water [J]. Journal of Chromatography A, 1996, 733(1): 143-157.
[23] Lu D, Yang Y, Wu X, Zeng L, Li Y, Sun C. Simultaneous determination of eight vitamin E isomers and ��-tocopherol acetate in functional foods and nutritional supplements by gas chromatography- mass spectrometry [J]. Analytical Methods, 2015, 7(8): 3353-3362.
[24] Kotowska U,  M, Isidorov V. HS-SPME/GC�CMS analysis of volatile and semi-volatile organic compounds emitted from municipal sewage sludge [J]. Environmental Monitoring and Assessment, 2012, 184(5): 2893-2907.
[25] Lloyd S W, Lea J M, Zimba P V, Grimm C C. Rapid analysis of geosmin and 2-methylisoborneol in water using solid phase micro extraction procedures [J]. Water Research, 1998, 32(7): 2140-2146.
[26] Machado S, Goncalves C, Cunha E, Guimaraes A, Alpendurada M F. New developments in the analysis of fragrances and earthy-musty compounds in water by solid-phase microextraction (metal alloy fibre) coupled with gas chromatography-(tandem) mass spectrometry [J]. Talanta, 2011, 84(4): 1133-1140.
[27] Sung Y H, Li T Y, Huang S D. Analysis of earthy and musty odors in water samples by solid-phase microextraction coupled with gas chromatography/ion trap mass spectrometry [J]. Talanta, 2005, 65(2): 518-524.
[28] Zhang L F, Hu R K, Yang Z G. Simultaneous picogram determination of ��earthy-musty�� odorous compounds in water using solid-phase microextraction and gas chromatography-mass spectrometry coupled with initial cool programmable temperature vaporizer inlet [J]. Journal of Chromatography A, 2005, 1098(1/2): 7-13.
[29] Chen X, Luo Q, Yuan S, Wei Z, Song H, Wang D, Wang Z. Simultaneous determination of ten taste and odor compounds in drinking water by solid-phase microextraction combined with gas chromatography-mass spectrometry [J]. Journal of Environmental Sciences, 2013, 25(11): 2313-2323.
[30] Wright E, Daurie H, Gagnon G A. Development and validation of an SPE-GC-MS/MS taste and odour method for analysis in surface water [J]. International Journal of Environmental Analytical Chemistry, 2014, 94(13): 1302-1316.
[31] Gao M H, Gao N Y, Xie H H, An N, Deng Y, Rong W L. Quantitative analysis of trace levels of ��-ionone in water by liquid-liquid-phase extraction-gas chromatography-mass spectrometry (LLE-GC-MS) [J]. Journal of Central South University, 2015, 22(2): 472-477.
[32] Montes R, Rodr��guez I, Rub�� E, Ramil M, Cela R. Suitability of polypropylene microporous membranes for liquid- and solid-phase extraction of halogenated anisoles from water samples [J]. Journal of Chromatography A, 2008, 1198/1199: 21-26.
[33] Ardini F, Carro M D, Abelmoschi M L, Grotti M, Magi E. Multivariate optimization of a headspace solid-phase microextraction method followed by gas chromatography with mass spectrometry for the determination of terpenes in Nicotiana langsdorffii [J]. Journal of Separation Science, 2014, 37(13): 1570-1577.
[34] Liu Y, Miao Z, Guan W, Sun B. Analysis of organic volatile flavor compounds in fermented stinky tofu using SPME with different fiber coatings [J]. Molecules, 2012, 17(4): 3708-3722.
[35] Watson S B, Brownlee B, Satchwill T, Hargesheimer E E. Quantitative analysis of trace levels of geosmin and MIB in source and drinking water using headspace SPME [J]. Water Research, 2000, 34(10): 2818-2828.
[36] Boyd-Boland A A, Pawliszyn J B. Solid-phase microextraction of nitrogen-containing herbicides [J]. Journal of Chromatography A, 1995, 704(1): 163-172.
[37] Berijani S, Assadi Y, Anbia M, Milani Hosseini M R, Aghaee E. Dispersive liquid�Cliquid microextraction combined with gas chromatography-flame photometric detection: Very simple, rapid and sensitive method for the determination of organophosphorus pesticides in water [J]. Journal of Chromatography A, 2006, 1123(1): 1-9.
[38] Rezaee M, Assadi Y, Milani Hosseini M R, Aghaee E, Ahmadi F, Berijani S. Determination of organic compounds in water using dispersive liquid�Cliquid microextraction [J]. Journal of Chromatography A, 2006, 1116(1/2): 1-9.
[39] Chen J, Xie P, Ma Z, Niu Y, Tao M, Deng X, Wang Q. A systematic study on spatial and seasonal patterns of eight taste and odor compounds with relation to various biotic and abiotic parameters in Gonghu Bay of Lake Taihu, China [J]. Science of the Total Environment, 2010, 409(2): 314-325.
(Edited by YANG Hua)
Foundation item: Project(21277175) supported by the National Natural Science Foundation of China; Project(JCYJ20120618164317119) supported by Shenzhen Special Fund for development of Strategic Emerging, China
Received date: 2015-05-11; Accepted date: 2015-09-17
Corresponding author: LI Hai-pu, Professor; Tel: +86-731-88876961; E-mail: lihaipu@csu.edu.cn
Abstract: A simple and sensitive analytical procedure for the determination of multi-component compounds in water samples was developed and optimized using the headspace solid-phase microextraction (HSSPME) coupled with gas chromatography-mass spectrometry (GC-MS). Ten off-flavor compounds, including geosmin (GSM), 2-methylisoborneol (2-MIB), 2-isopropyl-3- methoxypyrazine (IPMP), 2-isobutyl-3-methoxypyrazine (IBMP), ��-ionone, trans-2,cis-6-nonadienal (NDE), 2,3,4-trichloroanisole (2,3,4-TCA), 2,3,6-trichroloanisole (2,3,6-TCA), 2,4,6-trichloroanisole (2,4,6-TCA), and 2,4,6-tribromoanisole (2,4,6-TBA) were used as the target analytes. The optimization of extraction parameters including fibers types, extraction time, extraction temperature, stirring rate, sample volume, and ionic strength was carried out through the univariate approach. Ten off-flavor compounds were quantified within 50 min under the optimal conditions. Calibration curves with good linearity (r2=0.990-0.998) were obtained in the range 1.0/2.0-100 ng/L, while the limits of detection for all compounds were lower than or close to the odor threshold concentration. Furthermore, the proposed method was applied to analyzing and determining the off-flavor compounds in real water samples from water-treatment plants.
