
J. Cent. South Univ. Technol. (2010) 17: 509-515
DOI: 10.1007/s11771-010-0515-3 ![]()
Chemical compositions and source apportionment of atmospheric PM10 in suburban area of Changsha, China
LI Jian-dong(���), DENG Qi-hong(������), LU Chan(·�), HUANG Bo-liang(�ư���)
School of Energy Science and Engineering, Central South University, Changsha 410083, China
? Central South University Press and Springer-Verlag Berlin Heidelberg 2010
Abstract:
Source apportionment of particulate matters with aerodynamic diameter less than 10 ��m (PM10) was conducted in the suburban area of Changsha, China. PM10 samples for 24 h collected with TEOM 1400a and ACCU system in July and October 2008 were chemically analyzed by the wavelength dispersive X-ray fluorescence (WD-XRF). Source appointment was implemented by the principal component analysis/absolute principal component analysis (PCA/APCA) to identify the possible sources and to quantify the contributions of the sources to PM10. Results show that as the PM10 concentration is increased from (85.6��43.7) ��g/m3 in July 2008 to (107.6��35.7) ��g/m3 in October 2008, the concentrations of the anthropogenic elements (P, S, Cl, K, Mn, Ni, Cu, Zn, and Pb) are basically increased but concentrations of the natural elements (Na, Mg, Al, Si, Ca, Ti, and Fe) are essentially decreased. Six main sources of PM10 are identified in the suburban of Changsha, China: soil dust, secondary aerosols, domestic oil combustion, waste incineration, traffic emission, and industrial emission contribute 57.7%, 24.0%, 9.8%, 5.0%, 2.0%, and 1.5%, respectively. Soil dust and secondary aerosols are the two major sources of particulate air pollution in suburban area of Changsha, China, so effective measures should be taken to control these two particulate pollutants.
Key words:
1 Introduction
Atmospheric PM10 (particulate matters with aerodynamic diameter less than 10 ��m) index is an important pollution indicator for urban air quality, and many countries and international organizations have set strict guidelines to control their concentrations [1]. Atmospheric particulate matters are now receiving worldwide attention due to their adverse impacts on the global climate, urban visibility, and particularly human health [2]. Recent epidemiological studies, both short- and long-term studies, have indicated strong association between elevated mass concentration of PM10 and increased morbidity and mortality due to respiratory and cardiovascular diseases [3-4].
However, according to the toxicological studies, it is not mass concentration but chemical composition of the particulate matters that leads to adverse health effects [5]. Once the particulate matters inhaled into the human bodies, their chemical compositions, especially trace metallic elements, could produce reactive oxygen species (ROS). ROS can oxidize and damage cells and/or tissues through oxidative stress, which eventually results in human diseases, aging, and cancers [6]. Therefore, knowledge of chemical compositions of the particulate matters is of great importance to evaluate the toxicity of particulate matters.
Urban air quality in China is getting worse with the rapid increase of the population, traffic, industrialization, and energy usage. Changsha, the capital city of Hunan Province, is one of the highly polluted cities in China, as reported by the Hunan Provincial Environmental Protection Bureau that the annual PM10 mass concentrations of Changsha have constantly exceeded the National Ambient Air Quality Standard (NAAQS) during the past four years. Furthermore, particulate air pollution in the suburban area is more serious due to intensive urban construction activities and industrial factories. In order to degrade the particulate air pollution and thus to protect human health, the most important task is to explore where the particulate matters come from or to find the sources, and then to develop control measures for the sources.
The chemical compositions of particulate matters are closely related to their origins or sources, i.e., the particles generated from different sources are of different chemical compositions, and thus we can identify the sources of the particulate matters based on their chemical composition data. This reverse process is called source apportionment, usually implemented by the method of receptor modeling [7]. Various receptor models such as chemical mass balance (CMB), principal component analysis/absolute principal component analysis (PCA/APCA), and positive matrix factorization (PMF), were applied to source apportionment [8]. PCA/APCA has the advantage of not requiring the knowledge as to the number of sources and source characteristics in advance, and thus is widely used in atmospheric particulate matter source apportionment studies [9-11].
The aim of the present study is to conduct source apportionment of particulate matters (PM10) of Changsha, China, based on their chemical compositions. First, PM10 samples in the suburban area were collected for 60 d. Then, the chemical compositions of the PM10 samples were analyzed. Finally, the source apportion- ment of PM10 was implemented by PCA/APCA receptor modeling.
2 Methods
2.1 Sampling site
Changsha (111.88?-114.25? N, 27.85?-28.68? E) is the capital of Hunan Province with a population of 6.37��106, and lies in the south-central China. It is surrounded by traditional heavy polluted industrial cites such as Zhuzhou and Xiangtan. Coal, electric power and liquefied natural gas are the major energy consumption in Changsha, and the industries are mainly composed of metallurgy and machinery. Changsha bears typical characteristics of hot summer and cold winter climate and high relative humidity. The average temperature during the hottest summer month is 25-30 �� with peak temperature above 40 ��, and the average temperature during the coldest winter month is 0-10 �� with the lowest temperature below 0 ��.
The sampling site locates at a suburban residential area of Changsha, which is adjacent to the campus of the Central South University. Instruments were placed on the roof of a five-story residential building, about 15 m above ground. Bare earth surface is common at this place, and there are a snack street, a bus station and a city beltway nearby. Residential cooking activity occurred regularly every day and sometimes refuse burning was observed during the sampling period.
2.2 Sampling and analysis
The sampling program for PM10 was performed during two separate periods: (1) July, from 1 July to 30 July in 2008; (2) October, from 30 September to 30 October in 2008. Sampling for 24 h was conducted with TEOM 1400a and ACCU system (Thermo Scientific, USA) everyday from 12:00 PM to 12:00 PM the next day, except for the rainy days. Teflon filters (Whatman, 46.2 mm in diameter, 2 ��m in pore size) were used to collect particulate matters, and they were kept in a constant temperature and humidity chamber (temperature: (25��0.5) ��, relative humidity: (40��4)%) for at least 24 h before and after collection. The PM10 concentrations were measured gravimetrically by weighing. Blank and loaded filters were weighed by an analytic micro-balance with a precision of 0.01 mg. After being weighed, loaded filters were stored in a refrigerator at about 4 �� before chemical analysis to limit the evaporation of volatile components. Field records including weather, local pollution events and instruments operating situations were made in detail during experiment time.
Sixteen inorganic elements including Na, Mg, Al, Si, P, S, Cl, K, Ca, Ti, Mn, Ni, Cu, Zn, Pb and Fe were detected by wavelength dispersive X-ray fluorescence (WD-XRF, Magix PW2424, Philips, Netherlands) for sampled filters, and other trace elements were excluded because more than 50% of the measurements were below detection limit. The elemental concentrations below detection limit were replaced by half of the detection limit.
2.3 Receptor modeling
Source apportionment method is based on receptor modeling, in which the mass balance between the samples at the receptor and their possible sources is assumed as follows:
![]() (1)
(1)
where i is the number of elements, i=1, 2, ��, m; j is the number of samples, j=1, 2, ��, n; k is the number of sources, k=1, 2, ��, p; cij represents the mass concentration of chemical components of PM10 measured by WD-XRF, ��g/m3; aik represents the source profile, %; and Skj is the source contribution, ��g/m3.
The tasks of source apportionment are to obtain three unknown parameters: the number of sources (p), Skj, and aik, from one known parameter, the measured mass concentration (cij). The ill-posed equation is statistically solved by the PCA/APCA using SPSS statistical software packages.
Above WD-XRF analysis generated a PM10 chemical composition database. It is generally observed that the elemental concentrations do not vary independently but co-vary to some extent, indicating common sources. The PCA/APCA helps to identify and quantify the impact of relevant sources on the measurement (receptor) site.
During the PCA, the chemical composition data are first transformed into a dimensionless standardized form:
![]() (2)
(2)
where Zij is the normalized Z-score of the concentration, ![]() and
and ![]() are mean concentration and standard deviation for element i. PCA involves a mathematical procedure that transforms a number of possibly correlated variables into a smaller number of uncorrelated variables called principal components (PCs) without significant loss of information and precision, which is expressed as
are mean concentration and standard deviation for element i. PCA involves a mathematical procedure that transforms a number of possibly correlated variables into a smaller number of uncorrelated variables called principal components (PCs) without significant loss of information and precision, which is expressed as
![]() (3)
(3)
where gik and hkj are the factor loadings and the factor scores, respectively. The factor loadings are usually transformed by varimax rotation so as to interpret the PCs as physical sources.
The APCA is then used, based on the PCA factor scores, to derive quantitative estimates of source contributions and source profiles [12]. Because the PCA results are based on normalized data, the true zero for each factor score should be calculated as
![]() (4)
(4)
The rescaled factor scores are known as the absolute principal component scores (APCS). Finally, regression can be used to derive the source contributions, expressed as
![]() (5)
(5)
where cj is the measured mass concentration of PM10 in sample j; ![]() is the absolute principal component score for source k in sample j;
is the absolute principal component score for source k in sample j; ![]() is the mass contribution in sample j made by source k; and ��0 is the mass contribution made by sources unaccounted in the PCA. Subsequently, aik can also be obtained from the regression between cij and Skj according to Eq.(1).
is the mass contribution in sample j made by source k; and ��0 is the mass contribution made by sources unaccounted in the PCA. Subsequently, aik can also be obtained from the regression between cij and Skj according to Eq.(1).
3 Results and discussion
3.1 Mass concentration and chemical compositions
Descriptive statistics of PM10 and their elemental concentrations are presented in Table 1. The average PM10 concentration, (101.10��39.00) ��g/m3, is slightly higher than the annual National Grade �� Standard (100 ��g/m3), but greatly exceeds the USA air quality standard (50 ��g/m3) and European limit (40 ��g/m3). The average PM10 concentration is (107.60��35.70) ��g/m3 in
Table 1 Descriptive statistics of PM10 and their elemental concentrations (mean concentration and standard deviation (SD)) during sampling periods (Concentration of PM10: ��g/m3; Concentration of elements: ng/m3)
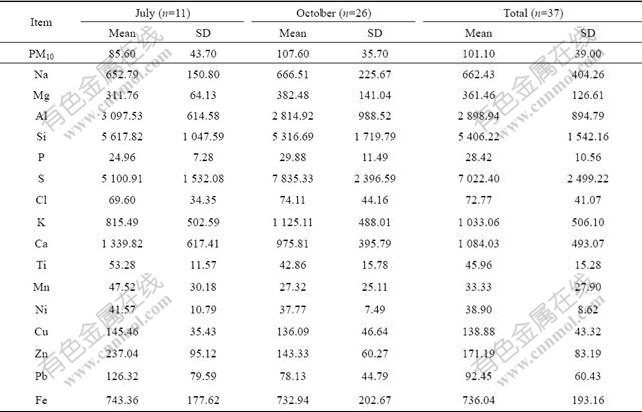
October 2008, which is higher than that in July 2008 ((85.60��43.70) ��g/m3). The meteorological variations should be the main factors affecting the PM10 concentration, as it is hot and rainy in July but turns to be cool and sunny in October. The relatively low wind speed and temperature in October favor the accumulation of particulate matters, while the high temperature in summer favors the air convection and the dispersion of pollutants. Similar seasonal variations of PM10 concentration were also observed in Refs.[13-15].
As shown in Table 1, the most abundant chemical composition of PM10 during the whole sampling period is S with an average concentration of (7 022.40��2 499.22) ng/m3, and followed by elements Si, Al, Ca, K, Fe, Na, Mg, Zn, Cu, Pb, Cl, Ti, Ni, Mn, and P. The chemical compositions can be basically divided into two groups: natural sources and anthropogenic sources. The natural source elements are mainly crustal elements (Na, Mg, Al, Si, Ca, Ti, and Fe) that are generated from the soil, road dust, and building construction activities. The elements (P, S, Cl, K, Mn, Ni, Cu, Zn, and Pb) generated from the anthropogenic sources are mainly due to the coal/fuel combustion, biomass burning, vehicle and industrial emissions. Table 1 shows that as PM10 concentration is increased from July to October in 2008, the concentrations of the anthropogenic elements are basically increased but concentrations of the crustal elements are essentially decreased. These findings are similar to the results in the recent studies where air pollution during cold season originates from anthropogenic sources whereas in summer time comes from natural sources [16-17].
3.2 Source apportionment
3.2.1 Source identification (number of sources)
The PCA was applied to the above chemical component dataset, and only six PCs were extracted based on two criteria: the first is that the cumulative percentage variance explained by all the chosen factors should be more than 85%, and the second is that only the factors with eigenvalue larger than unity are chosen. The results indicate that there are six different sources contributing the chemical elements at the sampling location. The varimax rotated factor loadings are shown in Table 2. The first principal component (PC1) has the largest eigenvalue (5.23) and accounts for the largest percentage of the total variance (33.04%). Thus this factor can be considered as the most important factor affecting the PM10 concentrations. The component is heavily loaded with Al, Si, Ti, Mg, Fe, Cl and Ca, most of which are common crustal components. As there are many bare earth surfaces and intensive building construction in the
Table 2 Varimax rotated factor loadings of PCA for PM10 elemental data
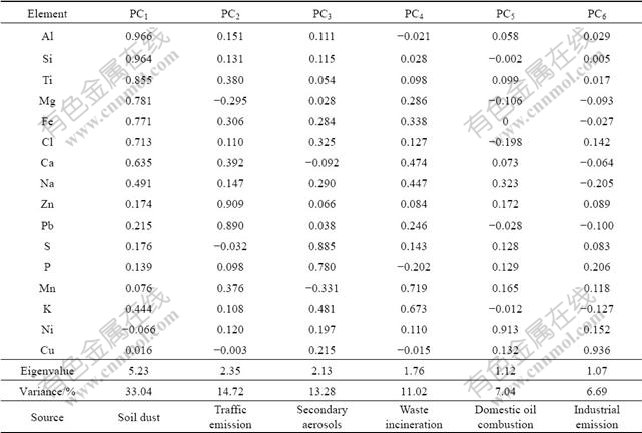
sampling area, this principal component represents soil dust, including both earth soil and construction dust. High loading for Cl may attribute to re-suspension of anthropogenic source in soil. The second principal component (PC2) was heavily loaded with Zn and Pb with an eigenvalue of 2.35 and a percentage variance of 14.72%. As Zn is usually an additive in rubber, the abrasion of bus tires may contribute to Zn in PM10. In addition, brake linings and motor oils are also considered as major sources of Zn [11, 18]. While for element Pb, though unleaded gasoline has been used in vehicle, there is still lead content in crude oil. Most of this lead is emitted to atmosphere after combustion, and gasoline is still a major source of Pb [19]. Therefore, PC2 can be considered as traffic emission. The third principal component (PC3) shows high loadings for elements S and P with a variance of 13.28% and an eigenvalue of 2.13. S is usually considered as a marker element for both coal combustion and secondary aerosols that are long transported from the surrounding areas or cities [20-21]. Therefore, this factor is identified as the mixed source due to coal combustion and secondary aerosols. The fourth principal component (PC4) explains a variance of 11.02% with moderate loadings of K and Mn with an eigenvalue of 1.76. K is usually a product of biomass burning [22] and Mn always exists in abandoned batteries. As burning activities (including leaves burning, wood burning and household refuse burning) occurred during sampling periods, this principal component is identified as waste incineration. The fifth principal component (PC5) is heavily loaded with Ni with an eigenvalue of 1.12 and a variance of 7.04%. Ni is thought to be one of the markers for oil combustion in several studies [23]. In this work, domestic cooking oil combustion is the main source of Ni in particulate matters because the sampling site locates at resident area and there is a snack street nearby. The last principal component (PC6) suggested an industrial source because of high factor loadings by the heavy metal element Cu with the least eigenvalue of 1.07 and variance of 6.69%. Metallurgic industrial emission nearby may be the main contributor of Cu. As a conclusion, PCA provides a qualitative understanding of the pollution sources, and the six sources of PM10 listed in the rank of their importance are respectively soil dust, traffic emission, secondary aerosols, waste incineration, domestic oil combustion and industrial emission.
3.2.2 Source contributions
During the APCA, the absolute principal component scores are regressed on the observed PM10 concentrations so as to apportion the particulate maters at the sampling site to the above identified sources. Fig.1 shows the contributions of the sources to PM10 at the suburban of Changsha. It is observed that the soil dust contributing more than half of PM10 (57.7%) is the dominant source, which indicates that soil from the bare earth surface and intensive building construction activities in the suburban of Changsha is the main particulate air pollutant. The second largest contributor is the coal combustion/ secondary aerosols, which account for 24.0% of the total mass concentration. This result demonstrates that the particulate air pollution in Changsha is highly affected by the surrounding cities. About 9.8% and 5.0% of PM10 mass concentrations are respectively contributed by the domestic oil combustion and waste incineration. Traffic emission contributes only 2.0% of the total mass concentration of PM10, which implicates that the traffic is not the main pollution for the medium-size city. The minimum contribution is from the industrial emission (1.5%), for there are few industrial factories in Changsha, China. It is obvious that the soil dust and secondary aerosols are two major particulate sources, which together account for 81.7% of PM10 mass concentrations at suburban of Changsha. This is consistent with the annual report of Hunan Provincial Environmental Protection Bureau (2007), which states that dust and fuliginous pollutions are the two major pollutions in Hunan Province. As compared to other cities, the soil dust contribution is increased but the traffic emission is
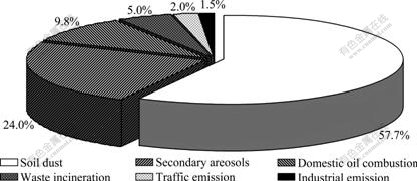
Fig.1 Source contributions of PM10 at suburban of Changsha, China
decreased [13, 15, 21]. It is worth noting that the rank of the sources according to their contributions is different from that in terms of the importance (Table 2). According to PCA, the second principal component that affects the PM10 concentration is the traffic emission, which is the fifth contributor to the mass concentration according to APCA.
APCA was also made separately for samples in July and October 2008, as displayed in Fig.2. The estimated source contribution is a little overestimation in July 2008 (total 100.7%) but a little underestimation in October 2008 (total 99.7%). It is found that the soil contribution in October 2008 is smaller than that in July 2008 but the coal combustion/secondary aerosols contribution is reversed. The source apportionment results confirm the former chemical analysis (Table 1), which indicates that air pollution during cold season originates mainly from anthropogenic sources, whereas that in summer time mainly comes from natural sources. In addition, the contribution from the traffic emission is also different, 4.6% for July 2008 but only 1.0% for October 2008.
3.2.3 Source profiles
Based on the above identified sources and quantified source contributions, the source profiles, i.e. the relative contribution of each source to the observed elemental concentrations, were obtained, as shown in Fig.3. It is clear that the total contributions from the identified sources to the observed elemental concentra- tions are basically within the range of (100��10)%, which indicates the results of the PCA/APCA receptor modeling in the present work are quite reliable and in a good agreement with the experimental results. The source contribution to the elemental concentration displayed in Fig.3 is closely related to the element��s factor loading in the PCA analysis as shown in Table 2. It is found that the source contributes large proportion to the elements of high loadings but less to the elements of low loadings, and the higher the loadings are, the more the source contributes. For example, the soil dust source contributes the largest mass proportions to the elements of higher loadings such as Al, Si, Ti, Mg, Cl, Ca and Fe, but much less to the elements Na and K of moderate loadings, and contributes nearly zero to elements Mn, Ni, and Cu for the reason that the factor loadings of these elements are too low. Similarly, the traffic emission contributes larger to the elements of higher loadings (Zn and Pb) than to the elements of lower loadings such as Mn, Ca, and Ti. As expected, elements S and P, Mn and
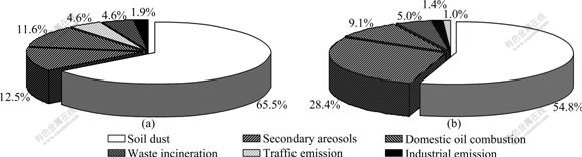
Fig.2 Source contributions to PM10 in July 2008 (a) and October 2008 (b) at suburban of Changsha, China
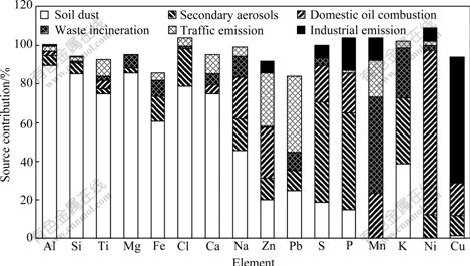
Fig.3 Relative source contributions to observed chemical compositions
K, Ni, and Cu are respectively mainly contributed by the secondary aerosols, the waste incineration, domestic oil combustion, and industrial emission, due to their higher factor loadings in the corresponding source.
4 Conclusions
(1) The average PM10 concentration at the suburban of Changsha, China, is (101.10�� 39.00) ��g/m3, which is slightly higher than the annual National Grade �� Standard (100 ��g/m3) and greatly exceeds the USA air quality standard (50 ��g/m3) and European limit (40 ��g/m3). The average PM10 concentration in October 2008 is higher than that in July 2008 due to the seasonal meteorological variations.
(2) The chemical compositions of PM10 can be basically divided into two groups: natural sources and anthropogenic sources. As PM10 concentration is increased from July 2008 to October 2008, the concentrations of the anthropogenic elements are basically increased but concentrations of the crustal elements are essentially decreased.
(3) Six main sources of PM10 are identified by PCA/APCA method: Soil dust, secondary aerosols, domestic oil combustion, waste incineration, traffic emission and industrial emission contribute 57.7%, 24.0%, 9.8%, 5.0%, 2.0%, and 1.5%, respectively.
(4) Soil dust and secondary aerosols are the most important particulate sources at the suburban of Changsha, China. In order to improve the air quality, effective measures should be taken by government to control these two particulate pollutants.
References
[1] CHAN C K, YAO X. Air pollution in mega cities in China [J]. Atmospheric Environment, 2008, 42(1): 1-42.
[2] KAISER J. Mounting evidence indicts fine-particle pollution [J]. Science, 2005, 307(5717): 1858-1861.
[3] BRUNEKREEF B, HOLGATE S T. Air pollution and health [J]. Lancet, 2002, 360(9341): 1233-1242.
[4] MCDONNELL W F, NISHINO-ISHIKAWA N, PETERSEN F F, CHEN L H, ABBEY D E. Relationships of mortality with the fine and coarse fractions of long-term ambient PM10 concentrations in nonsmokers [J]. Journal of Exposure Analysis and Environmental Epidemiology, 2000, 10(5): 427-436.
[5] OSTRO B, FENG W Y, BROADWIN R, GREEN S, LIPSETT M. The effects of components of fine particulate air pollution on mortality in California: Results from CALFINE [J]. Environmental Health Perspectives, 2007, 115(1): 13-19.
[6] GONZ?LEZ-FLECHA B. Oxidant mechanisms in response to ambient air particles [J]. Molecular Aspects of Medicine, 2004, 25(2): 169-182.
[7] WATSON J G, ZHU T, CHOW J C, ENGELBRECHT J, FUJITA E M, WILSON W E. Receptor modeling application framework for particle source apportionment [J]. Chemosphere, 2002, 49(9): 1093-1136.
[8] MANOLI E, VOUTSA D, SAMARA C. Chemical characterization and source identification/apportionment of fine and coarse air particles in Thessaloniki, Greece [J]. Atmospheric Environment, 2002, 36(6): 949-961.
[9] KARAR K, GUPTA A K. Source apportionment of PM10 at residential and industrial sites of an urban region of Kolkata, India [J]. Atmospheric Research, 2007, 84(1): 30-41.
[10] ITO K, XUE N, THURSTON G. Spatial variation of PM2.5 chemical species and source-apportioned mass concentrations in New York City [J]. Atmospheric Environment, 2004, 38(31): 5269-5282.
[11] SONG Y, XIE S, ZHANG Y, ZENG L, SALMON L G, ZHENG M. Source apportionment of PM2.5 in Beijing using principal component analysis/absolute principal component scores and UNMIX [J]. Science of the Total Environment, 2006, 372(1): 278-286.
[12] THURSTON G D, SPENGLER J D. A quantitative assessment of source contributions to inhalable particulate matter pollution in metropolitan Boston [J]. Atmospheric Environment, 1985, 19(1): 9-25.
[13] SUN Y, ZHUANG G, WANG Y, HAN L, GUO J, DAN M, ZHANG W, WANG Z, HAO Z. The air-borne particulate pollution in Beijing: Concentration composition, distribution and sources [J]. Atmospheric Environment, 2004, 38(35): 5991-6004.
[14] CHALOULAKOU A, KASSOMENOS P, SPYRELLIS N, DEMOKRITOU P, KOUTRAKIS P. Measurements of PM10 and PM2.5 particle concentrations in Athens, Greece [J]. Atmospheric Environment, 2003, 37(5): 649-660.
[15] WANG X, BI X, SHENG G, FU J. Chemical composition and sources of PM10 and PM2.5 aerosols in Guangzhou, China [J]. Environmental Monitoring and Assessment, 2006, 119(1/3): 425-439.
[16] CELIS J E, MORALES J R, ZAROR C A, INZUNZA J C. A study of particulate matter PM10 composition in the atmosphere of Chill��n, Chile [J]. Chemosphere, 2004, 54(4): 541-550.
[17] R??SLI M, THEIS G, N. K?NZLI N, STAEHELIN J, MATHYS P, OGLESBY L, CAMENZIND M, BRAUN-FAHRL?NDER C H. Temporal and spatial variation of the chemical composition of PM10 at urban and rural sites in the Basel area, Switzerland [J]. Atmospheric Environment, 2001, 35(21): 3701-3713.
[18] STERNBECK J, SJ?DIN ?, ANDR?ASSON K. Metal emissions from road traffic and the influence of re-suspension-results from two tunnel studies [J]. Atmospheric Environment, 2002, 36(30): 4735-4744.
[19] PACYNA E G, PACYNA J M. Current and future emissions of selected heavy metals to the atmosphere from anthropogenic sources in Europe [J]. Atmospheric Environment, 2007, 41(38): 8557-8566.
[20] LALL R, THURSTON G D. Identifying and quantifying transported vs. local sources of New York City PM2.5 fine particulate matter air pollution [J]. Atmospheric Environment, 2006, 40(S2): 333-346.
[21] MARCAZZAN G M, CERIANI M, VALLI G, VECCHI R. Source apportionment of PM10 and PM2.5 in Milan (Italy) using receptor modeling [J]. Science of the Total Environment, 2003, 317(1/3): 137-147.
[22] LIU X D, ESPEN P V, ADAMS F, CAFMEYER J, MAENHAUT W. Biomass burning in Southern Africa: Individual particle characterization of atmospheric aerosols and savanna fire samples [J]. Journal of Atmospheric Chemistry, 2000, 36(2): 135-155.
[23] HO K F, CAO J J, LEE S C, CHAN C K. Source apportionment of PM2.5 in urban area of Hong Kong [J]. Journal of Hazardous
Materials, 2006, 38(1): 73-85.
Abstract: Source apportionment of particulate matters with aerodynamic diameter less than 10 ��m (PM10) was conducted in the suburban area of Changsha, China. PM10 samples for 24 h collected with TEOM 1400a and ACCU system in July and October 2008 were chemically analyzed by the wavelength dispersive X-ray fluorescence (WD-XRF). Source appointment was implemented by the principal component analysis/absolute principal component analysis (PCA/APCA) to identify the possible sources and to quantify the contributions of the sources to PM10. Results show that as the PM10 concentration is increased from (85.6��43.7) ��g/m3 in July 2008 to (107.6��35.7) ��g/m3 in October 2008, the concentrations of the anthropogenic elements (P, S, Cl, K, Mn, Ni, Cu, Zn, and Pb) are basically increased but concentrations of the natural elements (Na, Mg, Al, Si, Ca, Ti, and Fe) are essentially decreased. Six main sources of PM10 are identified in the suburban of Changsha, China: soil dust, secondary aerosols, domestic oil combustion, waste incineration, traffic emission, and industrial emission contribute 57.7%, 24.0%, 9.8%, 5.0%, 2.0%, and 1.5%, respectively. Soil dust and secondary aerosols are the two major sources of particulate air pollution in suburban area of Changsha, China, so effective measures should be taken to control these two particulate pollutants.
