
Trans. Nonferrous Met. Soc. China 30(2020) 789-799
Acoustic emission source location considering refraction in layered media with cylindrical surface
Zi-long ZHOU1, Jing ZHOU1, Xin CAI1, Yi-chao RUI1, Lian-jun CHEN2, Hai-quan WANG1
1. School of Resources and Safety Engineering, Central South University, Changsha 410083, China;
2. State Key Laboratory of Mining Disaster Prevention and Control Co-founded by Shandong Province and the Ministry of Science and Technology, Shandong University of Science and Technology, Qingdao 266590, China
Received 28 October 2018; accepted 2 January 2020
Abstract:
To solve the problem that the existing acoustic emission (AE) source location algorithms cannot always obtain accurate results for multilayer cylindrical media, a new acoustic emission source location method considering refraction was proposed. AE source coordinates were solved by the complex method. Pencil-lead-break experiments were used to verify this method. The absolute distance errors of location results are less than 3 mm, much less than those by the traditional method. The numerical experiments were used to further analyze factors that affect location accuracy. The results of numerical experiments show that the location accuracy of the proposed method is not affected by the ratio of wave velocities but affected by the measurement accuracy of wave velocity. These results show that new method can obtain accurate AE source location in the two-layered cylindrical surface media such as the triaxial compression test.
Key words:
acoustic emission; source location; multilayer cylindrical media;
1 Introduction
Acoustic emission (AE) monitoring is widely used as a nondestructive testing method in different fields [1-4]. AE source location technique as an important application of AE monitoring has been widely used in fault diagnosis, cracking monitoring and oil or gas leak monitoring [5-8]. However, the existing AE source location method for certain applications in which monitored objects have a cylindrical surface is very challenging and cannot always achieve accurate location results. For example, as the main material test method [9], the specimen is settled inside an oil chamber in the triaxial compression tests. The AE sensors cannot be fixed on the specimen directly. To solve this problem, the equipment was improved [10]. However, the equipment improvement was significantly complex, and the original stress environment of specimens would be destroyed [11]. In other researches, AE sensors were put outside from the oil chamber directly. But these results have been reported to be somewhat inaccurate and disputable owing to the limits of traditional AE source location methods [12]. In fact, there are multiple hollow cylinders between AE sources and AE sensors in this situation. When adopting the traditional AE source location method with mixed wave velocity assumption, the two factors, namely the wave velocity difference of different cylinders and the influence of their cylindrical surfaces, are not considered. Therefore, it is difficult for the traditional AE source location method to provide accurate results.
In recent years, a substantial effort has been made to improve the accuracy of AE source location for different situations, and a large number of algorithms have been proposed [13-15]. Among them, the medium is assumed to be isotropic in most algorithms [16-18]. Ebrahimkhanlou and Salamone [19] proposed a single-sensor approach based on edge reflections in an isotropic plate. Experimental verification on the aluminum plate has achieved good results. Dong et al [20] proposed a new method without pre-measured wave velocity and concluded that the analytical solution is reasonable. The proposed method was validated by using numerical tests and experiments. Chen et al [21] proposed a novel AE source location method, which combined the selection of AE signals with high quality and a direct source location method, and improved the accuracy significantly. But, this method is only applicable to isotropic materials. Kao and Shan [22] introduced the source-scanning algorithm (SSA) and proved its viability by a series of tests. But, the exact measurement of velocity has a great influence on the accuracy of location results in this method because the ratio between the P wave and S wave velocity is required.
Anisotropic characteristics of media were considered in other algorithms [23-25]. KUNDU et al [26] proposed an improved algorithm for detecting the point of impact in anisotropic inhomogeneous plates. AL-Jumaili et al [27] studied on AE source location in complex structures by using full-automatic Delta-T mapping technique. This method excluded the requirement for operator expertise, saving time and preventing human errors. Based on the Delta-T mapping method, Pearson et al [28] further improved the original method by addressing the difficulties in identifying the precise arrival time of an acoustic emission signal. The results demonstrated that the improved method is more viable.
The AE source localization algorithm, which does not require the prior knowledge of material properties, has also been studied. Park et al [29] proposed a new AE source location method in an anisotropic plate by processing non-circular shape of wave fronts. This method does not need the prior knowledge of material properties. Sen and Kundu [30] proposed a new wave front shape- based approach for acoustic source localization in an anisotropic plate without knowing its material properties. Besides, a numerical study was used to present how the proposed methodology can accurately estimate the source coordinates.
All the above methods can effectively locate the AE source in a single line medium. Zhou et al [31,32] proposed an AE source location for multi-layered linear media, which is more reasonable for considering refraction of two different media. However, there is a lack of studying AE source location for multilayer cylindrical media.
In this study, a new AE source location method considering refraction was proposed to improve the location accuracy in two-layered cylindrical media. Subsequently, pencil-lead-break experiments were used to validate this method. In addition, a parametric analysis was conducted to study the influence of different factors on location accuracy.
2 Principle of AE source location considering refraction in two-layered cylindrical media
Taking AE monitoring in triaxial test as an example (Fig. 1), AE sensors are glued outside from the confining pressure chamber and there is an AE source at location S in the specimen. When adopting the traditional AE source location method, the acoustic signal is assumed to travel along a straight line (the green dot line in Fig. 1) between AE source and AE sensors, whose velocity is the mixed velocity of the chamber and the specimen. In fact, when wave signal travels at the interface of two media, wave refraction occurs [33,34]. The true travel path of the AE signal between the AE source and the AE sensor is shown as the red line in Fig. 1.
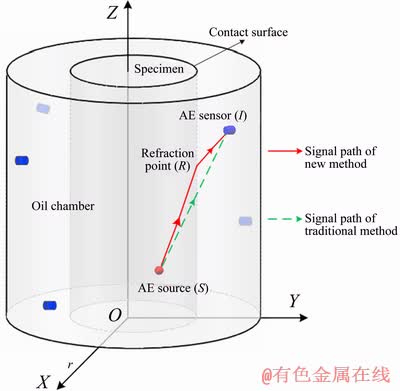
Fig. 1 Simplified model of conventional triaxial compression test of rock
As shown in Fig. 2, it is assumed that in the cylindrical coordinate system, the coordinates S (rs, ��s, hs), R (rri, ��ri, hri) and I (ri, ��i, hi) represent the locations of AE source, refraction point and AE sensor, respectively. C1 and C2 are wave velocities of the inner and outside cylinder, respectively. C represents the mixed velocity of the two-layered cylindrical surface media.

Fig. 2 Principle of location method considering refraction
For the traditional method (the wave path in the green dot line), the relationships can be expressed as follows.
The distance between the AE source S and the AE sensor I is determined:
 (1)
(1)
The time (TSI) that AE signals spread from AE source S to AE sensor I in the traditional method can be determined by
 (2)
(2)
The wave paths, spreading from AE source S to AE sensor I of the proposed method, are in the red line, as shown in Fig. 2.
The distance between the AE source S and the refraction point R of the path SR can be determined by
 (3)
(3)
The distance between the AE sensor I and the refraction point R can be determined by
 (4)
(4)
The used time of the AE signal that spreads in the internal medium is determined as
 (5)
(5)
The used time of acoustic wave that spreads in the outer medium can be determined as
 (6)
(6)
Then, the time of acoustic wave that spreads in the two-layered cylindrical media can be obtained as
 (7)
(7)
In the same way, the time of whole path that AE signal spreads from the AE source S to another AE sensor J is determined by
 (8)
(8)
According to the Fermat principle, the wave propagation follows the principle of the shortest time. The objective function of refraction point is established as
 (9)
(9)
where Ti is the shortest time that propagates from the AE source S to the AE sensor I. The simplex method is used to obtain the refraction point by solving the function f(rri, ri, hri).
The arrival time difference of the two sensors can be obtained as
 (10)
(10)
where Tij is the shortest arrival time difference of two sensors. It is assumed that there are n AE sensors. Thus, the shortest time equation exists between any two sensors. The arrival time difference matrix (T_M) is determined by

 (11)
(11)
The time that the AE signal spreads from AE source S to AE sensors is measured by the AE monitoring system. Meanwhile, the time is set as t1, t2, ��, tn. The measured arrival time difference matrix (T) is determined by
 (12)
(12)
The difference between two matrices is expressed as
E=T_M-T (13)
The objective function of AE source point is established as
F(rs, ��s, hs)=min E (14)
It is reasonable to assume that AE source is the true point when the error tends to be zero.
3 Solution process of proposed algorithm
Considering the refraction in layered media with cylindrical surface, two unknowns other than the AE source will be added with each additional AE sensor. So, it is difficult to obtain the analytic solution of AE source coordinates. The complex method is adopted to obtain AE source coordinates. The simplex method is adopted to obtain refraction coordinates. This method has low requirements in initial points and can find the optimal solution quickly. The flowchart of solution is shown as Fig. 3.
Step 1: Select the initial complex shape and define the reflection coefficient, contraction coefficient, expansion coefficient, reconstruction coefficient and precision. The initial complex shape is tetrahedron [35]. Each vertex of tetrahedron is assumed as the AE source.
Step 2: Put four vertexes of the initial composite into the function f(rri, ��ri, hri)=min Ti, and use the simple algorithm [35] to obtain coordinates of the refraction point by minimizing Ti.
Step 3: With the obtained refraction point coordinates in the previous step, number the four vertexes in the complex shape according to the size of the function value as
F(S0)��F(S1)��F(S2)��F(S3) (15)
Step 4: Obtain a new AE source by using the reflection coefficient, contraction coefficient, expansion coefficient and reconstruction coefficient in the first step. Then, repeat Steps 2 and 3 to obtain a new function value. Compare this new function value with the current optimal function values, and construct a new complex shape by replacing the worst vertex with a new optimal value.
Step 5: Repeat the above steps until the optimal results are obtained.
During the solution process, five AE sensors are used to locate the AE sources. Therefore, there are 10 unknowns other than the AE source. The total number of unknowns is 13. According to the Eq. (12), there are 10 data of time differences of arrival. In addition, there are 5 constraint conditions at the minimum onset time according to the Fermat��s law. Therefore, the 10 knows and 5 constraints ensure the AE source coordinates and the refraction coordinates can be solved uniquely. The unique solution cannot be obtained when the number of sensors is less than 5.
4 Pencil-lead-break experiments of AE source location in two-layered cylindrical media
AE signal of pencil-lead-break experiment was collected by AE monitoring system PCI-2, which is produced by Physical Acoustics Corporation (PAC). AE sources and AE sensors were positioned at different media. The acoustic signal was generated by pencil-lead-break. According to requirements of the pencil-lead-break experiment recorded in Metal Pressure Vessel Acoustic Emission Testing and Result Evaluation (GB/T 18182��2000), the size of HB pencil lead is 0.5 mm, and the pencil lead is broken at 60�� on the surface of the rock specimen. If the frequency of a signal ranged from 100 to 150 kHz and the amplitude ranged from 70 to 90 dB, this signal was considered as an effective signal. AE signals were amplified 40 dB with a pre-amplifier. The acquired sampling rate of AE signal data was set to be 2 MHz. The analog filter should be less than half of the sampling rate. The peak definition time (PDT) was set to be 40 ��s, the hit definition time (HDT) was set to be 150 ��s, and the hit lockout time (HLT) was set to be 300 ��s.

Fig. 3 Flowchart of solving refraction coordinates
The media used in the test are shown as Fig. 4(a). The inner cylinder material is granite. Its size is d100 mm �� 200 mm and wave velocity is 5128.21 m/s. The outside hollow cylinder is made of iron with 100 mm in inner diameter and 200 mm in external diameter. The height of the hollow cylinder is 200 mm. The wave velocity of the outside hollow cylinder is 5882.35 m/s. The mixed wave velocity is 5474.94 m/s. The two samples are assembled in the experiment, as shown in Fig. 4(b). The coupling agent is used on the contact surface to ensure the complete contact [36]. The coordinates of AE sensors are No. 1 (100, 0, 30), No. 2 (100, 60, 45), No. 3 (100, 90, 60), No. 4 (100, 180, 75), No. 5 (100, 240, 93), respectively. Coordinates of AE source are A (0, 0, 200), B (10, 30, 200), C (20, 90, 190), D (30, 150, 180), E (10, 210, 170), F (20, 270, 160), G (30, 330, 150), respectively. All of these coordinates are in the cylindrical coordinate system.

Fig. 4 Specimens (a) and AE source location system (b) used in this experiment
The experimental system of AE source location is shown in Fig. 4(b). Experiments were conducted repeatedly at each AE source point. Three groups of data that meet the requirements of GB/T 18182��2000 were selected as the experimental data.
One of the waveforms is shown in Fig. 5. Akaike information criterion (AIC) is used to determine the onset time. Besides, the onset time is verified by manual verification according to the waveform diagram, since AIC cannot obtain the accurate onset time for AE signals with interference such as device current or noise [37,38]. The time of pencil-lead-break signal arriving at the sensor No. 1 and sensor No. 2 is T1 and T2, respectively. The AE source coordinates are calculated with the newly proposed method. Then, these results are compared with those calculated by the traditional location method. It is assumed that the true AE source coordinates are (r0, ��0, h0), and the calculated AE source coordinates are (r, ��, h). Then, the difference between these two AE sources which is called the absolute distance error can be determined as
 (16)
(16)
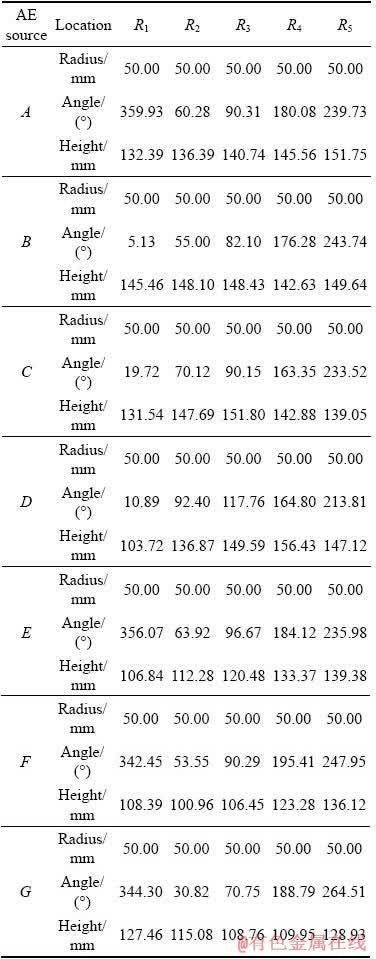
As shown in Fig. 6, the coordinates of AE sources, solved by the proposed method and the traditional location method, are plotted on the two-dimensional coordinate system. From Table 1,it can be seen that errors solved by the proposed method are within 0.09-3.98 mm, while the errors solved by the traditional method are within 3.04- 21.34 mm which are much larger than those solved by the proposed method. It can be illustrated that location results of the proposed method are better than those of the traditional method. Table 2 gives the results of refraction point coordinates. For one AE source, each AE sensor corresponds to one refraction point. Therefore, there are five refraction points for each AE source.

Fig. 5 Arrival time of pencil-lead-break signal at sensor No. 1 (a) and No. 2 (b)
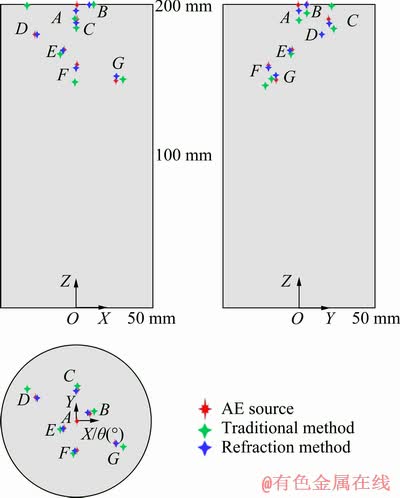
Fig. 6 Results of proposed and traditional methods in 3D location experiment
Table 1 Results of AE source location
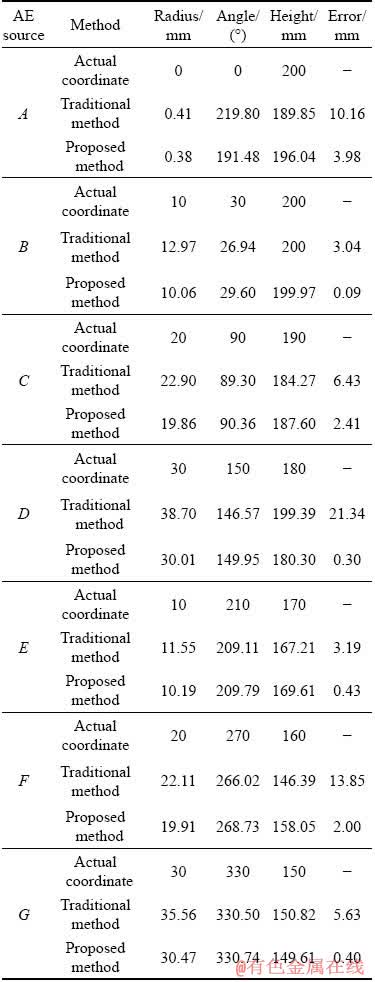
Table 2 Results of refraction point coordinates
5 Analysis of factors influencing location accuracy
The proposed method considers the characteristics of layered media and uses different velocities in the solving process of AE source location. Therefore, the wave velocity ratio of two different media and the error of measured wave velocity are main factors influencing location accuracy.
These factors are analyzed by using a numerical experiment. The model used in this numerical experiment is shown in Fig. 7. The inner specimen is columnar with the size of d100 mm �� 200 mm. The outside specimen is a hollow cylinder with an inner diameter of 100 mm, an external diameter of 200 mm and a height of 200 mm. Five AE sensors are used for the numerical experiment. Their coordinates are No. 1 (100, 0, 30), No. 2 (100, 60, 45), No. 3 (100, 90, 60), No. 4 (100, 180, 75) and No. 5 (100, 240, 93). The coordinates of AE source are A (0, 0, 200), B (10, 30, 200), C (20, 90, 190) and D (30, 150, 180), respectively.

Fig. 7 Model of AE location in numerical experiment
Different wave velocity ratios are set to study their influence on location accuracy. It is assumed that the velocity (C1) of inner media is 2000 m/s. C2 is the wave velocity of the outside media. Different velocity ratios are determined by changing the value of the velocity C2. The velocity of each group is shown in Table 3.
First, the arrival time of each AE source is calculated under different velocity ratios. Then, comparison results of numerical experiments are obtained between the proposed method and the traditional method. Absolute distance errors are shown in Fig. 8.
Table 3 Velocity of each group


Fig. 8 Absolute distance errors under different velocity ratios
It can be seen that, through the traditional method, absolute distance errors of mixed velocity increase with the increasing velocity ratios. The traditional method has a great error when the velocity difference is large. For the same AE source, through the proposed method, absolute distance errors are stable at about 0.1 mm under different velocity ratios. Four curves of the absolute distance errors solved by the proposed method are almost overlapped in Fig. 8. Meanwhile, the location accuracy of the proposed method is not affected by velocity ratio.
The influence of wave velocity measured errors on the precision of location results is also analyzed. The wave velocity of one medium (C1) is 3000 m/s. The wave velocity of the other medium (C2) is 4000 m/s and the mixed wave velocity (V) is 3431.13 m/s. The coordinates of AE sources and sensors are the same as the previous simulation experiment. One of the wave velocity (C2) is changed to simulate the measured velocity errors, varying from 0 to 3%. Location errors caused by measured velocity errors of two methods are shown in Fig. 9. When the measured error of wave velocity is same, it can be seen that the absolute distance error of traditional method is much larger than that of proposed method. The accuracy of these two methods are both influenced by the measured error of wave velocity.

Fig. 9 Absolute distance errors with different velocity accuracies
6 Conclusions
(1) By adopting the proposed AE source location method, absolute distance errors of pencil-lead-break experiment are less than 3 mm, much less than that by the traditional method. The results show that the proposed method is superior to the traditional method in location accuracy and stability.
(2) According to the results of the numerical experiment, the newly proposed method is not affected by different wave velocity ratios. Using the traditional algorithm of mixed velocity, absolute distance errors increase with the increasing velocity ratios. Therefore, the proposed AE source location method is much more reasonable than the traditional method in the location of multi-layered cylindrical medium.
(3) This proposed AE source location method considering refraction can be used for the AE source location in the two-layered cylindrical surface media such as the triaxial compression test.
References
[1] LUO Zhou-quan, WANG Wei, QIN Ya-guang, XIANG Jun. Early warning of rock mass instability based on multi-field coupling analysis and microseismic monitoring [J]. Transactions of Nonferrous Metals Society of China, 2019, 29(6): 1285-1293.
[2] CHANG Hong. Identification of damage mode in AZ31 magnesium alloy under tension using acoustic emission [J]. Transactions of Nonferrous Metals Society of China, 2015, 25(6): 1840-1846.
[3] ZHOU Zi-long, WANG Hai-quan, CAI Xin, CHEN Lu, E Yu-de, CHENG Rui-shan. Damage evolution and failure behavior of post-mainshock damaged rocks under aftershock effects [J]. Energies, 2019, 12(23): 4429-4446.
[4] ZHAO Guo-yan, MA Ju, DONG Long-jun, LI Xi-bing, CHEN Guang-hui, ZHANG Chu-xuan. Classification of mine blasts and microseismic events using starting-up features in seismograms [J]. Transactions of Nonferrous Metals Society of China, 2015, 25(10): 3410-3420.
[5] CHOUDHURY A, TANDON N. Application of acoustic emission technique for the detection of defects in rolling element bearings [J]. Tribology International, 2000, 33(1): 39-45.
[6] LIAO T W. Feature extraction and selection from acoustic emission signals with an application in grinding wheel condition monitoring [J]. Engineering Applications of Artificial Intelligence, 2010, 23(1): 74-84.
[7] LI Zhuo, RAO Qiu-hua, LI Peng, YI Wei. Crack initiation rate of brittle rock under thermal-hydro-mechanical coupling condition [J]. Transactions of Nonferrous Metals Society of China, 2018, 28(10): 2107-2113.
[8] ZHOU Zi-long, CAI Xin, LI Xi-bing, CAO Wen-zhuo, DU Xue-ming. Dynamic response and energy evolution of sandstone under coupled static-dynamic compression: Insights from experimental study into deep rock engineering applications [J]. Rock Mechanics and Rock Engineering, 2019: 1-27. DOI: 10.1007/s00603-019-01980-9.
[9] HEO J S, LEE C I, JEON S K. Measurement of acoustic emission and source location considering anisotropy of rock under triaxial compression [J]. Key Engineering Materials, 2004, 270-273: 1574-1579.
[10] ALKAN H, CINAR Y, PUSCH G. Rock salt dilatancy boundary from combined acoustic emission and triaxial compression tests [J]. International Journal of Rock Mechanics and Mining Sciences, 2007, 44(1): 108-119.
[11] CHANG S H, LEE C I. Estimation of cracking and damage mechanisms in rock under triaxial compression by moment tensor analysis of acoustic emission [J]. International Journal of Rock Mechanics and Mining Sciences, 2004, 41(7): 1069-1086.
[12] YANG Sheng-qi, JING Hong-wen, WANG Shan-yong. Experimental investigation on the strength, deformability, failure behavior and acoustic emission locations of red sandstone under triaxial compression [J]. Rock Mechanics and Rock Engineering, 2012, 45(4): 583-606.
[13] DONG Long-jun, LI Xi-bing. Three-dimensional analytical solution of acoustic emission or microseismic source location under cube monitoring network [J]. Transactions of Nonferrous Metals Society of China, 2012, 22(12): 3087-3094.
[14] GE Mao-chen. Analysis of source location algorithms. Part I: Overview and non-iterative methods [J]. Acoustic Emission, 2003, 21: 14-24.
[15] HUANG Lin-qi, LI Xi-bing, Dong Long-jun, ZHANG Chu-xuan, LIU Dong. Relocation method of microseismic source in deep mines [J]. Transactions of Nonferrous Metals Society of China, 2016, 26(11): 2988-2996.
[16] SEDLAK P, HIROSE Y, ENOKI M. Acoustic emission localization in thin multi-layer plates using first-arrival determination [J]. Mechanical Systems and Signal Processing, 2013, 36(2): 636-649.
[17] DONG Long-jun, SUN Dao-yuan, LI Xi-bing, DU Kun. Theoretical and experimental studies of localization methodology for AE and microseismic sources without pre-measured wave velocity in mines [J]. IEEE Access, 2017, 5: 16818-16828.
[18] HENSMAN J, MILLS R, PIERCE S G, WORDEN K, EATON M. Locating acoustic emission sources in complex structures using Gaussian processes [J]. Mechanical Systems and Signal Processing, 2010, 24(1): 211-223.
[19] EBRAHIMKHANLOU A, SALAMONE S. Acoustic emission source localization in thin metallic plates: A single-sensor approach based on multimodal edge reflections [J]. Ultrasonics, 2017, 78(1): 134-145.
[20] DONG Long-jun, LI Xi-bing, ZHOU Zi-long, CHEN Guo-wen. Three-dimensional analytical solution of acoustic emission source location for cuboid monitoring network without pre-measured wave velocity [J]. Transactions of Nonferrous Metals Society of China, 2015, 25(1): 293-302.
[21] CHEN Shi-wan, YANG Chun-he, WANG Gui-bin, LIU Wei. Similarity assessment of acoustic emission signals and its application in source localization [J]. Ultrasonics, 2017, 75: 36-45.
[22] KAO H, SHAN Shao-Ju. The source-scanning algorithm: Mapping the distribution of seismic sources in time and space [J]. Geophysical Journal International, 2004, 157(2): 589-594.
[23] HAJZARGERBASHI T, KUNDU T, BLAND S. An improved algorithm for detecting point of impact in anisotropic inhomogeneous plates [J]. Ultrasonics, 2011, 51(3): 317-324.
[24] DONG Long-jun, ZOU Wei, LI Xi-bing, SHU Wei-wei, WANG Ze-wei. Collaborative localization method using analytical and iterative solutions for microseismic/acoustic emission sources in the rockmass structure for underground mining [J]. Engineering Fracture Mechanics, 2019, 210: 95-112.
[25] NIRI E D, FARHIDZADEH A, SALAMONE S. Nonlinear Kalman Filtering for acoustic emission source localization in anisotropic panels [J]. Ultrasonics, 2014, 54(2): 486-501.
[26] KUNDU T, NAKATANI H, TAKEDA N. Acoustic source localization in anisotropic plates [J]. Ultrasonics, 2012, 52(6): 740-746.
[27] AL-JUMAILI S K, PEARSON M R, HOLFORD K M, EATON M J, PULLIN R. Acoustic emission source location in complex structures using full automatic delta T mapping technique [J]. Mechanical Systems and Signal Processing, 2016, 72: 513-524.
[28] PEARSON M R, EATON M, FEATHERSTON C, PULLIN R, HOLFORD K. Improved acoustic emission source location during fatigue and impact events in metallic and composite structures [J]. Structural Health Monitoring, 2017, 16(4): 382-399.
[29] PARK W H, PACKO P, KUNDU T. Acoustic source localization in an anisotropic plate without knowing its material properties��A new approach [J]. Ultrasonics, 2017, 79(1): 9-17.
[30] SEN N, KUNDU T. A new wave front shape-based approach for acoustic source localization in an anisotropic plate without knowing its material properties [J]. Ultrasonics, 2018, 87(1): 20-32.
[31] ZHOU Zi-long, ZHOU Jing, DONG Long-jun, RUI Yi-chao, KE Chang-tao. Experimental study on the location of an acoustic emission source considering refraction in different media [J]. Scientific Reports, 2017, 7(1): 7472-7485.
[32] ZHOU Zi-long, RUI Yi-chao, ZHOU Jing, DONG Long-jun, CAI Xin. Locating an acoustic emission source in multilayered media based on the refraction path method [J]. IEEE Access, 2018, 6: 25090-25099.
[33] HAVSKOV J, OTTEMOLLER L, LIU Jun-min, ZHU Guo-fu, WANG Xiao-ming. Routine data processing in seismology: example data, exercises, and software [M]. Beijing: National Defense Industry Press, 2017. (in Chinese)
[34] MENG Xiao-Chun. Seismic information analysis technology [M]. Beijing: Earthquake Press, 2005. (in Chinese)
[35] Gong Chun, Wang Zheng-lin. Proficient in MATLAB optimization calculation [M]. Beijing: Publishing House of Electronics Industry, 2009. (in Chinese)
[36] XU Jiang, LI Shu-chun, TANG Xiao-jun, TAO Yun-qi, JIANG Yong-dong. Analysis of the influencing factors of acoustic emission location experiment under uniaxial compression [J]. Chinese Journal of Rock Mechanics and Engineering, 2008, 4: 122-129. (in Chinese)
[37] ZHOU Zi-long, CHENG Rui-shan, RUI Yi-chao, ZHOU Jing, WANG Hai-quan. An improved automatic picking method for arrival time of acoustic emission signals [J]. IEEE Access, 2019, 7: 75568-75576. doi: 10.1109/ACCESS. 2019.2921650.
[38] ZHOU Zi-long, CHENG Rui-shan, CHEN Lian-jun, ZHOU Jing, CAI Xin. An improved joint method for onset picking of acoustic emission signals with noise [J]. Joutnal of Central South University, 2019, 26: 2878-2890.
�����״���ʿ�������ЧӦ��������Դ��λ
������1���� ��1���� ��1�����ճ�1��������2������Ȫ1
1. ���ϴ�ѧ ��Դ�밲ȫ����ѧԺ����ɳ 410083��
2. ɽ���Ƽ���ѧ ��ɽ�ֺ�Ԥ������ʡ�����������ص�ʵ�����������أ��ൺ 266590
ժ Ҫ��Ϊ�˽������������Դ��λ�㷨�Զ��������ʶ�λ�����ȷ�����⣬���һ���µĿ��������������Դ��λ�㷨�����ø������㷨���õ�������Դ���꣬���ö�Ǧ������֤���㷨��ȷ�ԡ����㷨��λ����ľ��Ծ������С��3 mm���ȴ�ͳ�㷨�нϴ����ߡ�������ֵ������ж�λ����Ӱ�����ط�����������������㷨��������Դ��λ���Ȳ��ܲ�״���ʲ��ٱȵ�Ӱ�죬���������ٵ�ȷ�ԶԶ�λ������Ӱ�졣��Щ��˵�����㷨�ܹ�������������ʱ��糣������ѹ�������еõ�ȷ��������Դλ�á�
�ؼ��ʣ������䣻Դ��λ����״�������
(Edited by Bing YANG)
Foundation item: Project (2015CB060200) supported by the National Basic Research Program of China; Project (41772313) supported by the National Natural Science Foundation of China; Project (MDPC201803) supported by the Open Fund Research Program of State Key Laboratory of Mining Disaster Prevention and Control Co-founded by Shandong Province and the Ministry of Science and Technology, China; Project (2019zzts308) supported by the Fundamental Research Fund for the Central Universities of Central South University, China
Corresponding author: Xin CAI; Tel: +86-15675118204; E-mail: xincai@csu.edu.cn
DOI: 10.1016/S1003-6326(20)65254-2
Abstract: To solve the problem that the existing acoustic emission (AE) source location algorithms cannot always obtain accurate results for multilayer cylindrical media, a new acoustic emission source location method considering refraction was proposed. AE source coordinates were solved by the complex method. Pencil-lead-break experiments were used to verify this method. The absolute distance errors of location results are less than 3 mm, much less than those by the traditional method. The numerical experiments were used to further analyze factors that affect location accuracy. The results of numerical experiments show that the location accuracy of the proposed method is not affected by the ratio of wave velocities but affected by the measurement accuracy of wave velocity. These results show that new method can obtain accurate AE source location in the two-layered cylindrical surface media such as the triaxial compression test.
