
Trans. Nonferrous Met. Soc. China 25(2015) 3865-3876
Influence of ECAP as grain refinement technique on microstructure evolution, mechanical properties and corrosion behavior of pure aluminum
Mohamed Ibrahim ABD EL AAL1, M. M. SADAWY2
1. Mechanical Design and Production Department, Faculty of Engineering, Zagazig University, Zagazig 44519, Egypt;
2. Mining and Petroleum Engineering Department, Al-Azhar University, Nasr City; Cairo 11651, Egypt
Received 28 January 2015; accepted 26 June 2015
Abstract:
Pure aluminum samples were processed by equal channel angular pressing (ECAP) up to 10 passes at room temperature. The effects of the ECAP number of passes on the microstructure evolution, the mechanical properties, deformation homogeneity and corrosion behavior of the processed samples were fully investigated. The imposed strain resulted in an obvious reduction in the grain size from 390 ��m before ECAP down to 1.8, 0.4, and 0.3 ��m after ECAP up to 2, 4 and 10 passes, respectively. The microhardness, deformation homogeneity and tensile strength were increased while the elongation decreased with the increase of ECAP number of passes. Immersion tests, open circuit potential, Tafel polarization, cyclic polarization and potentiostatic measurements in 3.5% NaCl solution revealed an obvious improvement in the corrosion resistance of ECAP processed samples compared with the as-cast sample. The increase of the number of passes can be used successfully in producing ultra-fine grained (UFG) bulk pure aluminum sample with a high misorientation angle, reasonably high mechanical properties and corrosion resistance.
Key words:
equal channel angular pressing (ECAP); microstructure; mechanical properties; corrosion resistance; passive film; pitting;
1 Introduction
Nanostructured and submicrometer materials meet some unique mechanical and physical properties and high performances due to their small grain sizes. Equal channel angular pressing (ECAP) is considered the most applicable severe plastic deformation (SPD) process for producing ultra-fine grained (UFG) and nanocrystalline (NC) materials. The large bulk sizes of processed samples make ECAP the most applied method in producing nano and ultra-fine structured mechanical parts. ECAP process principles were discussed briefly in previous works [1,2]. Al and its alloys are used widely in different applications such as automotive and aircraft industries due to their light weight. Al and its alloys samples with fine grain microstructures, which lead to an obvious improvement in the mechanical and physical properties, have been an important focus of research in the last two decades. Different previous works have elucidated the effect of grain refinement by ECAP on the improvement of the mechanical properties of Al and its alloys [3-7].
It is well known that Al and its alloys have high corrosion resistance by its oxide film in the atmospheric environment. Pitting is the most common corrosion form of Al and its alloys, particularly in solutions containing halide ions. A vast number of works about corrosion and pitting of Al and its alloys have been reported [8-12]. Recently, the effect of grain size on the corrosion behavior of alloys has received a lot of attention. Some researchers reported that grain refinement can improve corrosion resistance of different alloys [13-16]. While others found that grain refinement improved the mechanical property of alloys without increasing the corrosion resistance [17]. Moreover, some researchers found that the grain refinement with ECAP decreased the corrosion resistance of Al-Mg [18] and pure Mg alloys [19]. On the other hand, a relationship similar to Hall-Petch for grain size depending on the corrosion rate has been proposed [20].
Therefore, the present work was performed to study the effect of ECAP number of passes as a grain refinement technique on the microstructure evolution, mechanical properties, deformation homogeneity and corrosion behavior of Al1080.
2 Experimental
2.1 ECAP samples processing, microstructure observation and mechanical properties measurements
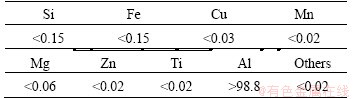
Commercially pure Al1080 samples with chemical composition listed in Table 1 were used in the present work. The samples were machined to cylinders of 15 mm in diameter and 70 mm in length for ECAP process. The ECAP process was carried out up to 10 passes at room temperature by route A [1] using a split die with a diameter of 15 mm, inner angle of 105��, and an outer arc angle of 25��. The die induces strain of about 0.8 for each pass according to IWAHASHI et al [2]. The ECAP process procedures and a similar die design were reported in previous works [3,4].
Table 1 Chemical composition of commercially pure aluminum Al1080 (mass fraction, %)
The microstructure observations were carried out before and after the ECAP process. The microstructure of as-cast sample was examined by an optical microscope model NIKON. The as-cast samples were ground by different SiC emery papers up to 4000, followed by polishing using alcohol and diamond paste suspensions to mirror-like surfaces, then etched by Keller��s reagent. The measurement of the grain size before the ECAP was carried out by using the line intercept method using software Lince242udt particle size [21]. The microstructure observations after the ECAP were performed by scanning electron microscopy (SEM) with electron backscatter diffraction (EBSD). A 3-dimensional total analysis system (dual beam FIB) equipped with EBSD (Link EDAX system) was used in the microstructure examination. The selection of the EBSD over TEM in performing the microstructure observations is due to the following reasons. Firstly, bulk samples can be used in the case of EBSD with simple sample preparation, relative to the electron transparent thin samples need for TEM which require long time, high cost, and complicated preparations [22,23]. Secondly, the relatively large size samples and so large scan area in the case of EBSD, relative to the small sample with narrow area in the case of the TEM, made the number of the grains obtained by EBSD maps more representative for the microstructure than that in the TEM [22]. Thirdly, the larger sample size in the case of the EBSD is very useful in the study of the homogeneity in microstructure refinement during deformation [23]. In the present work, an area of 13.5 ��m �� 39 ��m was selected as the scan area during the EBSD examination.
An associated software (OIM 4.5) was used in the microstructure examination. The points with a confidence index (CI) less than 0.1 were removed in order to use more credible and accurate data in the EBSD results analysis [24]. The OIM 4.5 system consists of two packages, one for the data collection during the scanning process and the other one for the data analysis. So, the creation of the grain maps and the related calculation such as the grain size and grain boundary misorientation angles can be automatically done with a high level of reliability. The misorientation angles with lower values than the grain tolerance angle of 2�� were excluded from the EBSD data analysis [24]. Furthermore, the grains with a size less than 5 times the step size used in the mapping process were removed from the grain size calculations. The EBSD samples were prepared, in the same way, used in the case of the optical microscope observations of the as-cast samples. The samples were further polished using a mixture of colloidal silica and ethanol for 1 h to obtain a very shiny surface.
The as-cast and ECAP-treated samples were cut in the direction normal to the pressing direction, ground and polished to a mirror-like surface [21,25]. Vickers microhardness was measured using a Mitutoyo tester under an applied load of 980 N and dwell time of 15 s, in a regular grid pattern with a spacing of 0.5 mm between each point [25]. The Vickers microhardness values were plotted in the form of color-coded contour maps showing the variations in the microhardness through the sample surface. A total of 701 microhardness measurements were made on each sample. The average value of all microhardness measurements was taken as the average microhardness in each condition. The standard deviation value (��) of the microhardness measurements in each condition was calculated in order to assess the deformation inhomogeneity index, using the following equation:
 (1)
(1)
where Hi, Hav, and N are the microhardness value at each point, the average microhardness value, and the number of measurements, respectively [25].
The tensile test was performed up to failure at room temperature by a UNITECH micro load system machine under a constant strain rate of 9��10-3 s-1. The dog-bone- like micro tensile samples with 1.5 mm in gage length were machined from the ECAP-treated sample parallel pressing direction. The tensile samples were machined by wire cut followed by polishing of both sides of the sample to a mirror-like surface. The tensile test was repeated three times for each condition for more reliability of the measurements and the average value was used in the present results.
2.2 Corrosion experiments
2.2.1 Mass loss method
Static immersion corrosion tests were carried out at room temperature according to ASTM G1 and G31 [26,27]. The as-cast and ECAP-treated Al1080 samples were cut into discs of 12 mm in diameter and 5 mm in height using disc cutter for immersion tests. Before immersing in 3.5% NaCl aqueous solution, the samples were prepared by grinding up to 1200 using SiC emery papers then cleaned with deionized water followed by rinsing with acetone and dried in air. The samples were weighed before exposure by means of a digital balance with a sensitivity of 10-7 kg for the original mass (m0) and then hung in test solutions. After immersion for 15 d, the corroded specimens were removed from the solutions, cleaned with HNO3 solution for 3 min and dried. Finally, the samples were weighed again in order to obtain the final mass (m1). The corrosion rate R (from the mass loss) was calculated using the following equation [26,27]:
 (2)
(2)
where K, m, A, �� and t are constant (3.45 �� 106), mass loss approximates to the nearest 0.1 mg, area (cm2), density of the material (2.7 g/cm3) and time of exposure (h), respectively.
2.2.2 Electrochemical techniques
The electrochemical behaviors of as-cast and ECAP-treated Al1080 samples were investigated by using Potentiostat/Galvanostat (EG&G model 273). M352 corrosion software from EG&G Princeton Applied Research was used for the electrochemical measure- ments. A three-electrode cell composed of a specimen as a working electrode, Pt as counter electrode, and Ag/AgCl as reference electrode was used for the tests. The as-cast and ECAP-treated Al1080 discs with exposed surface area of 0.5 cm2 were used as the working electrodes. All samples were prepared by grinding using 1200 SiC emery papers in water and finally discs were rinsed in ethanol.
The open-circuit potential (OCP) was recorded after immersion of the electrode in the test solution for 15 min (vs Ag/AgCl). Tafel polarization tests were carried out at a scan rate of 0.5 mV/min. The corrosion rate from Tafel plot can be calculated automatically in the test using the following equation:
 (3)
(3)
where Mr, J, n and �� are relative molecule mass, corrosion current density (��A/cm2), valence, and density (g/cm3), respectively. The cyclic potentio- dynamic curves were obtained by scanning the potential in the forward direction from -1200 mV (vs Ag/AgCl) towards the anodic direction at a scan rate of 2.0 mV/s. The potential scan was reversed in the backward direction when the current density reached 0.1 mA/cm2. Potentiostatic measurements were carried out at -500 and 500 mV (vs Ag/AgCl) for 5 min, where the anodic current was recorded as a function of time. At least three separate experiments were carried out for each run to ensure reliability of results.
Morphologies of the corroded surfaces of the tested alloys after cyclic polarization tests were examined using a field emission scanning electron microscope (FE-SEM), model JEOL JSM-6330F at a voltage of 15 kV. All corrosion experiments were carried out in 3.5% NaCl solution as electrolyte. The measurement of the pit size was carried out by using the line intercept method using software Lince242udt particle size [21]. The solutions were prepared from analytical grade and chemically pure reagents using distilled water.
3 Results and discussion
3.1 Microstructure evolution
The microstructure of the as-cast Al1080 sample is shown in Fig. 1. It is noted that the microstructure consists of a dendritic structure, with an average grain size of 390 ��m. The color-coded orientation maps of the Al1080 samples deformed by ECAP using route A up to 2, 4 and 10 passes are shown in Fig. 2. The grain colors shown in the EBSD maps correspond to the orientations in the unit triangle shown in Fig. 2. After 2 passes, the grains appear to be elongated grain as shown in Fig. 2(a). This observation is in agreement with the microstructure observations of 99.99% Al processed by route A using die angle of 90�� [28]. The average grain size after 2 passes is decreased by 230 times, from 390 to 1.8 ��m. It can be observed that 27% of the grain boundaries are high angle grain boundaries (HAGBs) with an average value of the grain boundaries misorientation angle of 14��, as shown in Fig. 3(a).
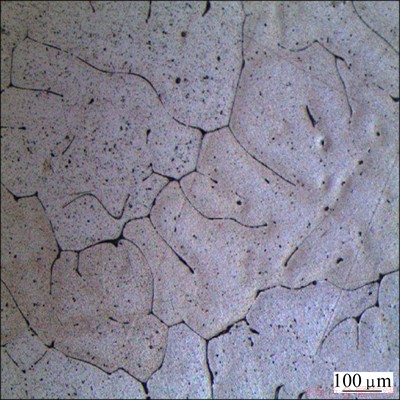
Fig. 1 OM image of deeply etched as-cast Al1080 sample
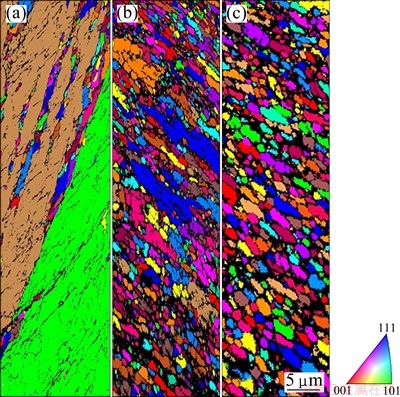
Fig. 2 Color-coded orientation maps of Al1080 sample deformed by ECAP up to 2 (a), 4 (b) and 10 (c) passes
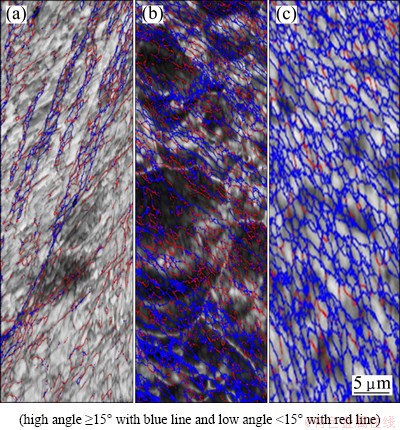
Fig. 3 Color-coded grain boundaries maps of Al1080 sample deformed by ECAP up to 2 (a), 4 (b) and 10 (c) passes
Further grain refinement occurred with the increase of the ECAP number up to 4 as shown in Fig. 2(b). Moreover, the elongated grains partially disappeared and changed into a combination of equiaxed and elongated grains. About 60% of the total area of the microstructure was covered with equiaxed grains. The average grain size of the Al1080 sample after 4 passes was decreased down to 0.4 ��m. The fraction of the high angle grain boundaries was increased from 27% after 2 passes up to 56% after 4 passes as noted in Fig. 3(b). The average value of the grain boundaries misorientation angle after 4 passes was 25��. The fraction of high angle grain boundary noted in the present work was observed to be higher than that obtained during the ECAP of commercially pure Al [6,7,29]. The average grain size of 0.4 ��m after 4 passes in the present work was noted to be smaller than that of 0.56, 0.64 and 9 ��m obtained in the case of commercially pure Al processed by Route Bc [6,7,2].
So, Route A can be considered more effectively than Route Bc in producing smaller grain size and a higher fraction of high angle grain boundaries. This difference can be explained by the concentrated constant strain path imposed during the ECAP by using Route A. The billet is processed with rotation in clockwise or anticlockwise 90�� directions in Route Bc, between each pass. This leads to a continual buildup of shear on two mutually orthogonal planes. So, Route Bc can be considered as less efficient in developing submicron grains relative to the deformation by constant strain path route. The shear strain intensity on each plane is half that with a constant strain path case. Similar observations were also noted in the case of the ECAP of the Al-Mg and Al-Mn alloys using Routes A, Bc, BA, and C [30]. Finally, after 10 passes, the microstructure was transformed into approximately equiaxed grain structure as shown in Fig. 2(c). The fraction of the high angle grain boundaries increased up to 78% as shown in Fig. 3(c). The average grain size after 10 passes decreased down to 0.3 ��m and the average grain boundary misorientation angle increased to 33��. So, the increase in the ECAP number of passes can be used effectively in producing UFG equiaxed microstructure Al1080 samples with high angle grain boundaries.
3.2 Mechanical properties
3.2.1 Effect of ECAP number of passes on microhardness, microhardness distribution, and deformation homogeneity
The microhardness distribution color-coded maps of Al1080 before and after the ECAP with different passes are shown in Fig. 4. The microhardness distribution was almost homogeneous, with varying from HV 26 to HV 29.8 in the as-cast Al1080 sample, as shown in Fig. 4(a). The average microhardness and microhardness inhomogeneity index (indicated by the error bar) values were HV (27.5��0.04) and HV 1.1 respectively in the case of the as-cast sample as shown in Fig. 5.
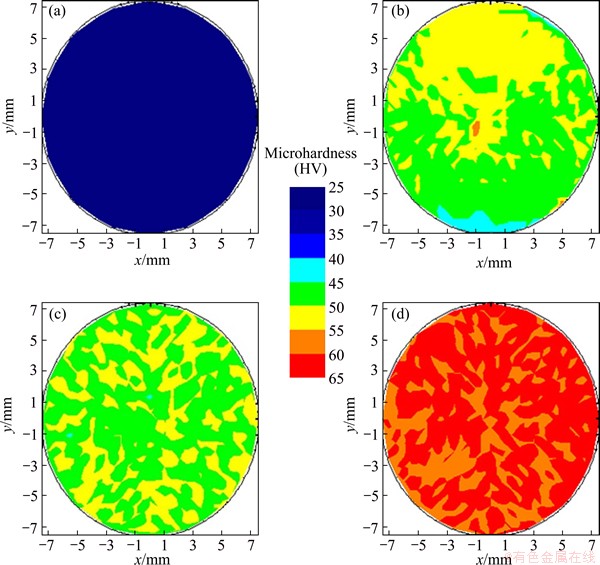
Fig. 4 Color-coded contour map showing microhardness distribution across surface of as-cast (a) and ECAP processed Al1080 samples up to 2 (b), 4 (c) and 10 passes (d)
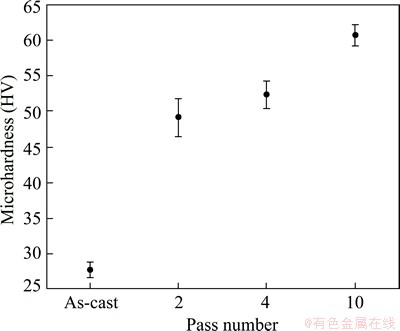
Fig. 5 Average microhardness and standard deviations (error bar) of as-cast, and ECAP processed Al1080 samples up to 2, 4 and 10 passes
The microhardness distribution of samples becomes inhomogeneous across the sample after 2 passes. The difference between the maximum microhardness at the top and the minimum at the bottom of the sample was HV 14, as shown in Fig. 4(b). Moreover, there was low microhardness area at the bottom of the sample, whereas such area was observed in the case of the ECAP of Al1080 and different Al-Cu alloys during the initial passes of ECAP process [3,4]. The low microhardness area observed at the bottom of the sample can be explained by the formation of corner gap as previously observed [3,4]. The formation of the corner gap and its effect on the microhardness distribution were also noted in previous works [31,32]. The microhardness inhomogeneity index after 2 passes was HV 2.7, as shown in Fig. 5. It can be noted that the microhardness inhomogeneity index after 2 passes becomes 150% higher than that in the as-cast Al sample. Moreover, the average microhardness becomes 1.8 times the microhardness of the as-cast sample. After 4 passes, it was observed that the microhardness distribution was more homogenized relative to that after 2 passes. The low microhardness area at the bottom of the sample disappeared as shown in Fig. 4(c). The average microhardness and microhardness inhomogeneity index, after 4 passes were HV (52.5��0.08) and HV 2, respectively as shown in Fig. 5. So, it can be observed that the increase of the ECAP number of passes contributes to increasing the microhardness with obtaining a more homogenized distribution of the microhardness across the sample.
The microhardness distribution after the deformation of Al1080 by ECAP up to 10 passes is shown in Fig. 4(d). After 10 passes, the microhardness distribution becomes more homogeneous across the sample area, showing that the difference between the max and min values is less than HV 6, as shown in Fig. 4(d). The microhardness inhomogeneity index was decreased down to HV 1.6 as shown in Fig. 5. Interestingly, it was noted that the homogeneity after 10 passes was very near to that in the as-cast Al1080 sample. The average microhardness after 10 passes was HV (60.8��0.05) as shown in Fig. 5. The increase of the average microhardness with the increase of the ECAP number of passes can be explained by the decrease of the grain size from 390 ��m in the as-cast Al1080 to 1.8 ��m and then to 0.4 ��m and finally to 0.3 ��m after 2, 4 and 10 passes, respectively, as shown in Figs. 1 and 2 according to the Hall-Petch equation:
 (4)
(4)
where d is the average grain size and H0 and KH are constants [33,34]. Moreover, the improvement of the microhardness distribution homogeneity with the increase of the ECAP number of passes can be explained by the decrease of the corner gap with the increasing number of ECAP passes. Similar observations of the increase of microhardness distribution homogeneity with the increase of the ECAP number of passes due to the decrease in the corner gap size were previously noted through experimental work and finite element simulations of Al1080 samples processed by ECAP [4].
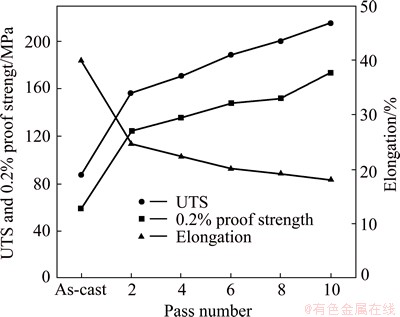
Fig. 6 Effect of ECAP number of passes on ultimate tensile strength (UTS), 0.2% proof strength and elongation
3.2.2 Tensile results
The effect of ECAP number of passes on the tensile properties of Al1080 is shown in Fig. 6. Both of the ultimate tensile strength (UTS) and 0.2% proof strength increased with a decrease in the elongation with the increase of the pass number. The UTS values increased obviously from 87 MPa before the ECAP process up to 156.4 MPa with an increase of 80% after 2 passes. With further deformation through the increase of the ECAP number of passes, the UTS increased with a lower rate with a percentage of increase around 10%. The UTS increased up to 170.3, 188.2, 200.2 and 215.1 MPa after 4, 6, 8 and10 passes, respectively. The same behavior was also observed in the case of 0.2% proof strength. The 0.2% proof strength was increased from 59.2 MPa in the case of the as-cast sample up to 124.2, 135.4, 147.6 and 151.9 and 173.3 MPa after 2, 4, 6, 8 and 10 passes, respectively. The increase of the UTS and 0.2% proof strength can be attributed to the grain refinement as shown in Fig. 2 and the work hardening during the ECAP process. Similar behavior of the increase of the UTS and 0.2% proof strength with the increase of the number of passes was observed in the case of 99.99% Al, Al1100 and Al1060 deformed by ECAP up to different number of passes [35-38]. Interestingly, it was noted that the values of the 0.2% proof strength were in a relatively good agreement with the microhardness values through the following relation of HV��3��0.2.
The elongation decreased from 40% before the ECAP to 24.6%, 22.3%, 20.1%, 19.2% and 18% after 2, 4, 6, 8 and 10 passes, respectively as shown in Fig. 6. The elongation decreased drastically by 38.3% after 2 passes. Then, it decreased with a lower rate in the range of 10%-5% with the increase of the number of passes. Similar behavior of the elongation variation with the increase of the ECAP number of passes was observed in the case of Al1080, Al1100 and Al1060 [3,36-38]. The drastic decrease of the elongation in the initial pass can be explained by the obvious decrease in the grain size from 390 to 1.8 ��m as shown in Figs. 1 and 2(a), respectively. This observation is in agreement with the increase of the microhardness, UTS and 0.2% proof strength as shown in Figs. 5 and 6. The lower rate of the elongation decrease with the increase of the ECAP number of passes over 2 passes can be explained as follows. Firstly, the decrease of the grain size in a lower rate than that in the initial passes, the grain size decreased from 1.8 to 0.4 and finally to 0.3 ��m as shown in Fig. 2. Secondly, the increase of the percentage of the high angle grain boundary and the average grain boundary misorientation angles increase with the increase of the ECAP number of passes as shown in Fig. 3.
3.3 Effect of ECAP number of passes on corrosion and electrochemical behavior
3.3.1 Immersion tests
The corrosion rate of Al1080 before and after ECAP was studied by mass loss method in 3.5% NaCl aqueous solution. Figure 7 shows that the corrosion rate decreases with the increase of the ECAP number of passes. This can be attributed to the decrease in the average grain size with the increase of the ECAP number of passes as shown in Fig. 2. It was observed that the corrosion rate decreased from 4.2 m/a in the as-cast Al1080 down to 2.27, then to 0.96, 0.51 and 0.37 m/a with the decrease of 46%, 58%, 47% and 33% after 2, 4, 8 and 10 passes, respectively. The corrosion rate obviously decreased after 2 passes then it continued to decrease at the same rate with the increase of the pass number up to 8. Then, corrosion rate decreased at a lower rate with the increase of the pass number up to 10. This is in agreement with the behavior of the grain size decrease as shown in Fig. 2. The decrease in the grain size and the subsequent dispersion of impurities were responsible for the observed improvement in the corrosion resistance [13].
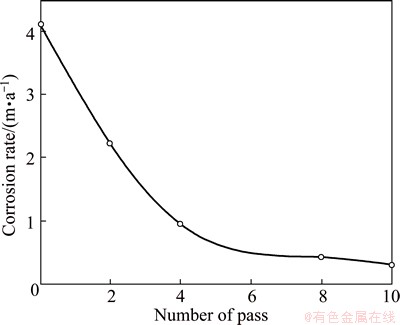
Fig. 7 Effect of ECAP number of pass on corrosion rate of Al1080 sample in 3.5% NaCl solution using mass loss method
3.3.2 Open circuit potential measurements
The characteristic of the passive film on the surface of Al1080 was studied using the open circuit potential (OCP) with time in 3.5% NaCl solution. The OCP with the time variation of the as-cast and ECAP processed Al1080 samples is shown in Fig. 8. It can be noted that all of the Al1080 samples deformed by ECAP had nobler free corrosion potential than the as-cast Al1080 sample. This means that increasing ECAP number of passes improves the oxide film on the surface and consequently the electrochemical reaction decreases. Additionally, Fig. 8 indicates that all OCP curves are accompanied by potential fluctuation. This behavior reflects dissolution and repassivation events, which are related to the activity of different impurities that are present in different proportions and area fractions for the different bulk orientations [39].
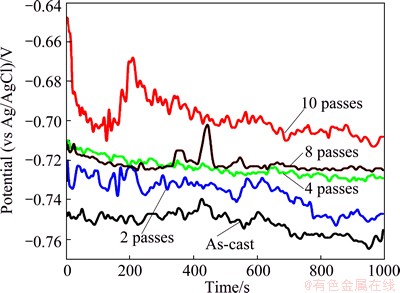
Fig. 8 Potential�Ctime curves of as-cast and ECAP processed Al1080 samples in 3.5% NaCl solution
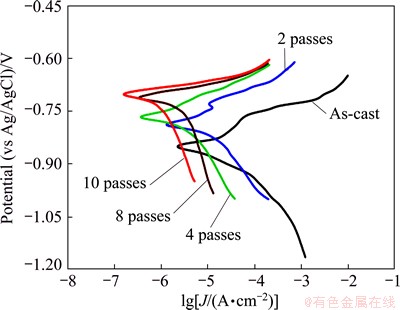
Fig. 9 Tafel polarization curves of as-cast and ECAP processed Al1080 samples in 3.5% NaCl solution
3.3.3 Tafel polarization
Tafel polarization curves of the as-cast and ECAP processed samples are shown in Fig. 9. All samples were immersed in 3.5% NaCl solution for about 15 min before polarization tests to achieve their stable OCP values. It can be observed from the polarization curves that the cathodic polarization curves showed a regular pattern. Moreover, the cathodic current densities decreased with the increase of the ECAP number of passes. The cathodic reaction is oxygen reduction below -1400 mV according to [40]
2O2+H2O+2e=2OH- (5)
On the other hand, the anodic polarization curves showed that, the corrosion potential (��corr) shifted to nobler potential and the corrosion rate decreased from 3.82 in the as�Ccast sample to 0.22 m/a after 10 passes. The partial anodic reaction occurring at anodic sites is
Al=Al3+3e (6)
In the UFG materials, the high fractions of grain boundaries in the microstructure reduce the corrosion rates by accelerating the passivation process and reducing the intensity of galvanic couple between grain interior and grain boundary [16]. Therefore, increasing the ECAP number of passes will lead to the formation of closely spaced electrochemical batteries of anodic�C cathodic regions. These results are in agreement with the microstructures evolution results as shown in Figs. 2 and 3. It can be observed that further grain refinement due to the increase of the ECAP number of passes contributes to decrease of the grain size and so increase of the grain boundaries and percentage of high angle grain boundaries. Thus, difference between the rates of anodic and cathodic reactions are expected to alter significantly, which leads to more uniform attack and lower corrosion rates.
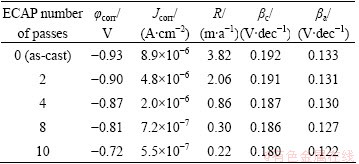
The electrochemical parameters including corrosion potential, corrosion current density (Jcorr), corrosion rate, anodic and cathodic slopes (��a and ��c) are summarized in Table 2. It can be noted that the anodic and cathodic Tafel slopes changed with increasing ECAP number of passes. This means that ECAP number of passes has an obvious effect on anodic and cathodic reactions [41,42]. It is interestingly noted that the corrosion rate obtained from the mass loss method is in good agreement with the results obtained from Tafel techniques as shown in Fig. 7 and Table 2.
Table 2 Corrosion parameters obtained from potentiodynamic polarization measurements of as-cast and ECAP processed Al1080 samples in 3.5% NaCl solution
The corrosion rate as a function of grain size for Al1080 sample using mass loss method and Tafel polarization technique is plotted in Fig. 10. The grain size dependence on the corrosion rate of the Al1080 sample before and after the ECAP process can be represented by
 (7)
(7)
where d is the average grain size and A and B are constants related to material and the electrolyte concentration. It can be observed that for the different corrosion methods, the corrosion rate obviously depends on the grain size with relatively close results.
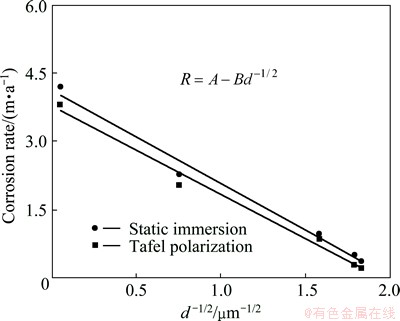
Fig. 10 Dependence of corrosion rate on grain size for Al1080 sample using static immersion and Tafel polarization techniques in 3.5% NaCl solution
3.3.4 Cyclic polarization
In order to assess the effect of ECAP number of passes on passive stability and pitting of Al1080 in 3.5% NaCl solution, the cyclic potentiodynamic polarization technique was used. Two pitting parameters are determined from cyclic polarization curve: pitting potential (��pit) and protection potential (��prot). ��pit denotes the potential at which pits initiate on the forward scan and the current increases abruptly. ��prot is the potential at which the pits are repassivated during the reverse scan, and the current decreases and reaches the passive current density. The cyclic polarization curves of the as-cast and ECAP processed Al1080 samples are shown in Fig. 11. It is obvious from Fig. 11 that the obtained plots had the familiar form for Al and its alloys showing a well-defined corrosion potential, ��corr, followed by a passive region. The passive region results due to the formation of a protective barrier oxide film which is related to the structure of the passive film. The passive region is limited at the breakdown potential (��b) by pitting as a result of the aggressive attack of Cl- anions. On the other hand, Fig. 11 indicates that the protection potential is higher than the ��corr and a small area of the hysteresis loop suggests the decrease of pitting during the reverse scan. Furthermore, Fig. 11 shows that the extent of passivity region increases with increasing the ECAP number of passes. The parameters associated to cyclic polarization curves of as-cast and ECAP processed Al1080 samples in 3.5% NaCl solution are summarized in Table 3.
It can be noted from Table 3 that the passive current densities decrease after the deformation by ECAP. This can be attributed to more compact passive film.
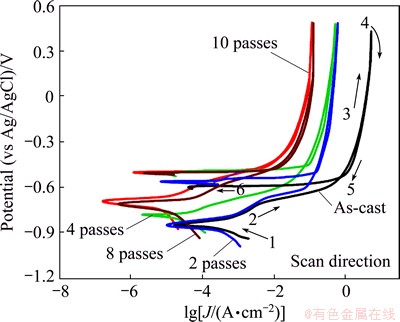
Fig. 11 Cyclic polarization curves of as-cast and ECAP process Al1080 samples in 3.5% NaCl solution
Furthermore, Table 3 shows that the pitting corrosion resistance of Al1080 sample is improved after the deformation by ECAP. This may be attributed to a decrease in the size of impurity precipitates, which act as cathodes during pitting corrosion.
SEM images of the surface morphologies of as-cast and deformed by ECAP Al1080 samples after cyclic polarization tests in 3.5% NaCl solution are shown in Fig. 12. It is obvious from Fig. 12(a) that high corrosion attacks with large pits (as indicated by the red arrows) were noted in the case of the as-cast Al1080 sample. The pits sizes in the as-cast Al1080 were in a range of 30.1-3.8 ��m and an average size of 9.9 ��m. This behavior provides weak protection for the as-cast sample against further corrosion. The ECAP-processed samples have relatively smaller corrosion pit size than that of the as-cast sample (as indicated by the red arrows) as shown in Figs. 12(b-e). The pit size decreased with the increase of the ECAP number of passes. The pit size range decreased from 13.8 to 1.73 ��m with an average size of 4.6 ��m after 2 passes down to 9.8-1.0 ��m with an average size of 2.9 ��m after 10 passes as shown in Figs. 12 (b) and (e), respectively. Similar observations were noted in the case of pure Al and Al1050 processed by ECAP [43,44]. SONG et al [44] found that the size and number of the pits after potentiostatic polarization for 1 h decreased in UFG pure Al1050 relative to those in the case of coarse grain (CG) sample. After immersion in 3.5% NaCl solution for 3 d, the passive film of UFG pure Al1050 sample also keeps denser and more integral than that in the case of CG one [44].
Table 3 Electrochemical parameters obtained from cyclic polarization measurements of as-cast and ECAP processed Al1080 samples in 3.5% NaCl solution
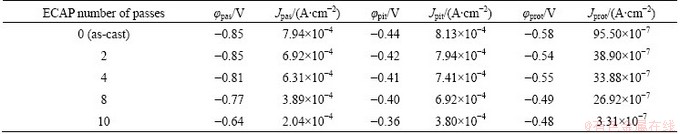
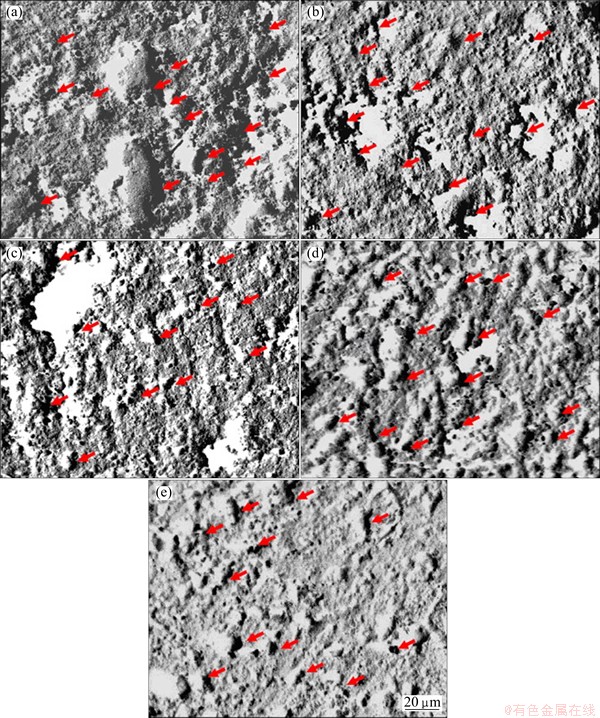
Fig. 12 SEM images of as-cast (a) and ECAP processed Al1080 samples up to 2 (b), 4 (c), 8 (d) and 10 (e) passes after cyclic polarization tests in 3.5% NaCl solution
It is considered that the relatively uniform microstructure with fine ��-Al crystals is able to postpone the growth of pits [43]. This is in agreement with the results of the microstructure in the present work which indicates the evolution of the microstructure into UFG equiaxed structure with the increase of the number of passes as shown in Fig. 2. Generally, it is clear that the corrosion resistance of the ECAP processed samples is higher than that of the as-cast sample. Further improvement in the corrosion resistance was obtained with the increase of the ECAP number of passes.
3.3.5 Potentiostatic current�Ctime measurements
Potentiostatic measurements were performed to gain more information regarding the kinetics of passivity of as-cast and ECAP processed samples at -500 and +500 mV (vs Ag/AgCl) in 3.5% NaCl solution. The two values have been chosen from the cyclic polarization curves to be in the anodic regions. The current density change with time in the passive zone at -500 mV (vs Ag/AgCl) is shown in Fig. 13. It can be seen that the overall process is divided into two stages. In the first stage, the current density increases due to the dissolution of the flawed parts of the oxide film that was formed on the as-cast and ECAP processed samples in chloride solution before stepping the potential to -500 mV (vs Ag/AgCl). The second stage represents the formation and stabilizing of the passive film on the anode surface. Furthermore, Fig. 13 indicates that the passive current density decreases with the increase of ECAP number of passes. This behavior is due to improvement in the passive oxide film obtained with equiaxed grain structure.
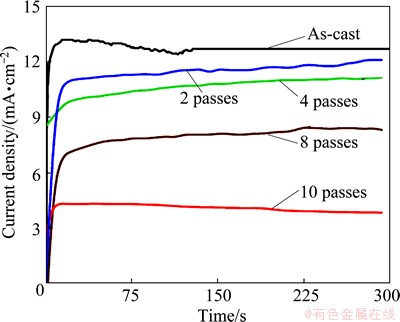
Fig. 13 Potentiostatic current�Ctime curves for as-cast and ECAP processed Al1080 samples at -500 mV in 3.5% NaCl solution
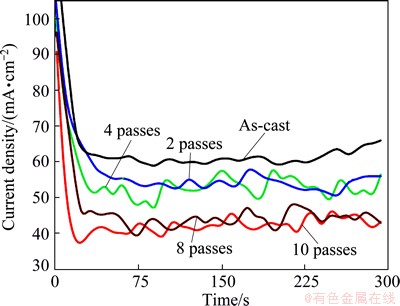
Fig. 14 Potentiostatic current�Ctime curves for as-cast and ECAP processed Al1080 samples at 500 mV in 3.5% NaCl solution
On the other hand, Fig. 14 shows the current density change with time at +500 mV (vs Ag/AgCl). The electrochemical behavior of the investigated alloys can be also categorized into two stages. In the first stage, the current density rapidly decreases in few seconds and this behavior represents the formation and thickening of Al2O3 on the anode surface. In the second stage, the current density fluctuates until the end of the time of experiments. This stage represents the initiation of small pits and its blocking by the accumulation of corrosion products. Also, Fig.14 shows that the time of passivity decreases with increasing the ECAP number of passes.
4 Conclusions
1) ECAP process was used successfully in producing ultra-fine grain Al1080 samples with high angle grain boundaries.
2) The increase of the ECAP number of passes up to 10 passes is effective in allowing a further decrease in the grain size (down to 0.3 ��m) and an increase in the ratio of the high angle grain boundaries (up to 78%).
3) The increase of the ECAP number of passes up to 10 passes increases microhardness (by 120.4%), deformation homogeneity, UTS (by 147.3%), 0.2% proof strength (by 192.7%), corrosion resistance (by 50% in the immersion tests and 94% in the Tafel polarization) and pitting resistance while the elongation decreases by 55%.
4) The corrosion potential of Al1080 shifts to more noble potential with increasing the ECAP number of passes.
5) The time and current density of the passive film decrease with increasing the ECAP number of passes.
References
[1] VALIEV R Z, LANGDON T G. Principles of equal-channel angular pressing as a processing tool for grain refinement [J]. Progress in Materials Science, 2006, 51: 881-981.
[2] IWAHASHI Y, WANG J, HORITA Z, NEMOTO M, LANGDON T G. Principle of equal-channel angular pressing for the processing of ultra-fine grained materials [J]. Scripta Materialia, 1996, 35: 143-146.
[3] EL MAHALLAWY N, SHEHATA F A, EL HAMEED M A, EL AAL M I. Effect of Cu content and number of passes on evolution of microstructure and mechanical properties of ECAPed Al/Cu alloys [J]. Materials Science and Engineering A, 2009, 517: 46-50.
[4] EL MAHALLAWY N, SHEHATA F A, EL HAMEED M A, ABD EL AAL M I, KIM H S. 3D FEM simulations for the homogeneity of plastic deformation in Al-Cu alloys during ECAP [J]. Materials Science and Engineering A, 2010, 527: 1404-1410.
[5] EL-DANAF E A, SOLIMAN M S, ALMAJID A A, EL-RAYES M M. Enhancement of mechanical properties and grain size refinement of commercial purity aluminum 1050 processed by ECAP [J]. Materials Science and Engineering A, 2007, 458: 226-234.
[6] REIHANIAN M, EBRAHIMI R, TSUJI N, MOSHKSAR M M. Analysis of the mechanical properties and deformation behavior of nanostructured commercially pure Al processed by equal channel angular pressing (ECAP) [J]. Materials Science and Engineering A, 2008, 473: 189-194.
[7] EL-DANAF E A. Mechanical properties and microstructure evolution of 1050 aluminum severely deformed by ECAP to 16 passes [J]. Materials Science and Engineering A, 2008, 487: 189-200.
[8] GRILLI R, BAKER M A, CASTLE J E, DUNN B, WATTS J F. Localized corrosion of a 2219 aluminium alloy exposed to a 3.5% NaCl solution [J]. Corrosion Science, 2010, 52: 2855-2866.
[9] CANDAN S. An investigation on corrosion behaviour of pressure infiltrated Al-Mg alloy/SiC composites [J]. Corrosion Science, 2009, 44: 303-318.
[10] MA J, WEN J, LI Q, ZHANG Q. Electrochemical polarization and corrosion behavior of Al-Zn-In based alloy in acidity and alkalinity solutions [J]. International Journal of Hydrogen Energy, 2013, 38: 14896-14902.
[11] EZUBER H, EL-HOUD A, EL-SHAWESH F A. study on the corrosion behavior of aluminum alloys in seawater [J]. Materials & Design, 2008, 29: 801-805.
[12] LEKATOU A, SFIKAS A K, KARANTZALIS A E, SIOULAS D. Microstructure and corrosion performance of Al-32%Co alloys [J]. Corrosion Science, 2012, 63: 193-209.
[13] BALYANOV A, KUTNYAKOVA J, AMIRKHANOVA N A, STOLYAROV V V, VALIEV R Z, LIAO X Z, ZHAO Y H, JIANG Y B, XU H F, LOWE T C, ZHU Y T. Corrosion resistance of ultra fine-grained Ti [J]. Scripta Materialia, 2004, 51: 225-229.
[14] AFSHARI V, DEHGHANIAN C. Effects of grain size on the electrochemical corrosion behaviour of electrodeposited nanocrystalline Fe coatings in alkaline solution [J]. Corrosion Science, 2009, 51: 1844-1849.
[15] ZHENG Z J, GAO Y, GUI Y, ZHU M. Corrosion behaviour of nanocrystalline 304 stainless steel prepared by equal channel angular pressing [J]. Corrosion Science, 2012, 54: 60-67.
[16] ARGADE G R, KUMAR N, MISHRA R S. Stress corrosion cracking susceptibility of ultrafine grained Al-Mg-Sc alloy [J]. Materials Science and Engineering A, 2013, 565: 80-89.
[17] GU X N, LI N, ZHENG Y F, KANG F, WANG J T, RUAN L. In vitro study on equal channel angular pressing AZ31 magnesium alloy with and without back pressure [J]. Materials Science and Engineering B, 2011, 176: 1802-1806.
[18] SON I, NAKANO H, OUE S, KOBAYASHI S, FUKUSHIMA H, HORITA Z. Pitting corrosion resistance of anodized aluminum alloy processed by severe plastic deformation [J]. Materials Transactions, 2007, 48: 21-28.
[19] SONG D, MA A, JIANG J, LIN P, YANG D, FAN J. Corrosion behavior of equal-channel-angular-pressed pure magnesium in NaCl aqueous solution [J]. Corrosion Science, 2010, 52: 481-490.
[20] ARGADE G R, PANIGRAHI S K, MISHRA R S. Effects of grain size on the corrosion resistance of wrought magnesium alloys containing neodymium [J]. Corrosion Science, 2012, 58: 145-151.
[21] ABD EL AAL M I. Influence of the pre-homogenization treatment on the microstructure evolution and the mechanical properties of Al-Cu alloys processed by ECAP [J]. Materials Science and Engineering A, 2011, 528: 6946-6957.
[22] FIELD D P. Recent advances in the application of orientation imaging [J]. Ultramicroscopy, 1997, 67: 1-9.
[23] SCHWARTZ A J,KUMAR M,ADAMS B L,FIELD D. Electron backscatter diffraction in materials science [M]. Second Edition. New York: Springer, 2009.
[24] HUMPREYS F J. Grain and subgrain characterisation by electron backscatter diffraction [J]. Journal of Materials Science, 2001, 36: 3833-3854.
[25] ABD EL AAL M I, YOON E Y, KIM H S. Microstructure evolution and mechanical properties of Al-1080 processed by a combination of equal channel angular pressing and high pressure torsion [J]. Metallurgical and Materials Transactions A, 2013, 44: 2581-2590.
[26] ASTM-G1 standard practice for preparing, cleaning, and evaluating corrosion test specimens [S].
[27] ASTM-G31 standard practice for preparing, cleaning, and evaluating corrosion test specimens [S].
[28] IWAHASHI Y, HORITA Z, NEMOTO M, LANGDON T G. The process of grain refinement in equal-channel angular pressing [J]. Acta Materialia, 1998, 46: 3317-3331.
[29] CHANG J Y, YOON J S, KIM G H. Development of submicron sized grain during cyclic equal channel angular pressing [J]. Scripta Materialia, 2001, 453: 347-354.
[30] GHOLINIA A, PRANGNELL P B, MARKUSHEV M V. The effect of strain path on the development of deformation structures in severely deformed aluminium alloys processed by ECAE [J]. Acta Materialia, 2000, 48: 1115-1130.
[31] XU C, FURUKAWA M, HORITA Z, LANGDON T G. The evolution of homogeneity and grain refinement during equal-channel angular pressing: A model for grain refinement in ECAP [J]. Materials Science and Engineering A, 2005, 398: 66-76.
[32] LEO P, CERRI E, de MARCO P P, ROVEN H J. Properties and deformation behaviour of severe plastic deformed aluminium alloys [J]. Journal of Materials Processing Technology, 2007, 182: 207-214.
[33] HALL E O. The deformation and ageing of mild steel: III Discussion of results [J]. Proceedings of the Physical Society B, 1951, 64: 747-753.
[34] PETCH N J. The cleavage strength of polycrystals [J]. Journal of the Iron and Steel Institute, 1953, 174: 25-28.
[35] NAKASHIMA K, HORITA Z, NEMOTO M, LANGDON T G. Influence of channel angle on the development of ultrafine grains in equal-channel angular pressing [J]. Acta Materialia, 1998, 48: 1589-1599.
[36] HORITA Z, FUJINAMI T, NEMOTO M, LANGDON T G. Improvement of mechanical properties for Al alloys using equal-channel angular pressing [J]. Journal of Materials Processing Technology, 2001, 117: 288-292.
[37] WANG J W, DUAN Q Q, HUANG C X, WU S D, ZHANG Z F. Tensile and compressive deformation behaviors of commercially pure Al processed by equal-channel angular pressing with different dies [J]. Materials Science and Engineering A, 2008, 496: 409-416.
[38] SIVARAMAN A, CHAKKINGAL U. Investigations on workability of commercial purity aluminum processed by equal channel angular pressing [J]. Journal of Materials Processing Technology, 2008, 202: 543-548.
[39] BRUNNER J G, BIRBILIS N, RALSTON K D, VIRTANEN S. Impact of ultrafine-grained microstructure on the corrosion of aluminium alloy AA2024 [J]. Corrosion Science, 2012, 57: 209-214.
[40] SHERIFE M, PARK S M. Effects of 1,4-naphthoquinone on aluminum corrosion in 0.50 M sodium chloride solutions [J]. Electrochimica Acta, 2006, 51: 1313-1321.
[41] MAHDY A, SADAWY M M. Effect of grain refiner Al-5Ti-1B on the corrosion and electrochemical behavior of Al6061 in 3.5wt.% NaCl solution [J]. Metall-Berlin, 2013,67: 397-401.
[42] ZOHDY K M, SADAWY M M, GHANEM M. Corrosion behavior of leaded-bronze alloys in sea water [J]. Materials Chemistry and Physics, 2014, 147: 878-883.
[43] ZHANG Z, AKIYAMA E, WATANABE Y, KATADA Y, TSUZAKI K. Effect of ��-Al /Al3Ni microstructure on the corrosion behaviour of Al-5.4wt% Ni alloy fabricated by equal-channel angular pressing [J]. Corrosion Science, 2007, 49: 2962-2972.
[44] SONG Dan, MA Ai-bin, JIANG Jing-hua, LIN Pin-hua, YANG Dong-hui. Corrosion behavior of ultra-fine grained industrial pure Al fabricated by ECAP [J]. Transactions of Nonferrous Metals Society of China, 2009, 19(5): 1065-1070.
�Ⱦ��Ǽ�ѹ����ϸ�������Դ�������֯�ݱ䡢��ѧ���ܺ�ʴ��Ϊ��Ӱ��
Mohamed Ibrahim ABD EL AAL1, M. M. SADAWY2
1. Mechanical Design and Production Department, Faculty of Engineering, Zagazig University, Zagazig 44519, Egypt;
2. Mining and Petroleum Engineering Department, Al-Azhar University, Nasr City; Cairo 11651, Egypt
ժ Ҫ���������£����õȾ��Ǽ�ѹ���ӹ�������Ʒ10���Ρ��о��Ⱦ��Ǽ�ѹ�������Լӹ���Ʒ����֯�ݱ䡢��ѧ���ܡ����ξ����Ժ�ʴ��Ϊ��Ӱ�졣��ʩ�ӵ�Ӧ�䵼�¾����ߴ����Լ�С���Ⱦ��Ǽ�ѹǰ�������ߴ�Ϊ390 ��m�����Ⱦ��Ǽ�ѹ2��4��10���κ����ߴ�ֱ��С��1.8��0.4��0.3 ��m�����ŵȾ��Ǽ�ѹ�����������ӣ���Ӳ�ȡ����ξ����Ժ�����ǿ�������쳤���½����������顢��·���ơ�Tafel������ѭ�������ͺ��λ���Ա���������̬��Ʒ��ȣ���3.5% NaCl��Һ�У����Ⱦ��Ǽ�ѹ��Ʒ����ʴ��������ߡ����Ӽ�ѹ�������ܳɹ������������иߴ�λ�ǡ�����ѧ���ܺ���ʴ�Եij�ϸ����鴿����
�ؼ��ʣ��Ⱦ��Ǽ�ѹ������֯����ѧ���ܣ���ʴ�ԣ��ۻ�Ĥ����ʴ
(Edited by Xiang-qun LI)
Corresponding author: Mohamed Ibrahim ABD EL AAL; E-mall: eng_mohabdelall@yahoo.com
DOI: 10.1016/S1003-6326(15)64034-1
Abstract: Pure aluminum samples were processed by equal channel angular pressing (ECAP) up to 10 passes at room temperature. The effects of the ECAP number of passes on the microstructure evolution, the mechanical properties, deformation homogeneity and corrosion behavior of the processed samples were fully investigated. The imposed strain resulted in an obvious reduction in the grain size from 390 ��m before ECAP down to 1.8, 0.4, and 0.3 ��m after ECAP up to 2, 4 and 10 passes, respectively. The microhardness, deformation homogeneity and tensile strength were increased while the elongation decreased with the increase of ECAP number of passes. Immersion tests, open circuit potential, Tafel polarization, cyclic polarization and potentiostatic measurements in 3.5% NaCl solution revealed an obvious improvement in the corrosion resistance of ECAP processed samples compared with the as-cast sample. The increase of the number of passes can be used successfully in producing ultra-fine grained (UFG) bulk pure aluminum sample with a high misorientation angle, reasonably high mechanical properties and corrosion resistance.
