
J. Cent. South Univ. (2012) 19: 2086-2093
DOI: 10.1007/s11771-012-1249-1![]()
Effect of indium addition on corrosion of AP65 magnesium alloy
JIN He-xi(���ϲ), WANG Ri-chu(���ճ�), PENG Chao-qun(����Ⱥ), SHI Kai(ʯ��), FENG Yan(����)
School of Materials Science and Engineering, Central South University, Changsha 410083, China
? Central South University Press and Springer-Verlag Berlin Heidelberg 2012
Abstract:
The effect of indium addition on the corrosion behavior of AP65 Mg alloy was examined. The indium modified AP65 exhibits accelerated pitting corrosion and overall corrosion, but there is almost no incubation period at the onset of corrosion. Polarization curve measurements indicate that the indium modified AP65 has more negative corrosion potential, which is an improvement aspect of the electrochemical activation. The corrosion current density increases from 0.126 to 0.868 mA/cm2 with and without 2.0% (mass fraction) indium addition. The mean potentials of AP65 negatively shift from -1.491 V to -1.584 V by adding 2.0% indium. The effect of indium addition on the corrosion performance of AP65 seems to be associated with the decrease of cathode-to-anode area ratio of the alloy, which may change the electrochemical anode and cathode polarization behavior of the alloy.
Key words:
magnesium alloy; corrosion; electrochemical properties; indium��
1 Introduction
Mg alloys have many advantages such as low density, high specific strength, excellent cast ability and electromagnetic shielding performance. It is called as green engineering material and widely used in aerospace and spaceflight, vehicle, and electric products. Another traditional application of magnesium alloy is sacrificial anode for catholic protection (CP) of important structures. Recently, the application of magnesium alloys as anode materials in high energy density batteries has attracted much attention. A significant limitation, however, is their corrosion performance [1-5]. Their corrosion performance has been reported [6-8] over the past decades to facilitate their use as anode materials. There have been several studies on the corrosion behavior of AM series alloys [5, 9] and AZ series alloys [10-11]. FENG et al [6] reported that Mg-Hg-Ga magnesium alloys could be used as anodes to produce high cell voltage.
AP65 is one of the most potential alloys used in under-water device and torpedo, with a nominal composition of Mg-6%Al-5%Pb (mass fraction). The AP65 alloy possesses a number of characteristics which make it attractive as an anode material: highly negative standard potential (-1.8 V versus SHE), relatively low equivalent weight, high current utilization efficiency (83%) [7], low cost, infinite storage capability, high safety and low toxicity which allows for urban waste disposal. It is becoming more and more urgent for people to comprehend the corrosion behavior of the AP65 alloy deeply and comprehensively. However, there have only been several studies on its corrosion behavior [12-13]. It has been reported [14] that 1%-3% indium significantly favors the reactivity of aluminum in natural sea water, which gives anode a better yield in the anodic property of immersed marine installations.
The corrosion behavior of the AP65 alloy considerably depends on its microstructure (the amount and presence of �� phase) [12]. There is little information available about the effect of alloying elements on the corrosion behavior of the AP65 alloy and a considerable amount of ambiguity still exists. More importantly, the effect of indium addition on corrosion of AP65 is not understood properly. Furthermore, wasteful self- corrosion and negative difference effect (NDE) result in severe capacity loss, low anodic efficiency, low electrochemical activation and these disadvantages have delayed the commercial exploitation of AP65. One way to enhance the AP65 performance is to optimize the alloy composition. This work was conducted to study the effect of indium addition on the corrosion behavior of AP65 alloy.
2 Experimental
The alloys used in this work were prepared by fusion metallurgy at 750 ��C and alloying elements Al, Pb and In were added at about 730 ��C. The melt was stirred for about 5 min and held for 10 min to guarantee a homogenous composition of the melt. The melt was cast using steel mold and the melt temperature was controlled at 710-750 ��C. For optical microscope observation and corrosion and electrochemical tests, the cast alloys were cut into cube-like coupons, with 10 mm in length, 10 mm in width and 10 mm in thickness. A 3.5% NaCl (mass fraction) solution was used in this work for corrosion and electrochemical tests. The solution was prepared using chemical grade sodium chloride and distilled water. The following tests were all performed at 22-25 ��C. The compositions of these two kinds of cast alloys are listed in Table 1. For simplicity, the indium containing alloy is denoted as API2.0 in this work, which will be compared with the AP65 alloy in the following tests. Measurements were performed twice to ensure the reproducibility of the results.
A typical metallographic practice was used to reveal the microstructure in metallographic examination (first polishing and then etching). The cross-sections of the specimens were used to check the corrosion penetration. In this case, the cross-sections of the specimens were prepared in the same way as the metallographic ones. The microstructure of the as-cast specimens was examined. The phases were analyzed by X-ray diffraction (XRD) using the Cu K�� radiation. The specimens used in the following tests were all in as-cast condition. The self-corrosion rate was estimated by the hydrogen evolution and mass loss methods after immersion in the neutral 3.5% NaCl solution for 72 h. The cube-like coupons were cleaned with alcohol and dried, and then immersed in 1 800 mL of 3.5% NaCl solution in beakers. Detailed description of the set-up has been given in other publications [5, 15]. The final corrosion morphology of the coupon was examined by SEM. Some specimens after immersion in 3.5% NaCl solution were then immersed in a chromic acid solution (200 g CrO3 + 10 g AgNO3) to remove the corrosion products stuck on their surfaces and AgNO3 played a role of preventing further corrosion of the Mg matrix herein. The samples were then weighed to determine their mass losses caused by corrosion.
Electrochemical polarization experiments were carried out with a Potentiostat-Galvanostat (Model 263A). Each specimen was encapsulated in epoxy resin with an exposed surface of 10 mm �� 10 mm. The specimen surface was ground successively to 1200 grit SiC paper, followed by washing with distilled water and alcohol. A polarization test was carried out in a corrosion cell containing 200 mL 3.5% NaCl using a standard three-electrode configuration, with KCl-saturated Ag/AgCl electrode as the reference electrode, platinum gauze as the counter electrode, and the specimens served as the working electrode. After a steady state potential being developed, a polarization scan was carried out towards more noble values at a rate of 2 mV/s.
3 Results and discussion
3.1 Microstructure characterization
Figure 1 shows the XRD patterns of AP65 and API2.0 alloys, indicating that both AP65 and API2.0 alloys mainly consist of the ��-Mg matrix and ��-Mg17Al12 phases. All the peaks in the XRD patterns correspond to either Mg or Mg17Al12. This indicates that AP65 has a matrix of ��-Mg grains with the second ��-phase consisting of the inter-metallic Mg17Al12. Optical micrograph images of API2.0 alloy are illustrated in Fig. 2. The microstructure of the API2.0 consists of the primary ��-Mg matrix, ��-Mg17Al12 and (��+��) micro- constituent phases (�� and (��+��) phases distributing along the ��-Mg grain boundaries), which is consistent with the previous report [6]. For the AP65 magnesium alloy, aluminum and lead are two main additional elements. The aluminum is partly in solid solution, and partly precipitated along the ��-Mg grain boundaries in the form of ��-Mg17Al12 as well as part of lamellar structure. Aluminum is the dominating element controlling the activation process of magnesium, and the lead oxides on the surface of the alloy facilitate the activation process [12]. It can be seen from Fig. 2 that the phases appearing in the API2.0 alloy are different from those in AP65 alloy. The amount of �� phase in the API2.0 alloy is much less than that in the AP65 alloy.
Table 1 Main chemical compositions of AP65 and API2.0 alloys (mass fraction, %)


Fig. 1 XRD patterns of AP65 (a) and API2.0 (b) alloys

Fig. 2 Optical microstructure images of AP65 (a) and API2.0 (b) alloys
The �� phase in the AP65 alloy is dissolved almost in black bulk; while the distribution in API2.0 alloy is quite disperse. Although there are more than two phases in the API2.0 alloy (unmarked peaks in Fig. 1), the research of corrosion behavior is focused on the �� and �� phases. The fraction of other inter-metallic compounds is so small that can be ignored. In Mg-Al alloys, the constituent �� phase has two contrary influences on their corrosion behavior, as a galvanic cathode or as a barrier. SONG [10] and LIU et al [16] reported that only when �� phase was continuously distributed in the small grains around the �� matrix, it could act as a barrier of corrosion. In API2.0, the isolated �� phase is distributed throughout the microstructure and the distance between the isolated �� phases is large, which indicates that the �� phase may act mainly as a galvanic cathode to accelerate the corrosion. It should be addressed that the assumptions made here require experimental verification. If they are correct, it is expected that the hydrogen evolution rate and the mass loss rate of API2.0 will be higher than those of AP65. It has been proved that the corrosion behavior of magnesium alloy depends on the Al content [11]. BSE (backscattered electron) image of specimens and Al distribution across the second phases and �� Mg matrix were analyzed by EDX line scan as shown in Fig. 3. The direction of line scan was marked with the white arrow in Figs. 3(a) and (b). Compared with AP65, it is obvious that the Al distribution in API2.0 alloy is not uniform, which is consistent with the observation of BSE image. Indium addition increases the fraction of the ��-Mg phase (serving as a galvanic anode) and hinders the formation of �� phase (serving as a galvanic cathode), which results in lower cathode-to-anode area ratio of API2.0 than that of AP65. A lower cathode-to-anode area ratio leads to high corrosion rates in galvanic couple corrosion [12]. Thus, the uneven distribution of Al will have a great effect on the corrosion process.
3.2 Corrosion tests
3.2.1 Hydrogen evolution and mass loss
The hydrogen evolution rate of API2.0 is significantly higher than that of AP65 at all immersion time as shown in Fig. 4. Both AP65 and API2.0 alloys exhibit a linear increase in the hydrogen evolution rate with increasing the immersion time and the hydrogen evolution rate of API2.0 increases at a faster rate than that of AP65. The slope of the line is nearly 1.0, which implies that the corrosion rate of API2.0 is constant. However, for the AP65 alloy, the rate of hydrogen evolution is reduced greatly at the initial stage of the immersion, but the rate further increases with the immersion time. Compared with API2.0, the film layer formed on the surface can provide protection for AP65 alloy in 3.5 % NaCl solution to a certain extent.
Based on the overall corrosion reaction Eq. (1),
Mg+2H2O��Mg(OH)2+H2 (1)
the amount of Mg corroded of a magnesium alloy corresponds to the volume of evolved hydrogen. Therefore, the hydrogen evolution method is more reliable in studying the time-dependent corrosion behavior [17]. Figure 5 shows the comparison of hydrogen evolution and mass loss results. The hydrogen evolution rate can be related to the mass loss rate, and the mass loss rate can be related to the corrosion rate, using the conversions as follows [11]:
rm=1.085rh (2)
rc=2.10rm (3)
where rm is the mass loss rate, mg/(cm2.d-1); rh is the hydrogen evolution rate, mg/(cm2.d-1); rc is the corrosion rate, mm/a.
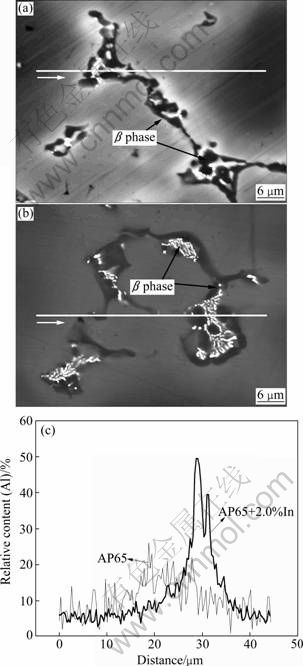
Fig. 3 BSE images of AP65 (a) and API2.0 alloys (b) and chemical composition analysis of Al by line scan of EDX (c)
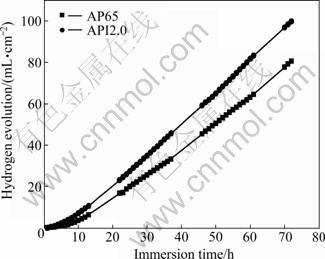
Fig. 4 Hydrogen evolution rates of AP65 (a) and API2.0 (b) alloy coupons immersed in 3.5 % NaCl solution versus time
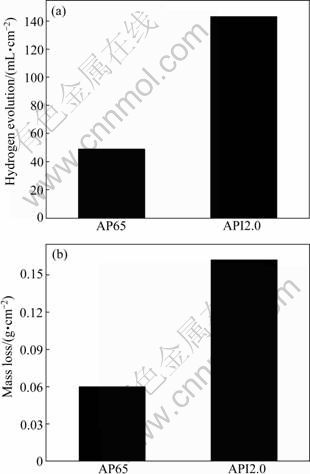
Fig. 5 Comparison of corrosion caused losses of AP65 (a) and API2.0 (b) alloys based on hydrogen evolution and mass loss
The tendency is clear that the corrosion rate of the AP65 alloy increases with the indium addition. Figure 5 shows that hydrogen evolution rate data are consistent with the mass loss rate data and these independent tests follow the expectation from corrosion reaction (1). Since the mass loss provides the final corrosion damage of these two alloys while the hydrogen evolution provides the development of corrosion information, the deviation between the hydrogen evolution and the mass loss measurements is inevitable [10, 18]. Negligible Mg alloy may be etched off during the corrosion product removal process in the chromic acid solution [10]. The overall mass loss of API2.0 is higher than that of AP65 at the same reaction time as listed in Table 2, indicating that the corrosion rate (exactly, average corrosion rate over the exposure period) of API2.0 is larger than that of AP65. This supports the hypothesis that the �� phase acts mainly as a galvanic cathode to accelerate corrosion. This is probably resulted from the larger corrosion area on API2.0 than that on AP65 (Fig. 6). At the same time, the localized corrosion on API2.0 is deeper than the corrosion damage on AP65 (Fig. 7). This may be due to the location where Al content is low and passive film breaking down primarily. AMBAT et al [19] also reported a similar phenomenon in an AZ91 alloy in 5.0% NaCl. It is verified by the polished cross-sections of two samples with typical corrosion damages (Fig. 7).
3.2.2 Electrochemical tests
Figure 8(a) shows the open circuit potentials (OCP) for AP65 and API2.0 alloys immersed in 3.5% NaCl aqueous solution for 72 h. Reaction of two samples starts immediately after immersion in NaCl aqueous solution. For AP65, at the onset of corrosion, there is an incubation period (approximately 100 s). After that, the OCP increases rapidly to the maximum value, indicating that an oxide film forms on the surface of the sample. As to API2.0, however, almost no incubation period can be found at the onset of corrosion. The protection time of oxide film formed on the surface of API2.0 is so short that it can be negligible, which disagrees with the prior report [12]. It is proposed that short incubation period always leads to high corrosion rate [12, 20]. The higher corrosion rate of API2.0 than AP65 results from the shorter incubation period. The subsequent decrease of the OCP indicates the breakdown of the oxide film with the effect of Cl- ions in the electrolyte solution. After the breakdown of the oxide film, the OCP of the two alloys comes into steady state, indicating that a dynamic balance between the advance of the corrosion and the deposit of the corrosion products is established. The OCP of AP65 is more negative than that of API2.0 whereas the corrosion rate of API2.0 alloy is much larger than that of AP65. It should be stressed that the OCP value of Mg-Al-Pb alloys does not represent its corrosion rate, and more negative value of the OCP is not always correlated with the higher corrosion rate.
Table 2 Corrosion and electrochemical parameters of AP65 and API2.0 alloys


Fig. 6 Topographic views of surfaces of AP65 (a) and API2.0 (b) alloys after 1 h immersion in 3.5% NaCl solution

Fig. 7 Cross-sectional morphologies of corroded AP65 (a) and API2.0 (b) alloys after 48 h immersion in 3.5% NaCl solution

Fig. 8 Open circuit potentials (OCP) of AP65 and API2.0 alloys (a) and potential-dynamic polarization curves of AP65 and API2.0 alloys in 3.5% NaCl solution (b)
To further examine the difference in electro- chemistry between these two alloys, the potential- dynamic polarization curves were utilized. Figure 8(b) represents the polarization curves of AP65 and API2.0. It has previously been demonstrated experimentally and theoretically that polarization curves can exhibit a steady electrochemical process over a wide potential range, which is a powerful assistance in understanding the corrosion behavior of a metal material. The corrosion potential of AP65 is more positive than that of API2.0, which shows that the electrochemical activity of AP65 is intensified after indium addition. The corrosion current density of API2.0 estimated from the catholic branch of the polarization curve is much higher than that of AP65. The corrosion rates evaluated by Tafel extrapolation from the polarization curves agree with those evaluated from hydrogen evolution and mass loss. It has been demonstrated [18, 21] that the polarization curves of magnesium alloys do not follow the typical Tafel equation and a misleading result (an error of about ��10%) would happen if the corrosion rate is solely based on it. However, the polarization curves in this work support the traditional polarization theory as the linear regions on the cathode and anodic extrapolation intersect at their corrosion potentials (Fig. 8(b)). A higher anodic polarization curve means that the corrosion dissolution of the metal is more rapid when this metal is in contact with more noble metal, therefore the galvanic performance of the metal is worse. In this work, the polarization curves (Fig. 8(b)) show that the galvanic corrosion dissolution of API2.0 should be more severe than that of AP65. It is in correspondence with the cross-sectional morphologies of the corroded AP65 and API2.0 specimens (Fig. 7). The corrosion potentials, corrosion current densities and mean potentials of Mg-Al-Pb-In alloys calculated by Tafel linear extrapolation are listed in Table 2. The corrosion current densities of AP65 alloy are 0.126 and 0.868 mA/cm2 with and without 2.0% (mass fraction) indium addition, respectively. The mean potentials of AP65 negatively shift from -1.491 V to -1.584 V by adding 2.0% indium. Combined with the hydrogen evolution results, the API2.0 alloy has good anodic properties due to its good electrochemical activity and well self-corrosion resistance. The corrosion rate of AP65 is only half that of API2.0, which is attributed to the lower potential difference of the cathode-to-anode phase and the anode matrix of API2.0. It is reasonable for us to get the conclusion that the electrochemical activity of AP65 is obviously improved after 2.0% indium addition. The polarization of API2.0 alloy anode decreases, the electrode potential shifts negatively and the self-corrosion rate is increased because of the high hydrogen evolution over-potential, and substance coating on the surface of the Mg alloy after indium addition.
3.3 Corrosion morphology
The corrosion morphologies of AP65 and API2.0 alloys are shown in Fig. 6 and Fig. 7 (immersion time is 1 h and 48 h, respectively). Figure 6 shows that the corrosion of AP65 initiates as localized corrosion at some sites on the surface and then expands over the whole surface. It can be seen from Fig. 6 that the AP65 surface exhibits corrosion damage in localized area while nearly the entire surface of API2.0 is corroded. What��s more, the corrosion of AP65 initiates in Mg matrix primarily (Fig. 6), indicating that the second phases have corrosion potentials more positive than ��-phase. Figure 7 presents the cross-sectional morphologies of corroded AP65 and API2.0 specimens after 48 h immersion in 3.5% NaCl solution. The hydrogen evolution preferentially starts at some sites and then the corrosion advances over the surface. In other words, the main corrosion form of API2.0 is pitting corrosion. At the end of 1 h immersion, the whole exposed surface of API2.0 is homogenously covered by a layer of corrosion products (Fig. 6). This indicates that the surface film formed on the surface of the API2.0 does not hinder further corrosion, that is to say, a very short incubation period experiences at the start of corrosion. The uniform corrosion rates result from uneven distributed Al of API2.0 alloy, and the sites where Al content is lower than the surface film break down primarily. This analysis is in good agreement with the results of EDX result in Fig. 3 and the electrochemical discussion of Section 3.2.2. The data in the present work are consistent with these prior measurements [12, 20]. Moreover, the fact that the entire surface of API2.0 alloy is corroded after both 1 h and 72 h exposure periods is in agreement with the linear rate of hydrogen evolution in Fig. 4.
It has been well known that the distribution and morphology of the second phases in magnesium alloy influence the corrosion properties [11]. FENG et al [6] indicate that the activation mechanism of Mg-Hg-Ga alloy is dissolution-deposition of Hg and Ga atoms. There is no evidence that the corrosion behavior of the API2.0 alloy is associated with the dissolution- deposition mechanism. If the ��-phase is present as a small fraction and is unevenly distributed, the ��-phase serves mainly as a galvanic cathode and accelerates the overall corrosion of the ��-matrix. If the ��-phase fraction is high and evenly distributed, the ��-phase may act mainly as a barrier against the corrosion of a matrix. What��s more, the increase of Al reduces the fraction of the ��-phase [3]. In this work, on one hand, indium addition decreases the fraction of ��-Mg in the AP65 alloy (Fig. 2), the ��-phase is partly isolated, and the ��-phase may serve as a galvanic cathode to accelerate the uniform corrosion of the API2.0 alloy. On the other hand, the content of Al in ��-phase is unevenly distributed after indium addition, and high Al sites lead to a lower cathode-to-anode area ratio to accelerate the corrosion of the API2.0 alloy. In this work, the ��-phase can exert two roles in corrosion: 1) as a galvanic cathode; 2) decreased ��-phase leads to a lower cathode-to-anode area ratio to accelerate the corrosion of API2.0 alloy. The corrosion rate of the API2.0 alloy is much faster than that of AP65, and this phenomenon can be attributed to the variations of Al content and double roles of ��-phase mentioned above.
4 Conclusions
1) The corrosion type of the API2.0 alloy is pitting corrosion. The corrosion of AP65 initiates at the Mg matrix primarily, indicating that the second phases have corrosion potentials more positive than those of the ��-phase. There is almost no incubation period at the onset of corrosion.
2) The amount of ��-phase decreases in the AP65 after 2.0% indium addition and leads to a higher potential difference between the cathode-to-anode phase and the anode matrix. The cathode-to-anode area ratio of API2.0 is lower than that of AP65, which can be responsible for the faster corrosion rate of API2.0 than AP65.
3) The corrosion current densities of AP65 are 0.126 and 0.868 mA/cm2 with and without 2.0% indium addition. The mean potentials of AP65 negatively shift from -1.491 V to -1.584 V after 2.0% indium addition.
References
[1] FENG Yan, WANG Ri-chu, PENG Chao-qun, WANG Nai-guang. Influence of Mg21Ga5Hg3 compound on electrochemical properties of Mg-5%Hg-5%Ga alloy [J]. Transactions of Nonferrous Metals Society of China, 2009, 19(1): 154-159.
[2] RENUKA R. Influence of allotropic modifications of sulphur on the cell voltage in Mg-CuI(S) seawater activated battery [J]. Materials Chemistry and Physics, 1999, 59(1): 42-48.
[3] DORON A, GURUKAR S S, ELENA L, ARIEL M, OREN M, ORIT C, MICHELA B. Progress in rechargeable magnesium battery technology [J]. Advanced Materials, 2007, 19: 4260-4267.
[4] RENUKA R. AgCl and Ag2S as additives to CuI in Mg-CuI seawater activated batteries [J]. Journal of Applied Electrochemistry, 1997, 27(12): 1394-1397.
[5] SONG Guang-ling. Effect of tin modification on corrosion of AM70 magnesium alloy [J]. Corrosion Science, 2009, 51(9): 2063-2070.
[6] FENG Yan, WANG Ri-chu, YU Kun, PENG Chao-qun, ZHANG Jia-pei, ZHANG Chun. Activation of Mg-Hg anodes by Ga in NaCl solution [J]. Journal of Alloys and Compounds, 2009, 473(1/2): 215-219.
[7] MA Zheng-qing, LI Wen-xian, YU Kun, WANG Ri-chu, LIANG Ying, CAO Jun-ji, YI Ning, LI Xue-hai. Electrochemical characteristics of magnesium alloys in synthetic seawater [J]. Materials Protection, 2002, 35(1): 16-18.
[8] QU Qing, MA Jie, WANG Lin, LI Lei, BAI Wei, DING Zhong-tao. Corrosion behaviour of AZ31B magnesium alloy in NaCl solutions saturated with CO2[J].Corrosion Science, 2011, 53(4): 1186-1193.
[9] ZHAO Hong-yang, BIAN Pei, JU Dong-ying. Electrochemical performance of magnesium alloy and its application on the sea water battery [J]. Journal of Environmental Sciences, 2009, 21(Supplement): 88-91.
[10] SONG Guang-ling. Corrosion and protection of Mg alloys [M]. Beijing Chemical Industry Press, 2006: 38-40.
[11] ZHAO Ming-chun, LIU Ming, SONG Guang-ling, ATRENS A. Influence of the ��-phase morphology on the corrosion of the Mg alloy AZ91 [J]. Corrosion Science, 2008, 50(7): 1939-1953.
[12] WANG Nai-guang, WANG Ri-chu, PENG Chao-qun, FENG Yan, ZHANG Xiang-yu. Corrosion behavior of Mg-Al-Pb and Mg-Al-Pb- Zn-Mn alloys in 3.5% NaCl solution [J]. Transactions of Nonferrous Metals Society of China, 2010, 20(10): 1936-1943.
[13] WANG Nai-guang, WANG Ri-chu, PENG Chao-qun, FENG Yan, ZHANG Xiang-yu. Influence of aluminum and lead on activation of magnesium as anode [J]. Transactions of Nonferrous Metals Society of China, 2010, 20(8): 1403-1411.
[14] ZAZOUA A, AZZOUZ N. An investigation on the use of indium to increase dissolution of Al Zn anodes in sea water [J]. Materials and Design, 2008, 29(4): 806-810.
[15] HUO Hong-wei, LI Ying, WANG Fu-hui. Corrosion of AZ91D magnesium alloy with a chemical conversion coating and electroless nickel layer [J]. Corrosion Science, 2004, 46(6): 1467-1477.
[16] LIU Wen-juan, CAO Fa-he, CHANG Lin-rong, ZHANG Zhao, ZHANG Jian-qing. Effect of rare earth element Ce and La on corrosion of behavior of AM60 magnesium alloy [J]. Corrosion Science, 2009, 51(6): 1334-1343.
[17] SONG Guang-ling, ATRENS A. Understanding magnesium corrosion-A framework for improved alloy performance [J]. Advanced Engineering Materials, 2003, 11(5): 837-858.
[18] SONG Guang-ling. Recent progress in corrosion and protection of Mg alloys [J]. Advanced Engineering Materials, 2005, 7(7): 563- 586.
[19] AMBAT R, AUNG N N, ZHOU W. Evaluation of micro-structural effects on corrosion behavior of AZ91D magnesium alloy [J]. Corrosion Science, 2000, 42(8): 1433-1455.
[20] ZHAO Ming-chun, LIU Ming, SONG Guang-ling, ATRENS A. Influence of pH and chloride ion concentration on the corrosion of Mg alloy ZE41 [J]. Corrosion Science, 2008, 50(11): 3168-3178.
[21] SHI Zhi-ming, LIU Ming, ATRENS A. Measurement of the corrosion rate of magnesium alloys using Tafel extrapolation [J]. Corrosion Science, 2010, 52(2): 579-588.
(Edited by HE Yun-bin)
Foundation item: Project(JPPT-115-168) supported by the National Key Science and Technology Program of China; Project(51101171) supported by the National Natural Science Foundation of China
Received date: 2011-06-20; Accepted date: 2012-02-21
Corresponding author: WANG Ri-chu, Professor, PhD; Tel: +86-731-88836638; E-mail: wrc@csu.edu.cn
Abstract: The effect of indium addition on the corrosion behavior of AP65 Mg alloy was examined. The indium modified AP65 exhibits accelerated pitting corrosion and overall corrosion, but there is almost no incubation period at the onset of corrosion. Polarization curve measurements indicate that the indium modified AP65 has more negative corrosion potential, which is an improvement aspect of the electrochemical activation. The corrosion current density increases from 0.126 to 0.868 mA/cm2 with and without 2.0% (mass fraction) indium addition. The mean potentials of AP65 negatively shift from -1.491 V to -1.584 V by adding 2.0% indium. The effect of indium addition on the corrosion performance of AP65 seems to be associated with the decrease of cathode-to-anode area ratio of the alloy, which may change the electrochemical anode and cathode polarization behavior of the alloy.
