

![]()

Trans. Nonferrous Met. Soc. China 22(2012) 2295-2305
Modeling and optimization of low-grade Mn bearing ore leaching using response surface methodology and central composite rotatable design
Dariush AZIZI, Sied Ziaedin SHAFAEI, Mohammad NOAPARAST, Hadi ABDOLLAHI
School of Mining, College of Engineering, University of Tehran, Tehran 1439957131, Iran
Received 17 November 2011; accepted 24 January 2012
Abstract:
The application of leaching process to extracting Mn from a low-grade manganese ore was investigated using a software based design of experiments. Four main parameters, i.e. sulfuric acid concentration, oxalic acid concentration, time and temperature were considered in a central composite response surface design. The recoveries of Mn and Fe were selected as response of design. The optimum conditions under which the Mn and Fe recoveries were the highest and the time and temperature were the lowest were determined using statistical analysis and analysis of variance (ANOVA). The results showed that Mn and Fe recoveries were 93.44% and 15.72% under the optimum condition, respectively. Also, sulfuric acid concentration was the most effective parameter affecting the process. The amounts of sulfuric and oxalic acid were obtained to be 7% and 42.50 g/L in optimum condition and the best time and temperature were 65 min and 63 ��.
Key words:
response surface methodology; leaching; manganese; optimization; modeling;
1 Introduction
Manganese is a strategic element that has been used in several industrial activities such as steel production, preparation of dietary additives, fertilizers, cells and fine chemicals [1]. Pyrolusite is the most important mineral of manganese. Hydrometallurgical treatment is one of the processes that can be used for enrichment of pyrolusite. The typical leaching process involves a chemical reductive step, acid leaching of Mn(II) ores, purification, separation and final recovery processes such as solvent extraction, electrolysis and electrowinning, and other recovery processes [2,3]. Acid sulfuric and different reducing agents have been used for leaching of pyrolusite. The most important reducing agents include ferrous iron solution [4], sulfite solution [5], hydrogen peroxide [6], sawdust [7], and oxalic acid [1]. The oxalic acid is an organic reductant that is produced by different microorganisms such as Aspergillus Niger [8].
A study by SAHOO et al [1] showed that oxalic and sulfuric acids can be suitable for leaching of low grade manganese ore. The results showed that the recovery of manganese was gained 98.4% when 30.6 g/L oxalic acid, 0.5 mol/L sulfuric acid, time of 105 min and temperature of 85 �� were applied. The reaction of MnO2 in the low manganese ore with oxalic acid could occur as follows [9]:
C2H2O4+MnO2+2H+=2CO2+Mn2++2H2O (1)
The manganese ions (released as manganese oxalate and manganese citrate) formed a product layer on the ore, and the reaction was proposed to be controlled by the diffusion of the reactants through the permeable product layer. The kinetic equation can be expressed by the shrinking core model [1-(1-��)1/3]2kt (where �� is the fraction of manganese reacted, k the rate constant and t the reaction time) [10].
This study involved modeling and optimization of some parameters affecting leaching process for Mn extraction from a manganese low-grade ore. Response surface methodology (RSM) and central composite rotatable design (CCRD) were used to model and optimize the influence of some parameters affecting acidic leaching process. The parameters selected in this investigation were the amounts of sulfuric and oxalic acids, leaching time and temperature. Indeed, the most important variables of manganese leaching procedure were investigated and determined.
2 Response surface methodology
The response surface methodology (RSM) is an statistical and mathematical technique for the modeling and optimization that can be influenced by different variables in responses of experiments [11]. In most RSM problems, the form of the relationship between the dependent and the set of independent variables is unknown. Thus, the first step in RSM is to find a suitable approximation for a functional relationship between the dependent and the independent variables. Second-order models are widely used in response surface methodology as they have several advantages. They are very flexible and can take on a wide variety of functional forms so they will work well as a good approximation to the true response surface. Moreover, it is easy to estimate the parameters in a second-order model using the method of least squares. Central composite design (CCD) is used extensively in building the second order response surface models. It is one of the most important experimental designs which has been used in the process optimization studies [12,13].
In several investigations, RSM has been used for modeling and optimization. MEHRABANI et al [14] used this method for the flotation of sphalerite. TRIPATHY et al [15] showed that this method was very effective in modeling of the high-tension roll separation (HTRS). BOULIFI et al [16] used RSM (full central composite) to optimize the synthesis process of isosorbide monoricinoleate ester. OZGEN et al [17] applied RSM to modeling and optimizing of operation parameters of hydrocyclones. ASLAN [18] used RSM for optimization of some parameters on agglomeration performance of bituminous coal. These studies showed that RSM can be an economical and effective method for optimization and modeling of various processes.
As mentioned above, the first requirement for RSM involves the design of experiments to achieve adequate and reliable measurement of the response of interest. To meet this requirement, an appropriate experimental design technique has to be employed. The experimental design techniques commonly used for process analysis and modeling are the full factorial, partial factorial and central composite rotatable designs [19,20].
An effective alternative to factorial design is central composite rotatable design (CCRD), originally developed by BOX and WILSON [21] and improved by BOX and HUNTER [22]. CCRD gives almost as much information as a three-level factorial, requires much fewer tests than the full factorial design and has been shown to be sufficient to describe the majority of steady-state process responses [20,23,24]. Hence in this study, it was decided to use CCRD to design the experiments.
The number of tests required for CCRD includes the standard 2k factorial with its origin at the center, 2k points fixed axially at a distance, ��, from the center to generate the quadratic terms and replicate tests at the center; where k is the number of variables. The axial points are chosen such that they allow rotatability [22], which ensures that the variance of the model prediction is constant for all points equidistant from the design center. Replicates of the test at the center are very important as they provide an independent estimate of the experimental error.
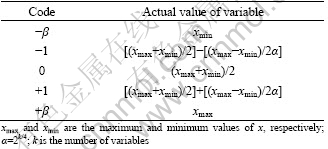
Once the desired ranges of values of the variables are defined, they are coded to lie at ��1 for the factorial points, at 0 for the center points and at ���� for the axial points. The codes are calculated as functions of the range of interest of each factor, as shown in Table 1 [25].
Table 1 Relationship between coded and actual values of a variable
3 Experimental
3.1 Characterization of materials
The representative sample of manganese oxide ore containing 12.56% Mn was used in this investigation. The sample was taken from south of Sabzebar region, Iran. Semi quantitative X-ray diffraction (SQXRD) technique was used to determine the main and the trace minerals in the sample. The result of the XRD analysis of the ore sample is given in Table 2. The XRD pattern of the Mn-bearing sample is shown in Fig. 1. The results of the mineralogical studies revealed the major manganese phase in the sample is pyrolusite (16%). The amounts of quartz, calcite, albite, cristobalite and montmorillonite in the concentrate are 49%, 18.3%, 3.2%, 3.2% and 2.3%, respectively.
3.2 Apparatus and experimental procedure
The leaching experiments were carried out in a 1000 mL three-neck flask (reactor). A magnetic heater stirrer (Multi stirrer DM-8 Scinics, Japan) was used as the base of the setup. The reactor was fitted on the magnetic stirrer. The reactor had two entrances. Every entrance was considered for special purpose that consisted of temperature measurement, feed entrance and condenser. Temperature could be measured by thermometer. The condenser was needed because some solution was evaporated and the content of pulp might be changed by evaporation during the experiment. Therefore, the condenser was used to keep the content of pulp constant by means of distillation of water vapor. The scheme of the experimental setup is given in Fig. 2.
Table 2 Mineralogical composition of sample analyzed using XRD method
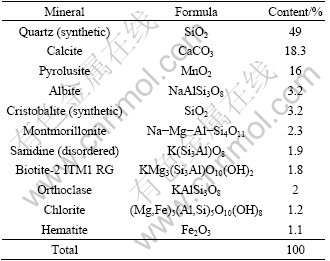
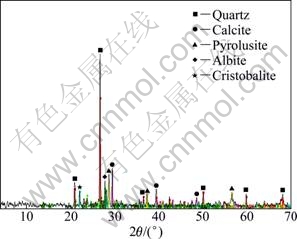
Fig. 1 XRD pattern of Mn-bearing sample
In the leaching experiments, the solution was prepared using distilled water, sulfuric acid (H2SO4), and oxalic acid (C2H2O4) from Merck Chemicals Co. After the desired temperature of the reactor was reached, the predetermined amount of pyrolusite concentrate was added to 500 mL leaching solution based on the required pulp density. The representative sample with mass of 65 g was used in all experiments. Size fraction of the sample was <150 ��m, ground using wet ball milling method. Solid mass fraction of the pulp was approximately 13% and the agitation speed was 800 r/min in all of the leaching tests, by which all the solid particles were fully suspended in the solution. Samples were taken out after reaction period at pre-determined intervals and were filtered using a paper filter. The filtered solution was analyzed for Mn and Fe, using an atomic absorption spectrophotometer (AAS). To calculate the fractions of Mn and Fe leached, the following equation was used:
![]() (2)
(2)
where R is the recovery of Mn or Fe; c and f are the concentrations of the element (Mn or Fe) in the leaching solution and the original sample, respectively; L is the volume of the leaching solution after filtration.
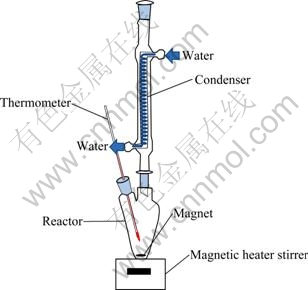
Fig. 2 Schematic view of leaching apparatus
3.3 Experiments design
The experiments were designed with software DX7. Four factors, time, temperature, amounts of sulfuric and oxalic acid, were considered in this investigation and consequently 28 experiments with central composite design were carried out, using the following ranges: sulfuric acid dosage of 1%-9%; oxalic acid dosage of 27.5-57.5 g/L; temperature of 55-95 ��; time of 45- 105 min.
4 Results and discussion
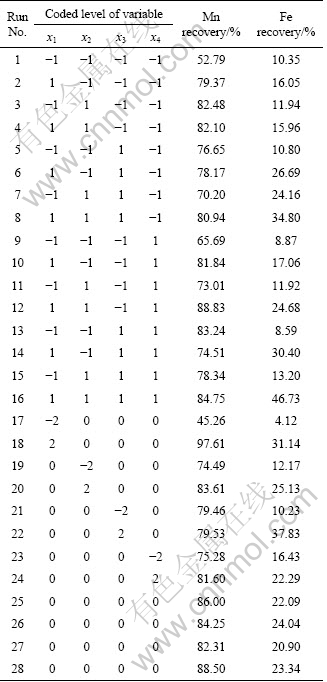
The central composite rotatable design (CCRD) method was used; 28 set of tests with appropriate combination of the amounts of sulfuric acid (x1), oxalic acid (x2), temperature (x3) and time (x4) were designed. The factors and the coded/actual values are given in Table 3. Also the central composite design with the coded/actual values and the results of experiments are given in Table 4.
If all variables are assumed to be measurable, then the response surface can be expressed as:
y=f(x1, x2, x3, ��, xi) (3)
where y is the output and xi the variables of action called factors. For the central composite design, a total of 28 experimental runs are required [17,18]. The results were inserted to ��Design Expert (DX)�� software and a model was chosen and fitted to the results. The final equations in terms of coded factors are selected as following:
Table 3 Coded and actual levels of independent variables used in RSM design
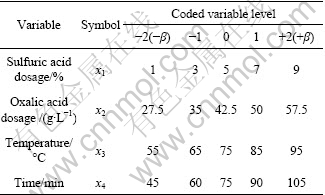
Table 4 Central composite rotatable design consisting of experiments for study of four experimental factors in coded levels with experimental results
For Mn recovery,
y1=85.27+13.09x1+2.78x2+0.87x3+1.67x4-0.18x1x2-
3.01x1x3-0.55x1x4-2.82x2x3-0.57x2x4+
0.14x3x4-3.46x12-1.56x22-1.45x32-1.71x42+
3.23x1x2x3-8.83x1x22 (4)
For Fe recovery,
y2=21.89+6.76x1+3.35x2+5.57x3+0.93x4+0.59x1x2+
3.20x1x3+2.50x1x4+1.89x2x3+0.54x1x4-0.36x3x4-
1.19x12-0.94x22+0.28x1x22 (5)
The results of analysis of variance (ANOVA) consisting of p-value, sum of square, mean square, F-value and degree freedom (df) are shown in Tables 5 and 6. The results showed that the prediction models of the Mn and Fe recoveries are significant because p-value of the models is under 0.05. Also, the influence of sulfuric or oxalic acid dosage on the Mn recovery is significant but the influence of time or temperature is not significant. Interaction between sulfuric acid and temperature, or oxalic acid and temperature is significant, while other interactions don��t have main effect on the Mn recovery.
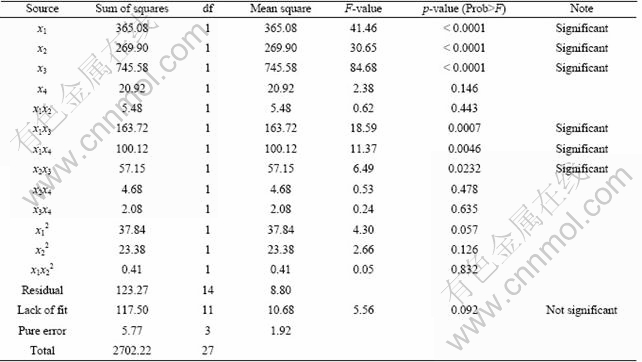
Table 6 shows the results of ANOVA of the Fe recovery. The influences of all of the variables except time are significant on the Fe recovery, and there are significant interactions between sulfuric acid and time, sulfuric acid and temperature and finally oxalic acid and temperature. Also, the predicted values for Mn and Fe recoveries are given in Table 7. The coefficient of multiple determinations (R2) fitted in them by the high value of R2 indicates that the equation is capable to represent the system under the given experimental domain [14]. JOGLEKAR and MAY [26] suggested that for a good fit of a model, R2 should be at least 0.80. R2 was found to be 0.932 for Mn recovery and 0.935 for Fe recovery, as given in Figs. 3 and 4. The value of R2 shows that there is an acceptable relationship between the predicted and actual values; therefore, the models fitted are significant.
4.1 Influence of variables on Mn recovery
The influences of sulfuric and oxalic acids concentration and other parameters such as time and temperature on the Mn recovery were evaluated. The results showed that the concentration of sulfuric acid has the most effect on the Mn recovery; indeed, enhancement of sulfuric acid dosage increases the Mn recovery. While other parameters have fewer influence on the Mn recovery. The results are illustrated in detail in Fig. 5.
Furthermore, the interactions between variables and their influence on the Mn recovery were investigated. The results showed that there are meaningful interactions between sulfuric acid concentration and temperature and oxalic acid concentration and temperature. These results are given in Fig. 6.
Table 5 Analysis of variance (ANOVA) of developed models for Mn recovery
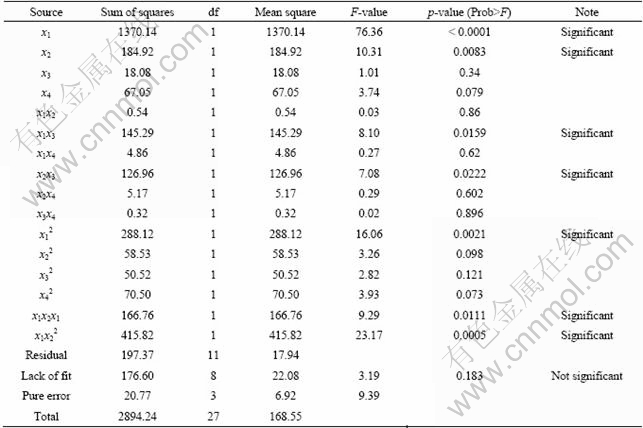
Table 6 Analysis of variance (ANOVA) of developed models for Fe recovery
4.2 3D response surface plot
In order to gain a better understanding of the interaction effects of variables on recovery, three- dimensional (3D) plots for the measured responses were formed based on the model equations (Eqs. (4) and (5)). Also the relationship between the variables and responses can be further understood by these plots. Since each model has four variables, two variables were held constant at center level; therefore, a total of 12 response surface plots were produced for responses.
Table 7 Predicted values for Mn and Fe recoveries
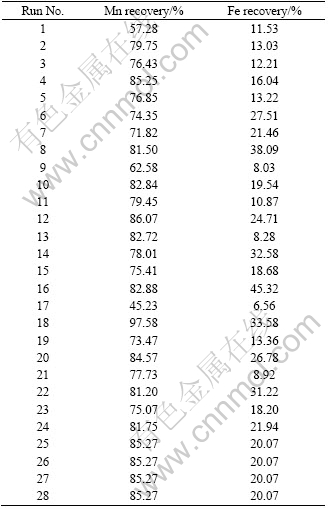
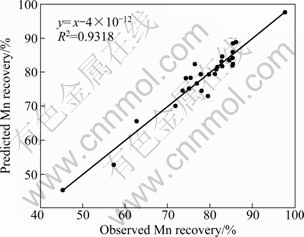
Fig. 3 Relationship between predicted and actual (observed) values for Mn recovery
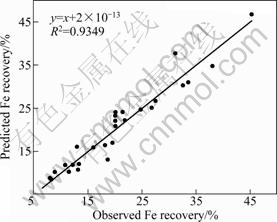
Fig. 4 Relationship between predicted and actual (observed) values for Fe recovery
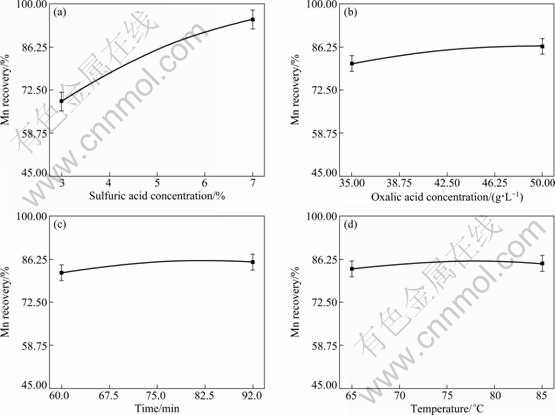
Fig. 5 Main influence of variables on Mn recovery
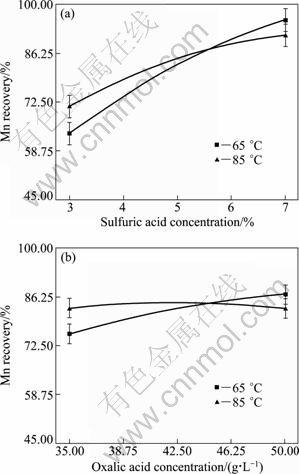
Fig. 6 Interaction of variables on Mn recovery
The relationship between variables and their influence on the response, the Mn recovery, is shown in Fig. 7. Figure 7(a) shows the influence of sulfuric acid and oxalic acid concentration on the Mn recovery. It indicates that enhancement of sulfuric acid concentration increases the Mn recovery and a middle level of oxalic acid has the same influence on the Mn recovery. Figure 7(b) shows that temperature does not have significant influence on the Mn recovery. The influence of temperature on the Mn recovery is approximately invariable. Also, Fig. 7(c) presents considerable influence of sulfuric acid dosage and invariable influence of time on the Mn recovery. In others words, Figs. 7(d), (e) and (f) indicate that oxalic acid, time and temperature have approximately invariable influence on the Mn recovery.
4.3 Optimization
Finding an optimum condition of leaching process with the highest Mn recovery, the lowest consumption of chemical materials, minimum time and temperature was the main object of this investigation. The response surface methodology can be used to find desirable location in the design space. Variables can be minimum or maximum in this location; also, economical condition was considered to find desirable location. In this research, the response surface methodology was used by DX7 software to find the best condition of pyrolusite leaching process. Indeed, minimum time, temperature, consumption of sulfuric and oxalic acids were determined by DX7 software. The results of the process optimization and optimum levels of variables are demonstrated in Table 8.
Table 8 presents different optimum conditions with various targets. The first predicted conditions considered maximum levels of the Mn and Fe recoveries and minimum amounts of variables as the optimization target. The Mn and Fe recoveries reached 75.86% and 15.78%, respectively; also, sulfuric and oxalic acids concentration were 4.84% and 37.43 g/L and time and temperature of the process were 60 min and 69.26 �� approximately, respectively. The desirability of this predicted condition achieved 0.62. The second predicted conditions considered maximum level of the Mn recovery and minimum level of the Fe recovery and amounts of variables. The second conditions were similar to the first conditions. Sulfuric and oxalic acid concentrations achieved 4.59% and 35 g/L, and time and temperature of the process were 60 min and 65 ��, respectively. The Mn and Fe recoveries and the desirability of this condition were 69.55%, 12.96% and 0.74, respectively. Finally, the third predicted conditions show the best compared with the other conditions. The Mn and Fe recoveries were 93.44% and 15.81%, respectively, but the amounts of variables shows more than the other conditions. On the other hand, the desirability of this condition was more and the Mn recovery was achieved more much. Indeed, the third predicted condition was chosen as the best optimum condition by DX7 software.
Furthermore, 3D response surface plots for optimum condition were constructed by DX7 software. These plots are shown in Fig. 8.
Figure 8 shows that the most effective amounts of sulfuric and oxalic acid were 7% and 42.5 g/L on the desirability of optimum condition. Also, the best time and temperature were found to be 65 min and 63 ��, respectively. Moreover, the influence of variables on the Mn recovery was studied, and the results are given in Fig. 9. But, in this case, sulfuric acid was considered the most important variable because sulfuric acid had more effect than other variables on the Mn recovery. As a result, this study focused more on the influence of sulfuric acid dosage in leaching process. The 3D response surface plot showing the influence of leaching variables (sulfuric acid dosage with other parameters) on the Mn recovery in the optimum condition are demonstrated in Fig. 9.
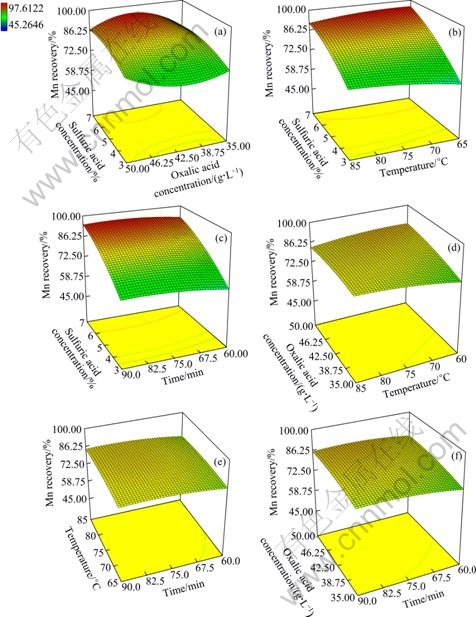
Fig. 7 Response surface plots showing effect of two variables on Mn recovery (other two variables are held at center level): (a) Sulfuric and oxalic acid concentration; (b) Sulfuric acid concentration and temperature; (c) Sulfuric acid concentration and time; (d) Oxalic acid concentration and temperature; (e) Temperature and time; (f) Oxalic acid concentration and time
Table 8 Results of process optimization and optimum levels of variables
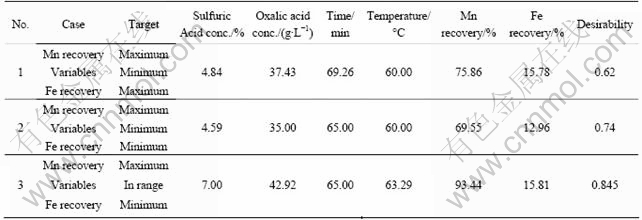
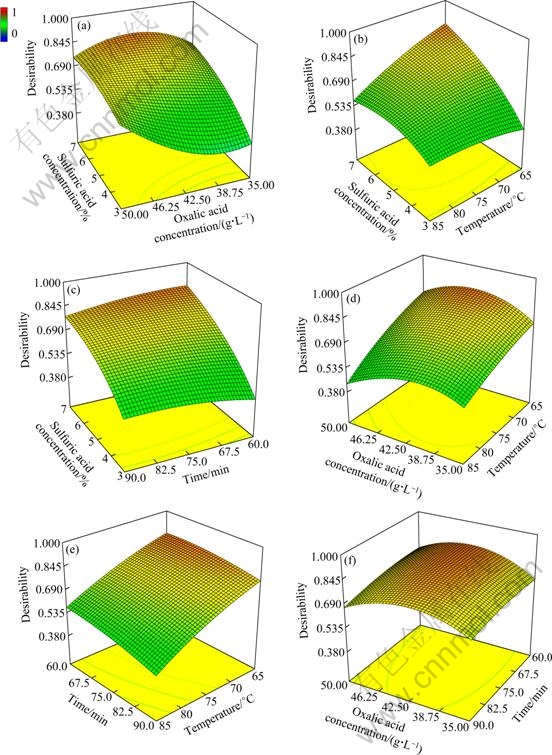
Fig. 8 3D response surface plot showing influence of leaching variables on desirability of optimum condition: (a) Sulfuric and oxalic acid concentration; (b) Sulfuric acid concentration and temperature; (c) Sulfuric acid concentration and time; (d) Oxalic acid concentration and temperature; (e) Temperature and time; (f) Oxalic acid concentration and time
5 Conclusions
1) In optimum conditions, the Mn and Fe recoveries of 93.44% and 15.81% were obtained, respectively; also, the desirability of optimum condition was approximately 0.845. As a result, leaching can be a useful method for enrichment of manganese ores.
2) The amounts of sulfuric acid and oxalic acid of 7% and 42.92 g/L were obtained in optimum conditions, and the best time and temperature in optimum conditions were achieved to be 65 min and 63 ��, respectively.
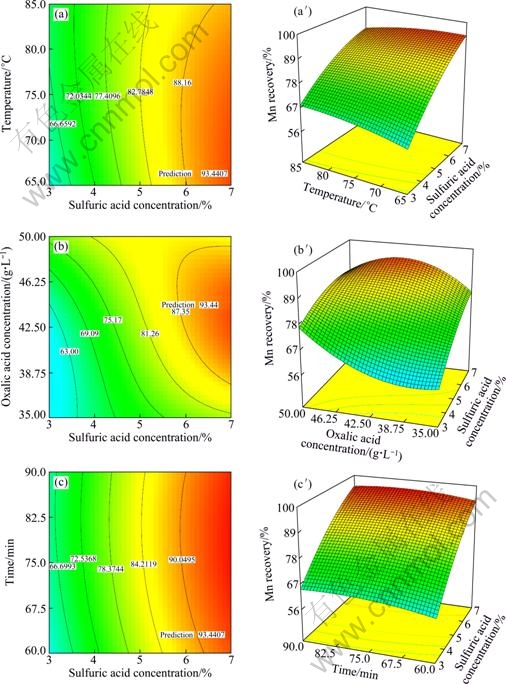
Fig. 9 3D response surface plot showing influence of leaching variables on Mn recovery in optimum condition: (a,a��) Sulfuric acid concentration and temperature; (b,b��) Sulfuric and oxalic acid concentration; (c,c��) Sulfuric acid concentration and time
3) Sulfuric acid had the most influence on the Mn recovery compared with other variables; also, oxalic acid, time and temperature have little influence on the Mn recovery.
References
[1] SAHOO R K, NAIK S, DAS S C. Leaching of manganese ore using oxalic acid as reductant in sulphuric acid solution [J]. Hydrometallurgy, 2001, 62: 157-163.
[2] ZHANG W, CHENG Y C. Manganese metallurgy review. Part I: Leaching of ores/secondary materials and recovery of electrolytic/ chemical manganese dioxide [J]. Hydrometallurgy, 2007, 89: 137-159.
[3] ZHANG W, CHENG Y C. Manganese metallurgy review. Part II: Manganese separation and recovery from solution [J]. Hydrometallurgy, 2007, 89: 160-177.
[4] DUNDUA R, AGNIASHVILI G. Manganese recovery from residual slimes in the electrochemical manufacture of manganese dioxide [J]. Proceedings of the Academy of Science of Georgia, a Series of Chemical, 1999, 25: 1-2.
[5] PETRIE L M. Molecular interpretation for SO2 dissolution kinetics of pyrolusite, manganite and hematite [J]. Appl Geochem, 1995, 10: 253-267.
[6] JIANG T, YANG Y B, HUANG Z C, QIU G Z. Simultaneous leaching of manganese and silver from manganese-silver ores at room temperature [J]. Hydrometallurgy, 2003, 69: 177-186.
[7] SANIGOK U, BAYRAMOGLU M. Bench-scale manganese sulfate production from low-grade pyrolusite ores (Part III) [J]. Chimica Acta Turcica, 1988, 16: 9-20.
[8] ABBRUZZESE B, DUARTE M Y, PAPONETTI B, TORO L. Biological and chemical processing of low-grade manganese ores [J]. Minerals Engineering, 1990, 3: 307-318.
[9] ABBRUZZESE C. Percolation leaching of manganese ore by aqueous sulfur dioxide [J]. Hydrometallurgy, 1990, 25: 85-97.
[10] ACHARYA C, KAR R N, SUKLA L B. Studies on reaction mechanism of bioleaching of manganese ore [J]. Minerals Engineering, 2003, 16: 1027-1030.
[11] MONTGOMERY D C. Design and analysis of experiments [M]. New York: John Wiley & Sons, 2001.
[12] MYERS R H, MONTGOMERY D C. Response surface methodology [M]. New York: John Wiley & Sons, 2002.
[13] ANDERSON M J, WHITCOMB P J. DOE simplified: Practical tools for effective experimentation [M]. Productivity Inc, 2000.
[14] MEHRABANI J V, NOAPARAST M, MOUSAVI S M, DEHGHAN R, GHORBANI A. Process optimization and modeling of sphalerite flotation from a low-grade Zn-Pb using response surface methodology [J]. Separation & Purification Technology, 2010, 27: 242-249.
[15] TRIPATHY S M, RAMAMURTHY Y, RAGHU KUMAR C. Modeling of high-tension roll separator for separation of titanium bearing minerals [J]. Powder Technology, 2010, 201: 181-186.
[16] BOULIFI N E, ARACIL J, MARTINEZ M. Lipase-catalyzed synthesis of isosorbide monoricinoleate: Process optimization by response surface methodology [J]. Bioresource Technology, 2010, 101: 8520-8525.
[17] ?ZGEN S, YILDIZ A, ?ALI?KAN A, SABAH E. Modeling and optimization of hydrocyclone processing of low grade bentonites [J]. Application Clay Sci, 2009, 46: 305-313.
[18] ASLAN N, UNAL I. Optimization of some parameters on agglomeration performance of Zonguldak bituminous coal by oil agglomeration [J]. Fuel, 2009, 88: 490-496.
[19] BOX G E P, HUNTER W G. The 2k-p fractional factorial designs, part I and II [J]. Technometrics, 1961, 3: 311-458.
[20] OBENG D P, MORRELL S, NAPIER-MUNN T J. Application of central composite rotatable design to modeling the effect of some operating variables on the performance of the three-product cyclone [J]. International Journal of Mineral Processing, 2005, 76: 181-192.
[21] BOX G E P, WILSON K B. On the experimental attainment of optimum conditions [J]. The Royal Statistical Society, Series B, Statistical Methodology, 1951, 13: 1-45.
[22] BOX G E P, HUNTER W G. Multi-factor experimental design for exploring response surfaces [J]. Mathematical Statistics, 1957, 28: 195-241.
[23] CILLIERS J J, AUSTIN R C, TUCKER J P. An evaluation of formal experimental design procedures for hydrocyclone modeling [C]//SVAROVSKY L, THEW M T. Proceedings of 4th International Conference on Hydrocyclones. Southampton: Kluwer Academic Publishers, 1992: 31-49.
[24] CROZIER R D. Flotation theory reagents and ore testing [M]. New York: Pergamon Press, 1992.
[25] ASLAN N. Application of response surface methodology and central composite rotatable design for modeling and optimization of a multi-gravity separator for chromite concentration [J]. Powder Technology, 2008, 185: 80-86.
[26] JOGLEKAR A M, MAY A T. Product excellence through design of experiments [J]. Cereal Foods World, 1987, 12: 857-868.
������Ӧ�淽�������ĸ�����ת��ƶԵ�Ʒλ�̿�������̽�ģ���Ż�
Dariush AZIZI, Sied Ziaedin SHAFAEI, Mohammad NOAPARAST, Hadi ABDOLLAHI
School of Mining, University College of Engineering, University of Tehran, Tehran, Iran
ժ Ҫ������ʵ����������Դӵ�Ʒλ�̿��н�����ȡ�̵Ĺ��̽����Ż��������ĸ�����Ӧ��ʵ������У�������4����ҪӰ��������̵IJ�����������Ũ�ȡ�����Ũ�ȡ�����ʱ����¶ȡ����̺����Ľ�������Ϊ����ָ�ꡣ����ͳ�Ʒ����ͷ������ȷ������������������ߵ��̺��������ʡ���̵Ľ���ʱ�����͵��¶ȡ��������������Ũ����Ӱ��������̵��������IJ����������������£�����Ũ��7%������Ũ��42.5 g/L������ʱ��60 min����Ӧ�¶�65 �棬�̺����Ľ����ʿɷֱ�ﵽ93.44%��15.72%��
�ؼ��ʣ���Ӧ�淽�����������̣��Ż�����ģ
(Edited by YUAN Sai-qian)
Corresponding author: Hadi ABDOLLAHI; Tel/Fax: +98-21-64592257; +98-912-5032335; E-mail: hadi_abdollahi2003@yahoo.com; h_abdollahi@ut.ac.ir
DOI: 10.1016/S1003-6326(11)61463-5
Abstract: The application of leaching process to extracting Mn from a low-grade manganese ore was investigated using a software based design of experiments. Four main parameters, i.e. sulfuric acid concentration, oxalic acid concentration, time and temperature were considered in a central composite response surface design. The recoveries of Mn and Fe were selected as response of design. The optimum conditions under which the Mn and Fe recoveries were the highest and the time and temperature were the lowest were determined using statistical analysis and analysis of variance (ANOVA). The results showed that Mn and Fe recoveries were 93.44% and 15.72% under the optimum condition, respectively. Also, sulfuric acid concentration was the most effective parameter affecting the process. The amounts of sulfuric and oxalic acid were obtained to be 7% and 42.50 g/L in optimum condition and the best time and temperature were 65 min and 63 ��.
