
Trans. Nonferrous Met. Soc. China 26(2016) 2433-2441
Stress based forming limit diagram for formability characterization of 6061 aluminum
R. SAFDARIAN
Department of Mechanical Engineering, Behbahan Khatam Alanbia University of Technology, Behbahan, Khoozestan, Iran
Received 8 September 2015; accepted 18 January 2016
Abstract:
Two numerical criteria of forming limit diagram (FLD) criterion and ductile fracture criterion (DFC) are presented for FLD prediction of 6061 aluminum. The numerical results are compared with the experimental FLD and also punch��s load-displacement curve of experimental samples. Experimental FLD of this study is calculated using hemispherical punch test of Hecker. Experimental FLD is converted to FLSD and imported to the Abaqus software to predict necking of samples. Numerical results for FLSD prediction were compared with experimental FLSD. Results show that ductile fracture criterion has higher accuracy for FLD and FLSD prediction of 6061 aluminum. Comparison of numerical and experimental results for force-displacement curve of punch shows that numerical results have a good agreement with experiment.
Key words:
aluminum alloy 6061; forming limit diagram (FLD); forming limit stress diagram (FLSD); ductile fracture criterion; finite element method;
1 Introduction
Prediction of the forming limits in sheet metal forming is very important in order to identify the conditions that may lead to necking and fracture. The forming limit curve at necking (FLCN) is used as a criterion for prediction of sheet metal forming limit. It displays in principal strain space (major and minor strains) at the onset of local necking. On the other hand, the forming limit curve at fracture (FLCF) is defined by the combined principal strains up to fracture. Figure 1 indicates the schematic diagrams showing the FLCN and FLCF. Here, �� (=d��2/d��1) defines stress ratio and �� (=d��2/d��1) is the strain ratio. For a given initial strain path, after the onset of strain localization, the material deforms in restricted area and follows an almost plane strain path up to failure [1].
FLD of sheet metals was initially characterized by KEELER and BACKOFEN [2] and GOODWIN [3] and later became industrial practice as well as a topic of research, both theoretically and experimentally. Since then, a lot of researches have been performed for calculation of FLCN and FLCF. Forming limit diagrams at necking and at fracture for AA6111-T4 sheet material were experimentally determined by JAIN et al [4], and surfaces of fractured dome specimens were observed by optical microscopy and by scanning electron microscope (SEM). OZTURK and LEE [5] obtained the limit strains for FLD by substituting stress and strain values obtained from the finite element (FE) simulation of out-of-plane formability test into the ductile fracture criterion.
SAFDARIAN et al [6] used different numerical methods for FLD prediction of tailor welded blanks (TWBs). Their results showed that numerical methods are useful for prediction of left hand side of FLD, but they can not extend in the right hand side of FLD. They also studied the effect of thickness ratio on the level of FLD for St12 TWB with different thickness ratios in another research [7]. Their results showed that FLD��s level increases by thickness ratio decreasing of TWB. SAFDARIAN [8] used Marciniak-Kuczynski (M�CK) model for necking prediction of IF tailor welded blank. Bending strain was added to the M-K model and a new model was presented which was used as a criterion in the Abaqus software. Python programming language was used to link this model to software.
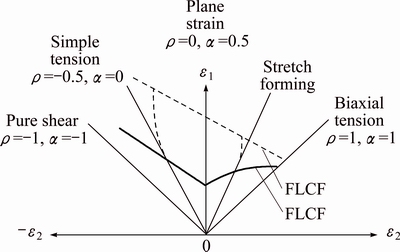
Fig. 1 Schematic diagram showing FLCN and FLCF
Although the FLD method is useful tool for the analysis of sheet metal formability in the forming processes, it has been shown to be valid only for cases of proportional loading, where the ratio between the principal stresses remain constant throughout the forming process. In an industrial application, complex work pieces are usually manufactured in multi-step processes, from which the influence of the non-proportional strain history on the FLD can be problematic [9]. Under such conditions, the FLD cannot be successful for formability prediction in the sheet metal forming. Additionally, several authors have used FLSD and proved that a FLD only applies to linear strain ratios [10-12].
ARRIEUX [13] presented the method of FLSD determination which used the information obtained from total deformation paths for the crack initiating area, by using the Nakazima FLD tests. STOUGHTON [14] used stress-based forming limit diagram for forming limit investigation of both proportional loading and non-proportional loading. Forming limit stresses can also be obtained from numerical results of forming tests in the finite element method (FEM). In the FEM, the numerically calculated stresses can be evaluated incrementally in the necking area while approaching the FLD-failure criterion. UTHAISANGSUK et al [15] used FEM simulation of Nakazima tests to determine the forming limit stress diagram. When the strains from the crack-critical elements in the simulation reach the forming limit curve (FLD criterion), the maximum stresses on these elements are evaluated. FANG et al [16] studied FLD and FLSD of aluminum alloy 1060 under linear and nonlinear strain paths. In this study, influences of the material��s yield criteria on FLSD are also discussed by comparison of the Hill��s 48, Hill��s 79 and Hosford non-quadratic criterion.
In the present work, different numerical approaches are used to predict the FLD and FLSD of aluminum alloy 6061. These methods contained: forming limit diagram (FLD) criterion, ductile fracture criterion (DFC) and forming limit stress diagram (FLSD).
Experimental tests of FLD are done based on the Nakazima FLD test to characterize forming behavior of 6061 aluminum sheet. Numerical results for FLD, FLSD and punch��s load-displacement prediction are compared with experimental results of present research. Numerical results have a good agreement with experimental results.
2 Methodologies
2.1 Experimental materials and properties
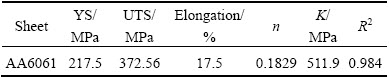
Because of the high specific strength, aluminum alloy 6061 has many applications in different industries like automotive and aerospace industries and can help the reduction of fuel consumption. Sheet of aluminum alloy 6061 with thickness of 1 mm was used for formability characterization in the present study. The chemical composition of this alloy is shown in Table 1. Figure 2 shows engineering stress-strain curve of aluminum alloy 6061. Mechanical properties of this aluminum are shown in Table 2. These mechanical properties are yield stress (YS), ultimate tensile strength (UTS), work hardening exponent (n), work hardening coefficient (K) and elongation which were evaluated by standard tensile testing of ASTM-E8 specification at 2 mm/min cross-head speed [17]. Hollomon��s equation (��=K ��n) was used to model the plastic behavior of sheet material. The R2 value in Table 2 shows curvature fitting of stress-strain curves related to 6061 aluminum sheet.
Table 1 Chemical composition of aluminum alloy 6061
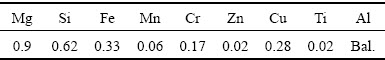
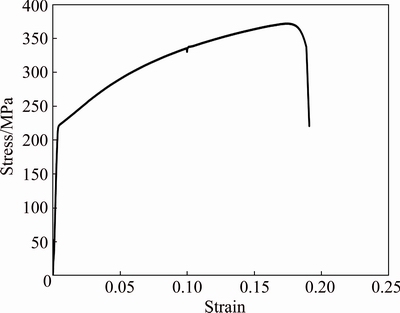
Fig. 2 Tensile test results of 6061 aluminum sheet
Table 2 Mechanical properties of aluminum alloy 6061 from tensile test
The standard seven different strain paths (25 mm �� 175 mm to 175 mm �� 175 mm) were cut from a 6061 aluminum sheet with 1 mm in thickness for FLD characterization. The samples were prepared according to the Hasek method [18], see Fig. 3, for determining FLDs, specimens were grid marked with circles of 2.5 mm by an electrochemical etching method to measure major and minor strains calculations after deformation.
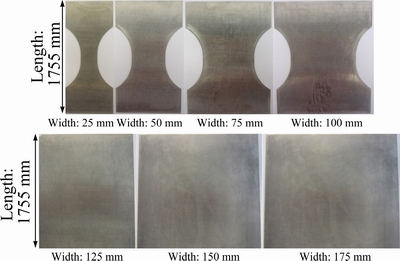
Fig. 3 Samples of 6061 aluminum with different widths for FLD tests
2.2 Experimental set up for FLD
Experimental FLD calculation was done by stretch forming tests according to the procedure suggested by NAKAZIMA et al [19] using a hemispherical punch of 101.6 mm diameter on a 200 kN hydraulic press. The schematic arrangement of the tools is shown in Fig. 4.
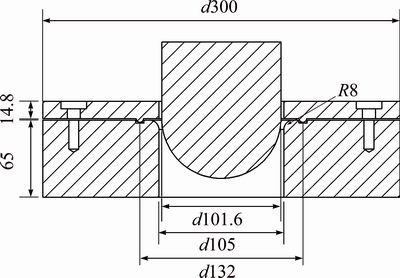
Fig. 4 Schematic of tools used in stretch forming experiments (unit: mm)
Oil was used as lubrication between punch and sheet surface contact in all tests. Punch speed was 20 mm/min. An optimum blank holding force in the range of 60-100 kN was applied on the upper die. The press was equipped with load and displacement sensors and experiments were stopped when forming load decreased suddenly.
2.3 Numerical investigation
Numerical investigations of FLD and FLSD of 6061 aluminum blanks were done using a commercially available finite element code Abaqus/Explicit 6.11. The FEM model consisted of a hemispherical punch, blank holder, die and the blank as shown in Fig. 5. Punch, die and blank holder were modeled as analytical rigid parts, because they have negligible deformation. The blank was modeled as a deformable part using four node Kirchhoff thin shell elements (S4R). The circular draw-bead model is obtained by constraint forces applied on a circular partition of sheet at a distance of 66 mm from the center of the die. The die was fixed and the punch was moved downward with a numerical speed of 1000 mm/s. This speed was selected based on the quasi-static condition of forming process [20].
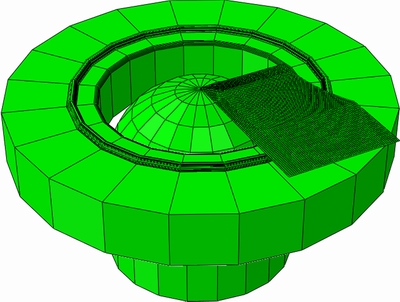
Fig. 5 Setup of tools used in numerical simulation
2.4 FLD criteria
Forming limit diagram (FLD) criterion and ductile fracture criterion (DFC) (Abaqus  6.10) were used for prediction of aluminum sheet��s FLD. The fundamentals of these criteria are presented, in order to understand and relate corresponding behavior and results.
2.5 FLD criterion
The maximum strains that a sheet material can sustain prior to the onset of necking are referred as forming limit strains. A FLD is a plot of the forming limit strains in the space of principal strains. The necking initiation criterion for the FLD is given by the condition ��FLD=1, where the variable ��FLD is a function of the current deformation state and is defined as the ratio of the current major principal strain, ��1, to the major limit strain on the forming limit curve (FLC) evaluated at the current values of the minor principal strain, ��2. Figure 6 shows the application of this criterion for FLD calculation.
In this research, experimental FLD of aluminum sheet was imported to FE code as FLD criterion. Experimental FLD was based on the major and minor strains which were measured from the experimental samples of present study. This FLD was used in the Abaqus software to predict the necking defects in the FEM samples. After completion of simulations, first element with ��FLD=1, was considered as necking element and its major and minor strains were used to define a point on FLD. This test was performed for all samples. Load and displacement of the punch at necking based on FLD criterion were compared with experiment.
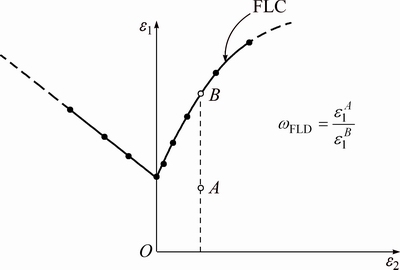
Fig. 6 FLD criterion in Abaqus software
2.6 Ductile fracture criterion
The fracture of ductile materials is mainly due to growth and coalescence of microscopic voids existing within the material. In the numerical simulation, when the fracture threshold within an element is reached, that element fractures and a crack occurs. This model assumes that the equivalent plastic strain at the onset of damage,  , is a function of stress triaxiality and strain rate
 (1)
(1)
where �� is stress triaxiality and  is the equivalent plastic strain rate.
The criterion for damage initiation is met when the following condition is satisfied:
 (2)
(2)
and stress triaxiality can be calculated as follows:

 (3)
(3)
where ��m is mean stress,  is von Mises equivalent stress, ��1, ��2 and ��3 are principal stresses.
By plane stress assumption ��3=0, ��1 and ��2 can be calculated from experimental major strain (��1) and minor strain (��2). The ratio of the minor true strain, ��2, to the major true strain, ��1, is defined by the parameter
 (4)
(4)
The ratio of the minor true stress, ��2, to the major true stress, ��1, is defined by the parameter
 (5)
(5)
By Eqs. (4) and (5), normal anisotropy assumption for sheet and flow rule, the relation between �� and �� is as follows:
 (6)
(6)
where R is the normal anisotropy and can be calculated by following equation:
 (7)
(7)
where r0, r45 and r90 are anisotropic parameters at 0, 45�� and 90��, respectively.
Plasticity theory defines an effective stress,  , which is a function of the stress tensor components and a set of material parameters. For materials with normal anisotropy and zero shear stress in a coordinate system aligned with the anisotropy, the definition of the effective stress can be expressed in terms of the principal stresses.
 (8)
(8)
This relation can also be expressed in terms of ��1 and ��.
 (9)
(9)
where ��(��) is a function of material parameters and can be calculated as follows:
 (10)
(10)
where �� is calculated by Eq. (6) and using major and minor strains from experimental FLD; the relation between the effective stress and effective strain can be written formally as
 (11)
(11)
The most commonly used representation of this relation is the power law.
 (12)
(12)
where K and n are material constants and  can be calculated as follows:
 (13)
(13)
By substituting Eqs. (12) and (10) into Eq. (9), ��1 is obtained. Then ��2 is calculated by Eq. (5) and using ��1, ��2 and plane stress condition, and �� is obtained by Eq. (3). When importing DFC to FE code, two parameters of stress triaxiality and fracture strain are needed, in which fracture strain is equivalent to fracture strain at damage initiation. Equivalent fracture strain at damage initiation,  , can be calculated by Eq. (13). First element which ��D=1 is selected as necking element and major and minor strains of such element is imported to the forming limit diagram.
2.7 Forming limit stress diagram (FLSD)
When strain-based FLCs are converted into stress-based FLCs, the resulting stress-based curves have been shown to be minimally affected by changes to the strain path [14]. Therefore, different strain-based FLCs, corresponding to different strain paths, are mapped onto a single stress-based FLC. This property makes forming limit stress diagrams (FLSDs) an attractive alternative to FLDs for the prediction of necking instability under arbitrary loading.
Forming limit stress diagram of aluminum alloy 6061 was calculated from experimental results of forming limit strains. True major and minor stresses were calculated using major and minor strains of experimental samples and equations which were presented in the previous section. True major and minor stresses were imported to the Abaqus software as forming limit stress diagram (FLSD). FLSD is used in the Abaqus software like FLD.
3 Results and discussion
3.1 Load-displacement curves
As mentioned before, punch speed in the numerical simulation was selected based on the quasi-static condition of sheet metal forming in the Abaqus software. This condition in the Abaqus software is low ratio of kinetic energy to internal energy (1% or less). Therefore, ratio of kinetic to internal energy of sample with width of 175 mm is presented in the Fig. 7. It is clear that ratio of kinetic to internal energy is less than 1%. Therefore, selected speed for punch movement is correct.
The simulated punch load profiles were compared with experiments of samples with different widths as shown in Fig. 8. Results show that experimental and numerical load�Cdisplacement curves are monotonically increasing, reaching a maximum value when fracture occurs, followed by a sudden decrease on drawing force. However, the intensity of force reduction in the experimental curve is more evident than the numerical ones. Figure 8 also indicates that there is a good agreement between numerical investigations and experimental tests.
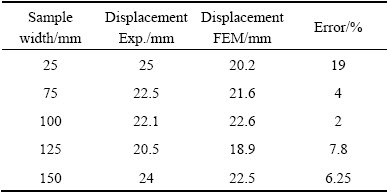
For better understanding of difference of numerical prediction with experiment results for punch displacement until sheet necking, comparison of experimental and numerical results for punch displacement is shown in Table 3. Error values of this table for all samples except for sample with width of 25 mm are less than 10% and show that numerical prediction for punch displacement is near to the experiment for these samples. Blank holder force is an important parameter which can affect the punch displacement until sheet necking. For sample with width of 25 mm may be selected blank holder force is not appropriate and this causes difference of experimental and numerical punch displacement.
Fracture positions of experimental samples after FLD tests are shown in Fig. 9. Because of using oil as lubrication between punch and sheet surface, fracture position is at the pole of samples. Frictionless contact between punch and sheet surface causes that sheet in the contact area is under more tension than other sheet��s area and therefore fracture happens at the pole of samples.
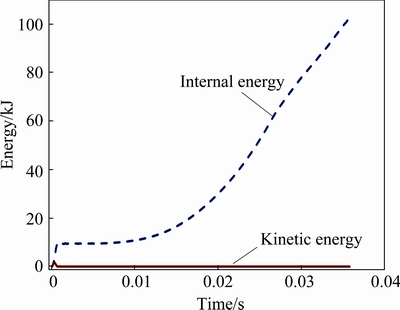
Fig. 7 Comparison of kinetic and internal energy for sample with width of 175 mm
3.2 FLD prediction
Comparison of experimental results and numerical criteria for FLD prediction is shown in Fig. 10. This figure shows that DFC has good agreement with experimental FLD. Although FLD is based on the experimental forming limit diagram which was imported to the Abaqus software, all the predicted points of this criterion located in the fracture area and upper than experimental FLD. DFC has an acceptable accuracy for prediction of left hand side of FLD and results of this criterion for this area are near to experimental results. Although DFC has a good agreement with experimental results for the left hand side of FLD, its results are far from experimental FLD for the right hand side. This is the main drawback of this criterion and also other numerical criteria of FLD prediction which were mentioned by OZTURK and LEE [5].
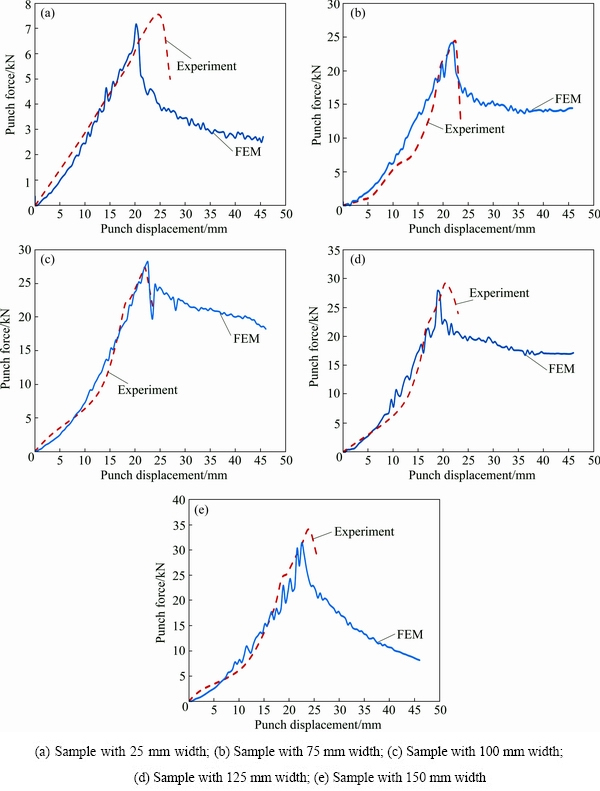
Fig. 8 Load-displacement comparison of FEM and experiments for samples with different widths
Table 3 Comparison of numerical and experimental punch displacement for different samples
3.3 FLSD prediction
Whereas it is not possible to measure forming limit stress diagram (FLSD) experimentally, major and minor stresses of FLSD were calculated using FLD data. To generate the FLSD, the measured strain data of FLD were converted into stress form using the method proposed in the Section 4.2 of the present study. Comparison of experimental, numerical FLSD and FLSD which were calculated using ductile fracture criterion is shown in Fig. 11. In this figure, the limit stresses at necking are calculated for linear strain paths in the range of -0.3<��<1, and for linear stress paths (0<��<1). It is found that the limit stress curves, based respectively on linear strain and linear stress paths, are reduced to a single curve, which defines the forming limit stress curve (FLSD) for the sheet.
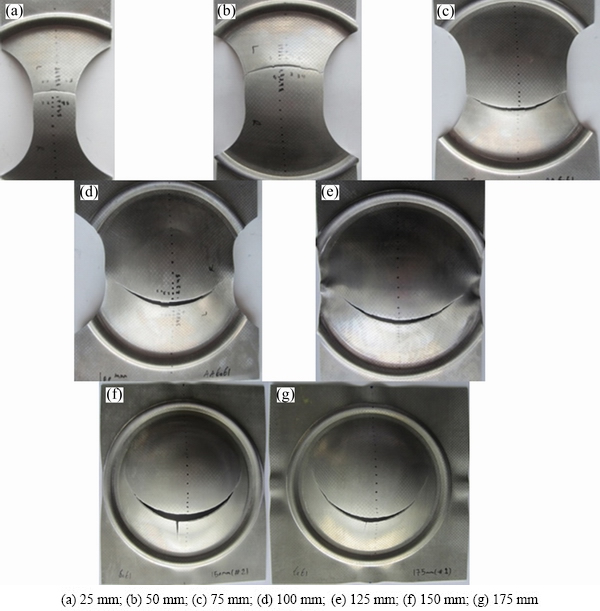
Fig. 9 Comparison of fracture position of experimental samples with different widths
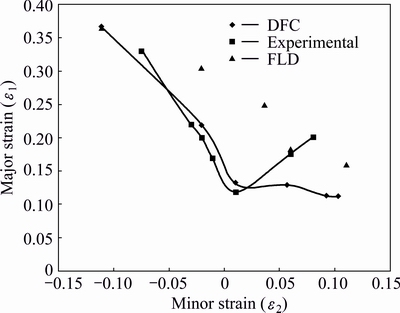
Fig. 10 Numerical and experimental comparison of true strain of aluminum sheet��s FLD
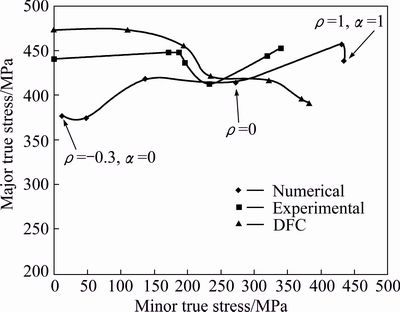
Fig. 11 Comparison for stress of numerical and experimental FLSD of 6061 aluminum sheet
In Fig. 11, three types of FLSD are compared. Experimental and DFC forming limit stress diagram were obtained using forming limit strains of previous section. Numerical FLSD is from the Abaqus software results. As explained in the Section 4.3 of this study, FLSD is one of the available criteria in the Abaqus software. Figure 11 shows that FLSD which was obtained by the forming limit strains of ductile fracture criterion has good agreement with experimental results. Although, numerical FLSD is a little far from experimental result, its prediction is in the safe region and is more reliable than FLSD of ductile fracture criterion.
Although numerical results of Abaqus software are not useful for FLD prediction of aluminum alloy 6061 (FLD in Fig. 10), numerical results of this software have a good accuracy for FLSD prediction.
4 Conclusions
1) Results show that finite element method has a good accuracy for punch��s load-displacement curve.
2) Fracture position of experimental samples shows that frictionless contact between the punch and sheet surface causes more deformation in the contact region. Therefore, fracture happens in this area and near the pole of samples.
3) In this study, two numerical methods of forming limit diagram (FLD) criterion and ductile fracture criterion (DFC) were used to predict the FLD of 6061 aluminum sheet. Comparison of results of these criteria with experiment shows that DFC has a good agreement with experimental results for FLD prediction of 6061 aluminum sheet. Results of this research point out that FLD is in the fracture zone and this criterion is not useful for FLD prediction.
4) Results of this study for FLSD prediction of aluminum alloy 6061 show that forming limit stress of DFC has a good agreement with experimental FLSD. Numerical FLSD which is obtained from the Abaqus results is also near to the experimental FLSD and in the safe zone. Therefore, it is better to use numerical method for FLSD prediction of aluminum alloy 6061 if high safety factor is needed. Although, numerical result of Abaqus software is not useful for FLD prediction of aluminum alloy 6061, it has a good accuracy for FLSD prediction.
References
[1] HAN Heung-Nam, KIM Keun-Hwan. A ductile fracture criterion in sheet metal forming process [J]. Materials Processing Technology, 2003, 142: 231-238.
[2] KEELER S P, BACKOFEN W A. Plastic instability and fracture in sheets stretched over rigid punches [J]. Transactions of the ASM, 1963, 56: 25-48.
[3] GOODWIN G M. Application of strain analysis to sheet metal forming problems in the press shop [J]. SAE Technical Paper, 1968: Paper No.680093.
[4] JAIN M, ALLIN J, LLOYD D J. Fracture limit prediction using ductile fracture criteria for forming of an automotive aluminum sheet [J]. International Journal of Mechanical Sciences, 1999, 41: 1273-1288.
[5] OZTURK F, LEE D. Analysis of forming limits using ductile fracture criteria [J]. Materials Processing Technology, 2004, 147: 397-404.
[6] SAFDARIAN R, JORGE R M N, SANTOS A, NAEINI H M, PARENTE M P L. A comparative study of forming limit diagram prediction of tailor welded blanks [J]. International Journal of Material Forming, 2015, 8: 293-304.
[7] SAFDARIAN K R, MOSLEMI N H, TORKAMANY M J, LIAGHAT G. Experimental and theoretical investigation of thickness ratio effect on the formability of tailor welded blank [J]. Optics & Laser Technology, 2013, 51: 24-31.
[8] SAFDARIAN R. Forming limit diagram prediction of tailor welded blank by modified M-K model [J]. Mechanics Research Communications, 2015, 67: 47-57.
[9]  W, SONNE H. Influence of the strain path on the forming limits of sheet metal [J]. Archive for the Iron and Steel Industry, 1975, 46: 597-602.
[10] HE Min, LI Fu-guo, WANG Zhi-gang. Forming limit stress diagram prediction of aluminum alloy 5052 based on GTN model parameters determined by in situ tensile test [J]. Chinese Journal of Aeronautics, 2011, 24: 378-386.
[11] CHEN M H, GAO L, ZUO D W, WANG M. Application of the forming limit stress diagram to forming limit prediction for the multi-step forming of auto panels [J]. Materials Processing Technology, 2007, 187-188:173-177.
[12] PANICH S, BARLAT F, UTHAISANGSUK V, SURANUNTCHAI S, JIRATHEARANAT S. Experimental and theoretical formability analysis using strain and stress based forming limit diagram for advanced high strength steels [J]. Materials & Design, 2013, 51: 756-766.
[13] ARRIEUX R. Determination and use of the forming limit stress diagrams in sheet metal forming [J]. Journal of Materials Processing Technology, 1995, 53: 47-56.
[14] STOUGHTON T B. A general forming limit criterion for sheet metal forming [J]. International Journal of Mechanical Sciences, 2000, 42: 1-27.
[15] UTHAISANGSUK V, PRAHL U, BLECK W. Stress based failure criterion for formability characterisation of metastable steels [J]. Computational Materials Science, 2007, 39: 43-48.
[16] FANG Gang, LIU Qing-jun, LEI Li-ping, ZENG Pan. Comparative analysis between stress- and strain-based forming limit diagrams for aluminum alloy sheet 1060 [J]. Transactions of Nonferrous Metals Society of China, 2012, 22: 343-349.
[17] ASTM-E8. Metals test methods and analytical procedures [S]. 1999.
[18] HASEK V. Research and theoretical description concerning the influences on the FLDs [J]. Blech Rohre Profile, 1978, 25: 213-220. (in German)
[19] NAKAZIMA K, KIKUMA T, HASUKA K. Study on the formability of steel sheets [J]. YAWATA TECH REP, 1968, 264: 8517-8530.
[20] ABAQUS. ABAQUS analysis user��s manual [M]. V��lizy- Villacoublay: Dassault Systems, 2012.
����Ӧ�����μ���ͼ��6061���Ͻ��������
R. SAFDARIAN
Department of Mechanical Engineering, Behbahan Khatam Alanbia University of Technology, Behbahan, Khoozestan, Iran
ժ Ҫ�����ó��μ���ͼ������Զ�����������ֵ���6061���Ͻ�ij�����������Ԥ�⡣����ֵģ������ʵ�����ó��μ���ͼ�ͳ�ͷ��-λ��ͼ���жԱȡ�����Hecker��Բ�γ�ͷ����ʵ����μ���ͼ����ʵ����μ���ͼת��Ϊ���μ���Ӧ��ͼ������Abaqus�����ж���Ʒ����������Ԥ�⡣�����μ���Ӧ��ͼԤ������ʵ�����ó��μ���Ӧ��ͼ���бȽϡ�������������Զ������6061���Ͻ���μ���ͼ�ͳ��μ���Ӧ��ͼ��Ԥ�⾫�Ƚϸߡ���ͷ����-λ��ͼģ������ʵ�����Աȱ���ģ������ʵ�����Ǻϡ�
�ؼ��ʣ�6061���Ͻ𣻳��μ���ͼ�����μ���Ӧ��ͼ�����Զ���������Ԫ����
(Edited by Yun-bin HE)
Corresponding author: R. SAFDARIAN; Tel: +98-6712221191; E-mail: safdarian@bkatu.ac.ir
DOI: 10.1016/S1003-6326(16)64350-9
Abstract: Two numerical criteria of forming limit diagram (FLD) criterion and ductile fracture criterion (DFC) are presented for FLD prediction of 6061 aluminum. The numerical results are compared with the experimental FLD and also punch��s load-displacement curve of experimental samples. Experimental FLD of this study is calculated using hemispherical punch test of Hecker. Experimental FLD is converted to FLSD and imported to the Abaqus software to predict necking of samples. Numerical results for FLSD prediction were compared with experimental FLSD. Results show that ductile fracture criterion has higher accuracy for FLD and FLSD prediction of 6061 aluminum. Comparison of numerical and experimental results for force-displacement curve of punch shows that numerical results have a good agreement with experiment.
