
Trans. Nonferrous Met. Soc. China 23(2013) 548-555
Response surface optimization of process parameters for reduction roasting of low-grade pyrolusite by bagasse
Ke-di YANG1, Xian-jia YE1, Jing SU1, Hai-feng SU1, Yun-fei LONG1, Xiao-yan  2, Yan-xuan WEN1
1. School of Chemistry and Chemical Engineering, Guangxi University, Nanning 530004, China;
2. Educational Administration Department, Guangxi University, Nanning 530004, China
Received 8 October 2011; accepted 9 April 2012
Abstract:
The reduction roasting processes for low-grade pyrolusite using bagasse as the reducing agent was statistically analyzed. The central composite rotatable design (CCD) was used to optimize this reduction roasting processes. The three process parameters studied were the mass ratio of bagasse to ore, the roasting temperature and the roasting time. Analysis of variance (ANOVA) was used to analyze the experimental results. The interactions between the process parameters were done by using the linear and quadratic model. The results revealed that the linear and quadratic effects as well as the interaction are statistically significant for the mass ratio and roasting temperature but insignificant for the roasting time. The optimal conditions of 0.9:10 of mass ratio, the roasting temperature of 450 ��C, the roasting time of 30 min were obtained. Under these conditions, the predicted leaching recovery rate for manganese was 98.1%. And the satisfied experimental result of 98.2% confirmed the validity of the model.
Key words:
pyrolusite; reduction roasting; bagasse; response surface methodology;
1 Introduction
Manganese is a strategic element that has several important industrial applications such as steel production, carbon-zinc batteries production, as well as fertilizers, colorants and medicines. The world rapidly growing demand for manganese and the gradual depletion of high grade manganese ore have made it increasingly important to develop processes for economical recovery of manganese from low-grade pyrolusite [1]. The extraction of manganese from pyrolusite must be carried out by reducing process because manganese dioxide is stable both in acid and alkaline oxidizing conditions [2]. However, the conventional roasting reduction-leaching method using coal as reducing agent requires a high reaction temperature of 800 ��C and leads to pollution and greenhouse gas emissions [3]. There have also been reports of new kinds of reducing agents, such as carbohydrates and biomass from agricultural waste [4-7]. CHENG et al [8] indicated that low-grade manganese dioxide ores can be fully reduced with biomass cornstalk at 500 ��C with cornstalk to ore mass ratio of 3:10 in air. ZHAO et al [9] found that manganese oxide ore can be reduced largely by roasting with biomass straw, which is a renewable biomass resource at temperatures below 650 ��C.
Recently, our research group found that low-grade pyrolusite also can be reduced completely with bagasse at 500 ��C, which is an abundant and renewable biomass resource coming from the sugarcane juice extraction [10]. In 2010, the total output of sugarcane bagasse in China was more than 15 million tons. Furthermore, carbon emissions from bagasse utilization have the same value as carbon fixed through photosynthesis by the plant, thus the overall net carbon emissions from biomass utilization makes no addition to greenhouse gases. Therefore, making use of bagasse to reduce pyrolusite can not only lower the cost, but also comply with the requirements of green economy.
CHENG et al [8], ZHAO et al [9] and our former research showed that the mass ratio of biomass to manganese ore, the roasting temperature and the roasting time are key factors of the reduction roasting process. These parameters have been investigated previously by the one variable at a time approach (OVAT), which changes the level of one factor at a time, while keeping the value of the other factors constant. This approach is not only time- and work-demanding, but also completely omits any effects of the interaction between different factors. In order to solve these problems, it is necessary to use a multivariate statistical technique to optimize the reduction roasting process. Response surface methodology (RSM) can analyze multiple parameters and their interactions based on statistically-based optimization strategy [11-13]. It has been proven to be a powerful statistical tool in the process optimization [14-19]. However, RSM approach has not been used to optimize the reduction roasting process of low-grade pyrolusite with bagasse.
In the present work, the reduction roasting process of low-grade pyrolusite using bagasse as a reducing agent was investigated. The mass ratio of bagasse to ore, roasting temperature and roasting time were selected as the three influencing factors, and leaching recovery rate of manganese was the response. RSM based on the central composite design (CCD) was employed to determine the optimal conditions and a quadratic model correlating the leaching recovery to the three variables was then developed.
2 Experimental
2.1 Materials
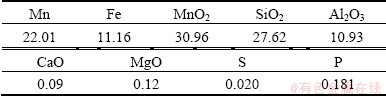
The sample of pyrolusite ore obtained from Mugui manganese mine, Guangxi, China, was crushed, ground and sieved to provide raw material with particle size ranging from 109 ��m to 150 ��m. The chemical composition of the manganese ore is given in Table 1.
Table 1 Chemical composition of manganese ore sample (mass fraction, %)
The bagasse was supplied by Nanning sugarcane refinery in Guangxi, China. Before the experiments, it was pulverized to be powder-like with a particle size about 0.178 mm. The analysis of the bagasse is shown in Table 2.
Table 2 Analysis of bagasse sample

2.2 Experimental procedure
The pyrolusite and bagasse were completely mixed in a crucible and roasted in a tube furnace under oxygen-free conditions. Before roasting, the tube furnace was purged with a flow of nitrogen gas to remove air. After roasting was completed, the roasted product was cooled to room temperature in inert gas and leached in 3 mol/L sulfuric acid solution with stirring speed of 100 r/min at 50 ��C for 40 min. The leaching recovery of manganese was calculated by the determination of its concentration in the filtrate and the residue using titration with ferrous ammonium sulfate as GB/T 1506��2002.
2.3 Analysis method
Based on previous work [8,9], three reaction factors, namely the mass ratio of bagasse to manganese ore (X1, g/g), roasting temperature(X2, ��C), and roasting time (X3, min) are considered independent variables. The dependent variables are the leaching recovery rate of manganese (Y, %).
RSM is an empirical statistical technique employed for multiple regression analysis by using quantitative data obtained from properly designed experiments to solve multivariate equations simultaneously [11-16]. In this work, RSM is used to assess the relationship between the response (Y) and the independent variables, as well as to optimize the relevant variables in order to predict the best value for the response.
The central composite rotatable design (CCD) is the most widely used RSM approach. According to GUVEN et al [12], CCD is an effective design for sequential experimentation since it allows reasonable amount of information to test the lack-of-fit with a sufficient number of experimental values. Therefore, CCD has been employed to determine the effect of operational variables on the leaching recovery rate of manganese. The three-factor layout of the CCD is shown in Fig. 1.
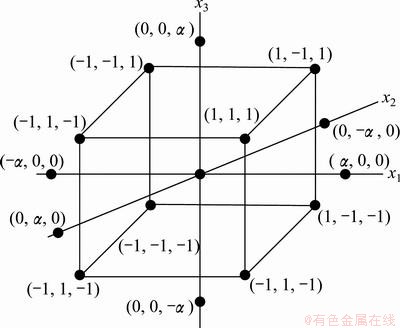
Fig. 1 Central composite design for three factors
By defining the distance from the center of the design space to a factorial point as ��1 unit for each factor, the distance from the center to axial (star) points is ���� (|��|>1) [11,13]. It is composed of a core factorial that forms a cube with sides that are two coded units in length (from -1 to +1 as noted in Fig. 1).
Table 3 Levels of independent variables for CCD
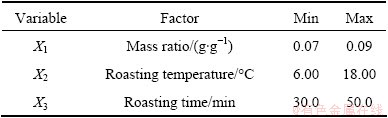
Table 4 Coded variables and actual variables for CCD

The coded variables (x) and actual variables (X) for CCD are shown in Table 3 and Table 4. The relationship between the coded variables and actual variables can be expressed as follows [11]:

 (1)
(1)
Each numerical factor is varied over 5 levels in the determined ranges, based on preliminary experiments. The conventional choice for the CCD is to execute a rotatable design with the axial points at |��|=1.682 coded units from the center. As a result, the total number of experiments in this design is calculated as 20 (2k+2k+6, where k is the number of factors, and k=3). Meanwhile, 8 factorial points, 6 axial points and 6 replications of the central points are added to check the degree of fitting of the model.
The leaching rate recovery (Y, %), influenced by three independent variables, was set as the desired goal (response) through fitting a second-order polynomial regression model:
 (2)
(2)
where y is the predicted response of Y or R; ��0 is the coefficient for the intercept; ��i is the coefficient of linear effect; ��ii is the coefficient of quadratic effect; ��ij is the coefficient of interactive effect; e is a term representing other sources of variability not accounted by the response function; xi and xj are coded independent variables. The quality of the fitness of polynomial model is expressed by the value of correlation coefficient (R2). The main indicators demonstrating the significance and adequacy of the model include the F-value (Fisher variation ratio), p-value (probability value), and adequate precision [11]. The consideration of multiple responses involves the initial creation of suitable response surface model and subsequent identification for the operational conditions that maximize targeted response or maintenance of those in the most desired ranges [11].
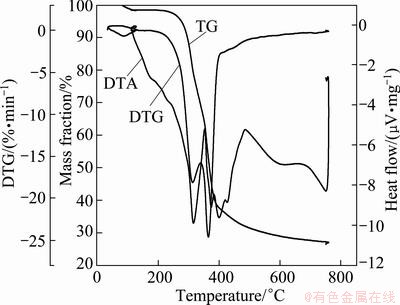
Fig. 2 Thermal analysis of bagasse in N2
3 Results and discussion
3.1 Chemistry of roasting reduction
As seen in Fig. 2, the reducing gas CO was produced by the pyrolysis of bagasse during the roasting under oxygen-free conditions [20,21].
CxHyOz�� CO+H2O (3)
The reducing gas produced in the pyrolysis provides a reducing atmosphere, which promotes the reduction of pyrolusite. The oxides of manganese are reduced from high valent state to low valent state (Fig. 3) [1,22,23]:
MnO2��Mn2O3��Mn3O4��MnO (4)
The chemical reactions involved in the reducing process are
MnO2+CO��Mn2O3+CO2 (5)
Mn2O3+CO��Mn3O4+CO2 (6)
Mn3O4+CO��MnO+CO2 (7)
The overall reduction reaction can be expressed as follows:
CxHyOz+MnO2 ��MnO+CO2 +H2O (8)
3.2 Response analysis and interpretation
A total of 20 runs of the CCD experiment responses are shown in Table 5. The leaching recovery varied between 90.0% and 99.1%.

Fig. 3 XRD patterns of pyrolusite sample (a) and its roasted product (b)
Further numerical analysis of the response results (Table 5) is shown in Table 6. The cubic model is not considered to fit the response since the central composite design cannot support a full cubic model and not all the cubic model parameters can be uniquely estimated. Instead, according to the sequential model sum of squares and lack of fit tests, the model with the highest order polynomial is selected, if the additional terms are significant and the model is not aliased and has insignificant lack-of-fit. The lack of fit error is significantly larger than the pure error, indicating that something remaining in the residuals can be removed by a more appropriate model. In addition, a significant lack of fit (Prob.>F value 0.10 or smaller) indicates that the model cannot be used to predict the response. Since a lack of fit is not desirable, a small F value and probability greater than 0.1 are needed. In this work, the Quadratic model produces a lack of fit F value of 0.890 with p-value of 0.9788, and the Prob. value for the Quadratic terms and the linear terms are less than 0.0001 and 0.1, respectively. These results mean the Quadratic model is suitable to the selected response.
Table 5 Central composite design arrangement and results
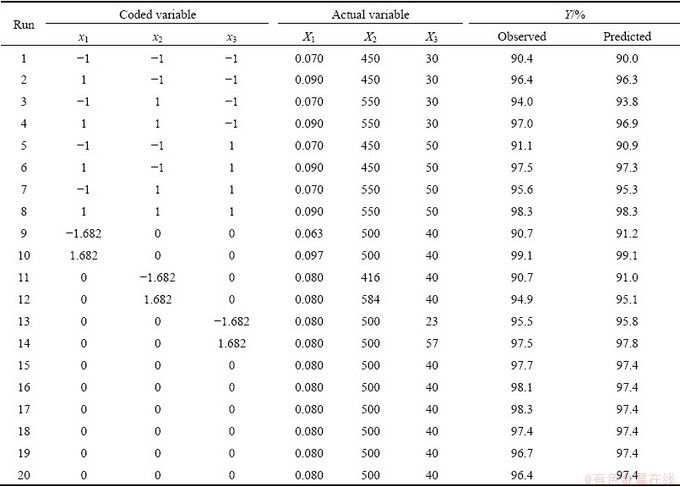
Table 6 Model fitting for designed experiments

Table 7 Analysis of variance for response surface quadratic model
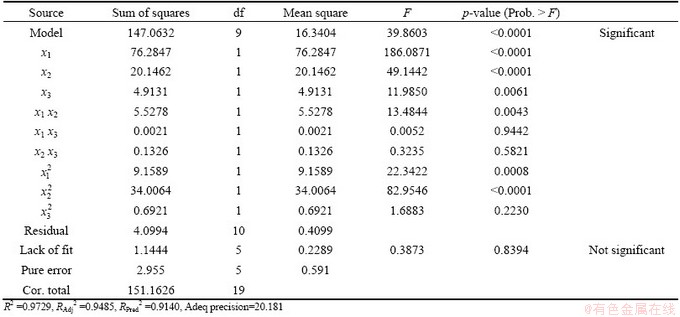
The ANOVA result of the quadratic model for the leaching recovery rate is listed in Table 7. The model F-value of 39.86 implies that the model is significant. There is only a 0.01% chance that this large model F-value could occur by chance. Values of ����Prob. >F �� of less than 0.050 indicate that the model terms are significant [11]. In this case, x1, x2, x3, x1x2,  and
and  are the significant model terms. That is, among the three independent variables tested, the mass ratio (p<0.0001) and roasting temperature (p<0.0001) have significant linear effects as well as their quadratic effects on the leaching recovery. The roasting time also shows a negative quadratic effect on the leaching recovery, with a relatively smaller linear impact. The ��lack of fit F-value�� of 0.39 implies that the lack of fit is not significant relatively to the pure error. There is a 83.94% chance that a ��lack of fit F-value�� could occur by chance. The ��RPred2�� of 0.9140 is in reasonable agreement with the value ��RPred2�� of 0.9485.
According to MYERS et al [11], for a good fitness of a model, the correlation coefficient should be at least 0.80. The ��Pred R-squared�� of 0.94 is in reasonable agreement with the ��Adj R-squared�� of 0.95. ��Adeq precision�� measures the signal to noise ratio. A ratio greater than 4 is desirable so the ratio of 25.380 indicates an adequate signal. Hence, the model can be used to navigate the design space.
The constants and coefficients were obtained by fitting the data listed in Table 6 into Eq. (2) and are shown in Table 8. The equation in terms of coded factors is obtained.
Y=97.40+2.36x1+1.21x2+0.6x3-0.83x1x2+0.016x1x3+0.13x2x3-0.80-1.54-0.22 (9)
(9)
It is important to confirm that the selected model provides an adequate approximation to the real system. By using the diagnostic plots, including normal probability vs. studentized residuals and the predicted vs. actual value, the model adequacy can be judged [11,19].
Figure 4 shows the normal probability plots of the studentized residuals for the initial discharge capacity. The normal probability plot indicates that the residuals follow a normal distribution, and the points follow a straight line, verifying that the model is valid and plausibly fits the experimental data.
As seen in Fig. 5, the actual response values are the experimental data for a particular run, and the predicted response values are evaluated by the approximating functions. The predicted values are in good agreement with the experimental values, indicating that the model is valid and successfully fits the experimental data.

Fig. 4 Normal probability plot of studentized

Fig. 5 Linear correlation between actual and predicted leaching ratios of Mn
Table 8 Regression coefficients for refitted model

3.3 Response surfaces
To achieve better understanding of the interactions of the variables and to determine the optimum level of each variable for the maximum leaching recovery rate of manganese, three-dimensional response surfaces plots of the relationship between x2 and x3, x1 and x3, x1 and x2 were calculated and are illustrated in Fig. 6. The values of x1, x2 and x3 were held constant at their average values. The figures are constructed to assess the interactive relationships between the independent variables and the response.
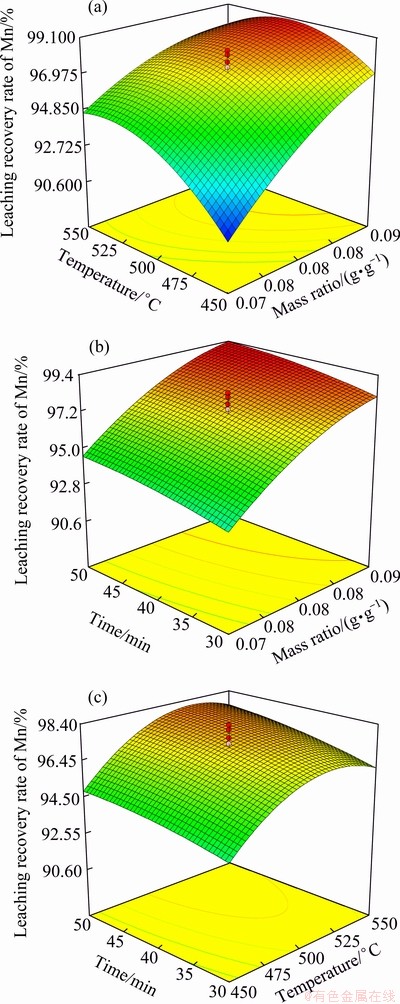
Fig. 6 Response surface plots for mass ratio vs roasting temperature (a), mass ratio vs roasting time (b) and roasting temperature vs roasting time(c)
Figure 6(a) shows the leaching recovery rate of mangnese as a function of the mass ratio and roasting temperature, while the roasting time keeps constant (40 min). The mass ratio has a significant positive effect on the leaching recovery. The leaching recovery rate increased quickly as the mass ratio increased. This can be easily explained by the fact that the amount of reducing gases increased with the increase of the mass ratio. However, the leaching recovery rate only slightly increased when mass ratio increased to 0.08.
As shown in Fig. 6(b), the leaching recovery rate increased with the increased roasting time, but compared with mass ratio, the roasting time has a smaller effect on the leaching recovery rate. This means that the roasting time has a weaker effect on the leaching recovery rate.
Figure 6(c) shows the effect of the roasting time and the roasting temperature on the leaching recovery rate for a constant mass ratio. It can be seen that the leaching recovery rate depends significantly on the roasting temperature, first increasing and then decreasing with the increase of roasting temperature. This decrease may be explained since at high temperatures other metal oxides (such as Fe2O3) can be reduced to a lower valent state and deplete some of the reducing gases.
3.4 Determination of optimum conditions
The aim of this study is to investigate the values of the three operational parameters (mass ratio, roasting temperature and roasting time) that maximize the leaching recovery rate, using response surface analysis. As the fitted model, Eq. (3) was checked for adequacy of fitness in the region defined by the coordinates of the design and was found to be adequate. The model was used to locate the coordinates of the stationary point [11]. Accordingly, the fitted model can be used to optimize and maximize the leaching recovery rate of manganese within the experimental range studied. The optimum levels of variables are found to be a mass ratio of 0.09, roasting temperature of 450 ��C and roasting time of 30 min with a prediction of 98.1% for the leaching recovery rate of manganese. In order to test the validity of the optimum condition achieved by the empirical model, a confirmatory experiment was carried out using these optimal levels. The actual experimental datum is 98.2% while the predicted value is 98.1%. As a result, the model from response surface methodology is considered to be accurate and reliable for predicting the leaching recovery rate of manganese.
4 Conclusions
Response surface methodology successfully applied for the reduction roasting of low-grade manganese dioxide ore by bagasse. According to the satisfied second-order polynomial equation, the optimal condition was determined as bagasse to manganese ore mass ratio of 0.9:10, roasting time of 30 min at 450 ��C. Under the optimum conditions, the predicted leaching recovery rate of manganese is 98.1%, confirmed by the experiment as 98.2%. The demonstration of the response surface methodology can be applied to the optimization of the reduction roasting process for low-grade pyrolusite by bagasse under oxygen-free conditions efficiently.
References
[1] ZHANG W, CHENG C Y. Manganese metallurgy review. Part I: Leaching of ores/secondary materials and recovery of electrolytic/chemical manganese dioxide [J]. Hydrometallurgy, 2007, 89(3-4): 137-159.
[2] LI T Q. Technology of low grade pyrolusite ore reduction process and recent advances [J]. China��s Manganese Industry, 2008, 56(2): 4-14. (in Chinese)
[3] SAHOO P K, RAO K S. Sulphating-roasting of low grade manganese ore: Optimization by factorial design [J]. International Journal of Mineral Processing, 1989, 25(1-2): 147-152.
[4] ACHARYA C, KAR R N. Studies on reaction mechanism of bioleaching of manganese ore [J]. Minerals Engineering, 2003, 16(10): 1027-1030.
[5] ABBRUZZESE C. Percolation leaching of manganese ore by aqueous sulfur dioxide [J]. Hydrometallurgy, 1990, 25(1): 85-97.
[6] ISMAIL A A, ALI E A, IBRAHIM I A, AHMED M S. A comparative study on acid leaching of low grade manganese ore using some industrial wastes as reductants [J]. The Canadian Journal of Chemical Engineering, 2004, 82(6): 1296-1300.
[7] JIANG T, YANG Y B, HUANG Z C, QIU G Z. Simultaneous leaching of manganese and silver from manganese-silver ores at room temperature [J]. Hydrometallurgy, 2003, 69(1-3): 177-186.
[8] CHENG Z, ZHU G C, ZHAO Y N. Study in reduction-roast leaching manganese from low-grade manganese dioxide ores using cornstalk as reductant [J]. Hydrometallurgy, 2009, 96(1-2): 176-179.
[9] ZHAO Y N, ZHU G C, CHENG Z. Thermal analysis and kinetic modeling of manganese oxide ore reduction using biomass straw as reductant [J]. Hydrometallurgy, 2010, 105(1-2): 96-102.
[10] BATRA V S, URBONAITE S, SVENSSON G. Characterization of unburned carbon in bagasse fly ash [J]. Fuel, 2008, 87(13-14): 2972-2976.
[11] MYERS R H, MONTGOMERY D C, ADWESON-COOK C M. Response surface methodology: Process and product optimization using designed experiments [M]. New York: John Wiley and Sons, Inc, 2008.
[12] GUVEN G, PERENDECI A, TANYOLAC A. Electrochemical treatment of deproteinated whey wastewater and optimization of treatment conditions with response surface methodology [J]. Journal of Hazardous Material, 2008, 157(1): 69-78.
[13] BASHIR M J K, AZIZ H A, YUSOFF M S, ADLAN M N. Application of response surface methodology (RSM) for optimization of ammoniacal nitrogen removal from semi-aerobic landfill leachate using ion exchange resin [J]. Desalination, 2010, 254(1-3): 154-161.
[14] DANH L T, MAMMUCARI R, TRUONG P, FOSTER N. Response surface method applied to supercritical carbon dioxide extraction of Vetiveria zizanioides essential oil [J]. Chemical Engineering Journal, 2009, 155(3): 617-626.
[15] TANG Q H, LAU Y B, HU S Q, YAN W J, YANG Y H, CHEN T. Response surface methodology using Gaussian processes: Towards optimizing the transstilbene epoxidation over Co2+�CNaX catalysts [J]. Chemical Engineering Journal, 2010, 156(2): 423-431.
[16] CHONG M N, ZHU H Y, JIN B. Response surface optimization of photocatalytic process for degradation of Congo red using H-titanate nanofiber catalyst [J]. Chemical Engineering Journal, 2010, 156(2): 278-285.
[17] HAMZAOU A H, JAMOUSSI B, MINIF A. Lithium recovery from highly concentrated solutions: Response surface methodology (RSM) process parameters optimization [J]. Hydrometallurgy, 2008, 90(1): 1-7.
[18] GEOFFREY S S, SEHLISELO N, MARIEKIE G B. Leaching of nickel laterites using chemolithotrophic microorganisms: Process optimisation using response surface methodology and central composite rotatable design [J]. Hydrometallurgy, 2009, 98(3-4) 241-246.
[19] JOGLEKAR A M, MAY A T. Product excellence through design of experiments [J]. Cereal Foods World, 1987, 32(12): 857-868.
[20] FUSHIMI C, ARAKI K, YAMAGUCHI Y, TSUTSUMI A. Effect of heating rate on steam gasification of biomass. 2. Thermo- gravimetric-mass spectrometric (TG-MS) analysis of gas evolution [J]. Industrial and Engineering Chemistry Research, 2003, 42(17): 3929-3936.
[21] ZHANG M, YUAN Y C, LIU Y Z. Research on biomass waste combustion technologies [J]. Energy Research and Information, 2005, 21(1): 5-10.
[22] REN Sheng-jie. Industrial minerals resource exploitation and processing handbook [M]. Wuhan: Wuhan Industry University Press, 1993. (in Chinese)
[23] MOMADE F W Y, MOMADE Z G. A study of the kinetics of reductive leaching of manganese oxide ore in aqueous methanol-sulphuric acid medium [J]. Hydrometallurgy, 1999, 54(1): 25-39.
��Ӧ���Ż��������ջ�ԭ��Ʒλ���̿�Ĺ���
��˵�1, Ҷ�Լ�1, �� ��1, �ں���1, ���Ʒ�1, ��С��2, ������1
1. ������ѧ ��ѧ����ѧԺ������ 530004��
2. ������ѧ �������� 530004
ժ Ҫ�����û���ͳ�Ƶ��Ż������Ż��������������������ջ�ԭ��Ʒλ���̿�Ĺ��ա��������������ռ�ʵ�����ݣ��ö���ģ�ͱ�ʾ�̽������������(�������̿�������)�������¶ȡ�����ʱ��ĺ�����ϵ����ͳ�Ʒ��� (ANOVA) �о�����������������öԽ������̵�Ӱ�졣�������������Ⱥͱ����¶ȶԽ������̵�Ӱ��ȱ���ʱ��Ĵ�����Ⱥͱ����¶ȵ������������佻������Ӱ��������������ʱ���Ӱ��ȴ��С���������õĶ���ģ�Ϳɵ���ѹ��ղ����������0.9:10 �������¶�450 ��C������ʱ�� 30 min�����Ż������£��̽����ʵ�Ԥ��ֵΪ98.1%��ʵ��ֵΪ98.2%.
�ؼ��ʣ����̿��ջ�ԭ����������Ӧ�淽��
(Edited by Hua YANG)
Foundation item: Projects (20866001, 21166003, 51164002) supported by the National Natural Science Foundation of China; Project (20114501110004) supported by the Ph.D. Programs Foundation of Ministry of Education of China
Corresponding author: Yan-xuan WEN; Tel: +86-771-3233728(O); Fax: +86-771-3233718; E-mail: wenyanxuan@vip.163.com
DOI: 10.1016/S1003-6326(13)62498-X
Abstract: The reduction roasting processes for low-grade pyrolusite using bagasse as the reducing agent was statistically analyzed. The central composite rotatable design (CCD) was used to optimize this reduction roasting processes. The three process parameters studied were the mass ratio of bagasse to ore, the roasting temperature and the roasting time. Analysis of variance (ANOVA) was used to analyze the experimental results. The interactions between the process parameters were done by using the linear and quadratic model. The results revealed that the linear and quadratic effects as well as the interaction are statistically significant for the mass ratio and roasting temperature but insignificant for the roasting time. The optimal conditions of 0.9:10 of mass ratio, the roasting temperature of 450 ��C, the roasting time of 30 min were obtained. Under these conditions, the predicted leaching recovery rate for manganese was 98.1%. And the satisfied experimental result of 98.2% confirmed the validity of the model.
