
Trans. Nonferrous Met. Soc. China 23(2013) 219-230
Bio-dissolution of Cu, Mo and Re from molybdenite concentrate using mix mesophilic microorganism in shake flask
H. ABDOLLAHI1, S. Z. SHAFAEI1, M. NOAPARAST1, Z. MANAFI2, N. ASLAN3
1. School of Mining, College of Engineering, University of Tehran, Tehran, Iran;
2. National Iranian Copper Industries Co. Sarcheshmeh Mine, Iran;
3. Mining Engineering Department, Cumhuriyet University, Sivas, Turkey
Received 18 January 2012; accepted 2 July 2012
Abstract:
The application of the response surface methodology and the central composite design (CCD) technique for modeling and optimization of the influence of some operating variables on copper, molybdenum and rhenium recoveries in a bioleaching process was investigated. Three main bioleaching parameters, namely pH, solid concentration and inoculum percent, were changed during the bioleaching tests based on CCD. The ranges of the bioleaching process variables used in the design were as follows: pH 1.46-2.14, solid concentration 0.95%-11.05%, and inoculum percent 1.59%�C18.41%. A total of 20 bioleaching tests were carried out by the CCD method according to software-based designed matrix. Empirical model equations were developed according to the copper, molybdenum and rhenium recoveries obtained with these three parameters. Model equations of responses at the base of parameters were achieved by using statistical software. The model equations were then individually optimized by using quadratic programming to maximize copper, molybdenum and rhenium recoveries individually within the experimental range. The optimum conditions for copper recovery were pH 1.68, solid concentration 0.95% and the inoculum 18.41% (v/v), while molybdenum and rhenium recoveries were 2.18% and 24.41%, respectively. The predicted values for copper, molybdenum and rhenium recoveries were found to be in good agreement with the experimental values. Also jarosite formation during bioleaching tests was also investigated.
Key words:
bioleaching; molybdenite concentrate; copper; molybdenum; rhenium; mix mesophilic microorganisms; response surface methodology; CCD;
1 Introduction
The bioleaching process involves extraction of useful elements from ores by bacteria and solution. The six steps during bioleaching are outer diffusion, inner diffusion, leaching reaction, the process of precipitation and hydrolysis of the element, transportation of microorganisms, and heating and cooling of the bed [1]. Initially, a model involving two mechanisms was proposed to explain the microbial oxidation of sulfide minerals. Microorganisms can oxidize metal sulfides via a direct mechanism where electrons are obtained directly from the reduced elements. In this case, cells have to be attached in close contact to the mineral surface. The adsorption of cells to suspended mineral particles takes place within minutes or hours. Alternatively, in the ��indirect�� mechanism, the oxidation of metal sulfides is mediated by ferric ions, being formed by microbial oxidation of ferrous ions present in the solution. Ferric ions act as an oxidant and can oxidize metal sulfides and are reduced to ferrous ions which are microbially re-oxidized. In this case iron acts as an electron carrier. It was proposed that no direct physical contact is needed for the oxidation of iron [2].
Under acidic conditions metals are extracted from sulfidic minerals by Fe3+ oxidation of the metal sulfide bond (Eq. (1)), using chalcopyrite as an example. Acidophilic microorganisms catalyze metal dissolution by oxidizing Fe2+ to Fe3+, thereby gaining energy (Eq. (2)). The sulfur (S0) is also metabolized by acidophilic microorganisms to sulfate as the final product (Eq. (3)) [3,4].
 (1)
(1)
 (2)
(2)
 (3)
(3)
For example, chalcopyrite (CuFeS2) is the most important copper mineral in the world. Unlike many other ores, chalcopyrite is recalcitrant to hydrometallurgical processes. Researchers have been striving for decades to accelerate chalcopyrite bioleaching. The selection of suitable microorganisms is an important factor [5]. The slow dissolution rate of chalcopyrite is the main factor hindering the commercial application of bioleaching, because polysulphides, elemental sulfur and/or iron-hydroxy precipitate layers form on the surface of chalcopyrite, restricting the flow of bacteria, nutrients, oxidants, and reaction products to and from the chalcopyrite surface [6].
Bioleaching of sulphide minerals is a complex natural process with a number of factors including pH, temperature, redox potential, pulp density, particle size, availability of nutrients, O2 and CO2, redox potential, presence of toxic elements etc controlling the activity of bacteria and the chemistry of dissolution process [7]. The oxidation-reduction potential (ORP) of the leaching medium strongly affects the leaching kinetics of sulfide minerals such as chalcopyrite and molybdenite. Chalcopyrite has been shown to dissolve at much higher rates at ORP values less than the critical value of about 450 mV, but molybdenite is more readily dissolved at ORP values greater than 750 mV (vs Ag/AgCl). Another important factor in bioleaching is pH. The leaching of chalcopyrite and other sulfide minerals is an acid consuming reaction. Thus, as leaching progresses, the pH increases. One consequence of the increased pH is the precipitation of ferric ion salts such as jarosite. Therefore, a lower pH might be expected to result in higher yields because of less jarosite precipitation [8].
Molybdenite (MoS2) is the main source of molybdenum and rhenium. Generally, molybdenite, which is frequently associated with copper sulphides, is a by-product in copper mining and is obtained from flotation processes in which high dosages of sodium sulfide and sodium cyanide are widely used. The presence of chalcopyrite in a molybdenite concentrate drastically reduces its market value. Molybdenite concentrate should have less than 0.5% copper in order to meet consumer requirements. Because of the environmental problems with these processes, an alternative approach to copper removal from molybdenite concentrates, the use of bioleaching, has been considered. ROMANO et al [9] showed that chalcopyrite dissolution of up to 50% could be achieved with mesophiles after three weeks of treatment. Molybdenite dissolution was very low for all bioleaching tests without any iron sources for increasing ORP of the solution. These results are closely related to the oxidizing potential reached during the tests [9]. ASKARI ZAMANI et al [10] showed that up to 65% of copper content of molybdenite concentrate was removed via bioleaching with a native strain of A. ferrooxidans in less than 15 d. Ferrous sulfate, sulfur or pyrite were added to culture medium to enhance the activity of bacteria. Sulfur was the preferred additional source of energy for removing copper from molybdenite via bioleaching with A. ferrooxidans. The experiments showed that the use of Norris medium was better than 9K medium for the removal of copper from molybdenite via bioleaching [10].
The aim of the present work was to examine the dissolution of copper, molybdenum and rhenium during bioleaching of molybdenite concentrate from the Sarcheshmeh Copper Mine using a mixed culture of native mesophilic microorganisms under the conditions of higher ORP. Thereafter, the experiments were carried out in shake flasks to determine the effects of the variables: initial pH, solid concentration, and inoculum percent (v/v) on the dissolution of copper, molybdenum and rhenium from the molybdenite concentrate.
2 Experimental
2.1 Response surface methodology
Response surface methodology (RSM) is a collection of statistical and mathematical methods that are useful for modeling and analyzing engineering process. In this technique, the main objective is to optimize the response surface that is influenced by various process parameters. RSM also quantifies the relationship between the controllable input parameters and the obtained response surfaces. The design procedure of RSM is as follows [11-16]:
1) Designing a series of experiments for adequate and reliable measurement of the response of interest.
2) Developing a mathematical model of the second-order response surface with the best fits.
3) Finding the optimal set of experimental parameters that produces maximum or minimum value of response.
4) Representing the direct and interactive effects of process parameters through 2D and 3D plots.
If all variables are assumed to be measurable, the response surface can be expressed as follows [16-18]:
 (4)
(4)
where y is the answer of the system, and xi are the variables of action called factors. The goal is to optimize the response variable (y). It is assumed that the variables are independent and continuous and controllable by experiments with negligible errors. It is required to find a suitable approximation for the true functional relationship between independent variables and the response surface. Usually, a second-order model is utilized in RSM as follows:
 (5)
(5)
where x1, x2,��, xk are the input factors that influence the response y; ��0, ��ii (i=1, 2,��, k), ��ij (i=1, 2, ��, k; j=1, 2, ��, k) are unknown parameters and �� is a random error. The coefficients ��, which should be determined in the second-order model, are obtained by the least square method. In general, Eq. (5) can be written in matrix form as [17-19]
 (6)
(6)
where Y is defined to be a matrix of measured values, X is a matrix of independent variables; b and �� are coefficients and errors, respectively. The solution of Eq. (6) can be obtained by the matrix approach [17-19].
 (7)
(7)
where X' is the transpose of the matrix X and (X'X)-1 is the inverse of the matrix X'X.
2.2 Central composite rotatable design (CCRD)
The experimental design techniques commonly used for process analysis and modeling are the full factorial, partial factorial and central composite rotatable designs. A full factorial design requires at least three levels per variable to estimate the coefficients of the quadratic terms in the response model. A partial factorial design requires fewer experiments than the full factorial design. However, the former is particularly useful if certain variables are already known to show no interaction [20,21]. An effective alternative to factorial design is central composite rotatable design (CCRD), originally developed by BOX and WILSON [22] and improved upon by BOX and HUNTER [23]. CCRD gives almost as much information as a three-level factorial, requires far fewer tests than the full factorial design and has been shown to be sufficient to describe the majority of steady-state process responses [20,24,25]. Hence, in this study, it was decided to use CCRD to design the experiments. The number of tests required for CCRD includes the standard 2k factorial with its origin at the center, 2k points fixed axially at a distance, say ��, from the center to generate the quadratic terms, and replicate tests at the center; where k is the number of variables. The axial points are chosen such that they allow rotatability [23], which ensures that the variance of the model prediction is constant at all points equidistant from the design center. Replicates of the test at the center are very important as they provide an independent estimate of the experimental error. Once the desired ranges of values of the variables are defined, they are coded to lie at ��1 for the factorial points, 0 for the center points and ���� for the axial points. The codes are calculated as functions of the range of interest of each factor as shown in Table 1 [18,26].
Table 1 Relationship between coded and actual values of variable

2.3 Concentrate preparation and characterization studies
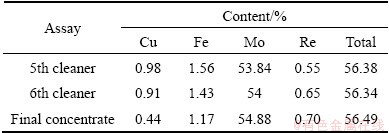
A representative sample of molybdenite concentrate from the Sarcheshmeh Copper Mine with a size distribution of 90% less than 38 ��m was used for bioleaching tests. The Syclosizer analysis was performed with 50 g of the sample at 1100 Pa water pressure in 20 min. After applying the trend line with 0.9856 correlation coefficient on the cumulative pass percent versus size, d80=33 ��m was obtained. Separation of molybdenite from copper bearing minerals was carried out using a rougher and seven sequential flotation cells as cleaner in four series bank with capacity of approximately 20 t/d (final concentrate). The chemical analyses of the 5th, 6th and final concentrate are given in Table 2. As can be seen, there is 0.98% copper in the 5th cleaner sample, which shows the highest grade of copper content in the three cleaners. Therefore, the 5th cleaner sample was used in the bioleaching experiments. Also the rhenium content of the 5th cleaner was measured to be 0.55%.
Table 2 Mineralogical and chemical analyses of molybdenite concentrate in three cleaner stages
Semi-quantitative X-ray diffraction (SQXRD) technique was used to define the main and trace minerals in the sample. The results of the mineralogical studies revealed molybdenite (MoS2) as the major molybdenum-bearing mineral phase with minor chalcopyrite (CuFeS2) and pyrite (FeS2) (Figs. 1 and 2).

Fig. 1 XRD pattern of molybdenite concentrate

Fig. 2 Mineralogical observations from molybdenite concentrate with chalcopyrite and pyrite minerals as impurities
As can be seen, chalcopyrite and pyrite can be distinguished in the molybdenite concentrates as unwanted minerals. These minerals are liberated from the molybdenite in this size fraction, but in some cases, copper-bearing minerals and also pyrite are interlocked with molybdenite. Optical microscopy provided information on color, morphology and crystallinity. The preparation procedure was as follows: small amounts of the sample were dispersed on a glass slide, then mounted in embedding resin (Entellan (Merck) or Canada balsam) and overlain with a cover slip. This technique was routinely used both in the field and in the laboratory.
For better understanding the occurrence of major and minor minerals in the molybdenite concentrate, scanning electron microscopy (SEM) and energy dispersive X-ray analyses (EDAX) were conducted on the polished and grain samples. The polished sections and grain samples were gold coated to obtain electron conductive surfaces. The examination of the internal structure of the samples, the distribution of mineral phases, and the choice of areas for EDAX-analyses, were carried out using the back scattered electrons (BSE) technique. The results were consistent with the mineralogical observations. The size distribution of the sample and also the surface of the minerals can be observed in Fig. 3(a). The surface of the molybdenite minerals is smooth and polished. Also EDS analysis was done on the four points of the sample which was prepared in the polished section form. As can be concluded from Fig. 3(b) and four EDS patterns, only molybdenite was detected.
2.4 Culture media and microorganisms
A mixed culture of native mesophilic micro- organisms was enriched from mine drainage at the Sarcheshmeh Mine and used in the bioleaching tests. To establish microbial resistance to molybdenum, the microorganisms were grown on molybdenite concentrate in 9K medium [27] containing: 3.0 g/L (NH4)2SO4, 0.5 g/L MgSO4��7H2O, 0.1 g/L KCl, 0.5 g/L K2HPO4, 0.01 g/L Ca(NO3)2, and 44.22 g/L FeSO4��7H2O; the solution was adjusted to pH 1.8 with H2SO4.
The study was performed with mixed mesophilic cultures, which were maintained in the microbiology laboratory of the Sarcheshmeh Mine. The mesophilic culture contains iron- and sulfur-oxidizing cells morphologically similar to Acidithiobacillus ferrooxidans, Acidithiobacillus thiooxidans and Leptospirillum ferrooxidans. The cultures were sub-cultured through several transfers in the concentrate medium in order to adapt the microorganisms to the experimental conditions. When the growth was detected, the cells were harvested by centrifugation of the culture medium at 5000 r/min and 4 ��C. The resulting pellet was transferred to a microscopic slide and stained by the Gram staining procedure. The stained cells were then observed by optical microscopy (Fig. 4).
2.5 Adaptation process
Microorganisms in the mixed culture were gradually acclimatized to increased concentrations of molybdenite as sole energy source up to 10% (w/v) in 500 mL Erlenmeyer flasks containing 200 mL of nutrient medium over three months. Mix cultures of mesophilic microorganisms were incubated at 32 ��C in a temperature-controlled orbital shaker (Innova 4200 model, New Brunswick Scientific Company, USA) at 150 r/min. The pH was adjusted to pH 1.8 by adding concentrated sulfuric acid, and subsequently bacterial growth was monitored by measuring changes in the oxidation-reduction potential (ORP) and pH using an EH meter (WTW model 323) and pH meter (Metrohm model 827), respectively. Cell counts were determined using a Neubauer chamber counter with a depth of 0.02 mm and area of 1/400 mm2 under an optical microscope. The adapted bacteria sub-cultured in 9K medium were used in the subsequent experiments (cell counts, ORP and pH curves). Furthermore, adaptation tests were carried out with 20% inoculum, mass ratio of Fe2+/Fe3+ of 10, 2 g sulfur and molybdenite concentrate of 1, 3, 5 or 10 g in 200 mL of solution. The initial cell count of the mesophiles was 4��108 cell/mL. The ORP and pH of the mixed culture of mesophilic bacteria during the adaptation stages are given in Fig. 5. Furthermore, the final counts of mixed culture of mesophilic bacteria after every adaptation stage were 3.2��108, 2.2��108, 1.8��108 and 1.4��108 cell/mL, respectively. It is obvious that, by increasing the solid concentration, the adaptation rate and also the bacterial cell count decrease.
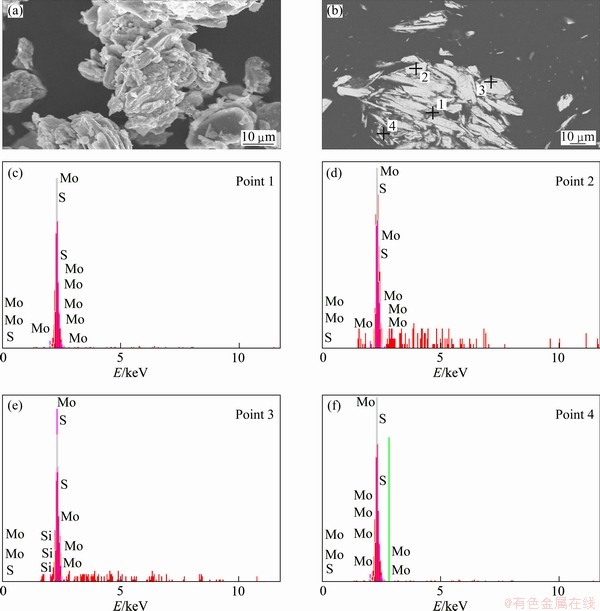
Fig. 3 SEM and EDX analysis of molybdenite concentrate

Fig. 4 Native mesophilic microorganisms (mixed culture)
2.6 Bioleaching tests
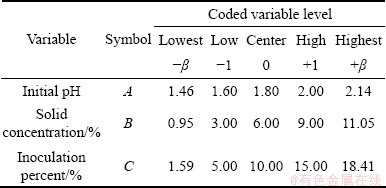
The bioleaching experiments were carried out in 250 mL Erlenmeyer flasks in an incubator shaker. In every bioleaching test, 5 g Fe2+ (as FeSO4��7H2O) and 1 g sulfur were added per 100 mL solution as energy sources with different amounts of molybdenite and inoculum in flasks for increasing ORP and decreasing pH. Three effective parameters, including initial pH, solid concentration and inoculum percent, were selected to be applied for design of experiments according to the preliminary experiments. CCD was employed to design the experiments. The range of values for each variable is given in Table 3. The conditions of bioleaching experiments (coded and actual values of levels) and their results are also shown in Table 4. In these experiments, eight tests as full factorial by three factors in high and low levels and six tests in axial points were implemented. The validation of models was finally investigated by performing two replicated tests.
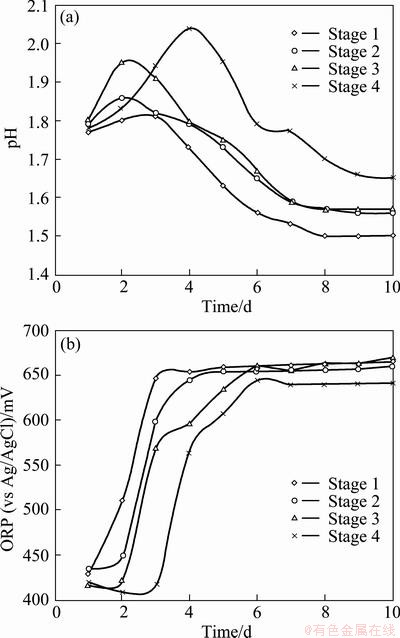
Fig. 5 Change of pH (a) and ORP (b) in adaptation stages for mesophilic bacteria
Table 3 Independent variables and their levels for central composite design (CCD)
The changes in pH and ORP over time are shown in Fig. 6. The increasing trend of ORP (��ORP ~280-300 mV) and cell counts were the most pronounced with the 9K solutions. The ore material showed a little acid demand for the first two days before the reaction became acid producing. In the bioleaching tests, the pH of the solution decreased to around pH 1 in 17 d and remained constant thereafter to the end of the test (30 d). Also ORP of the solution was increased until 10 d and after that decreased in most of the bioleaching tests especially in tests with higher solid concentration. In tests No. 1, 2, 5, 6 and 11 with low solid concentration, ORP of the solutions increased to 700-750 mV within 10 d and remained constant until the end of the tests.
3 Results and discussion
According to the design matrix, 20 tests were conducted by running in order the sequence defined by Minitab software. Three responses, i.e., Cu, Mo and Re recoveries, were evaluated, and the results are shown in Table 4. The design matrix of the variables in actual units is given in Table 5 along with the predicted and experimental values of responses (Cu, Mo and Re recoveries). It should be noted that the predicted values of responses were obtained from quadratic model equations using the Matlab software.
3.1 Model construction for copper recovery
The experimental results in Table 5 were fitted to a model equation by applying multiple regression analysis for copper recovery (using the above mentioned software). The model equation representing the copper recovery (Y1) was expressed as functions of initial pH (A), solid concentration (B), and inoculation percent (C) for coded unit as given below:
Y1=46.59+0.07A-3.70B-0.74C-0.57A2+2.53B2-0.11C2+0.21AB-0.23AC-2.16BC (8)
The statistical significance of Eq. (8) was checked by F-test, and the analysis of variance (ANOVA) for response surface model is shown in Table 6. The p value for this model is less than 0, which is given in Table 6. This indicates that the model is considered to be highly significant statistically. The predicted values of copper recovery obtained from Eq. (8) are given in Table 5. The coefficient of multiple determinations, R2, was found to be 0.94, which means that the model could explain about 94% of the total variations in the system. The high value of R2 indicates that the equation is capable of representing the system under the given experimental domain. This fact was also confirmed from the plots of the predicted versus observed values for copper recovery in Fig. 7.
3.2 Model construction for molybdenum recovery
The model equation representing the molybdenum recovery (Y2) was expressed as functions of initial pH (A), solid concentration (B), and inoculation percent (C) for coded unit as given below:
Y2=1.35-0.09A-0.32B-0.03C+0.21A2-0.19B2+0.10C2-0.02AB-0.01AC+0.14BC (9)
The statistical significances of Eq. (9) and ANOVA for response surface model are shown in Table 7. The predicted values of molybdenum recovery obtained using Eq. (9) are given in Table 5. The coefficient of multiple determinations, R2, was found to be 0.89, which means that the model could explain 89% of the total variations in the system. The high value of R2 indicates that the equation is capable of representing the system under the given experimental domain. This fact was also confirmed from the plots of the predicted versus observed values for molybdenum recovery in Fig. 8.
Table 4 Coded and actual levels of variables with experimental results
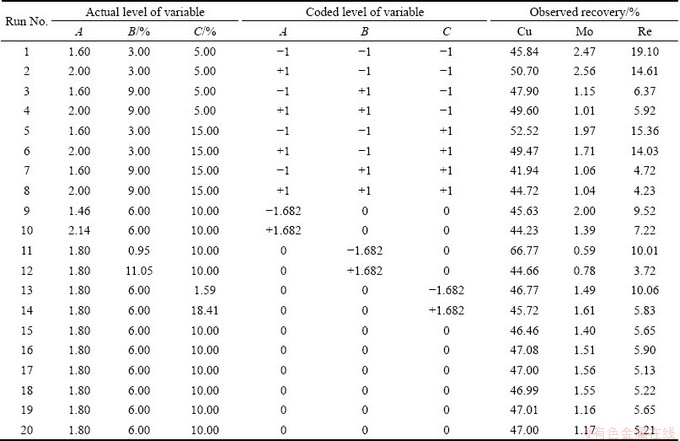
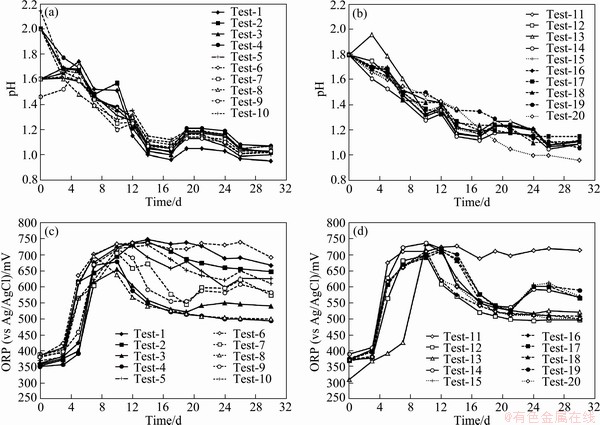
Fig. 6 Changes of pH (a, b) and ORP (c, d) in mesophilic bioleaching tests
Table 5 Experimental and predicted values of Cu, Mo and Re recoveries
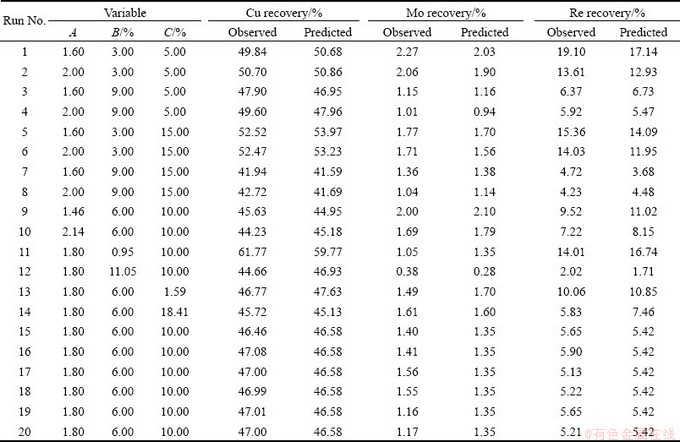
Table 6 Analysis of variance of response surface model to predict copper recovery
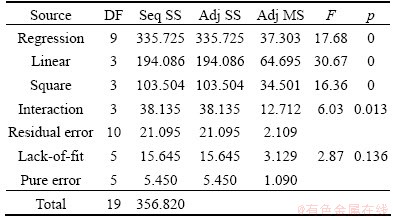
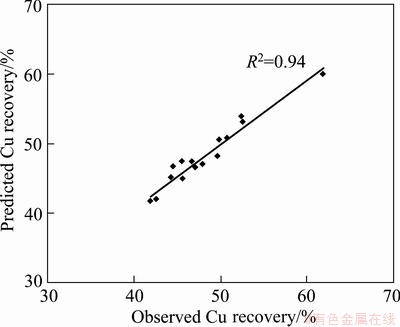
Fig. 7 Plot of predicted value vs observed value for copper recovery
Table 7 Analysis of variance of response surface model to predict molybdenum recovery
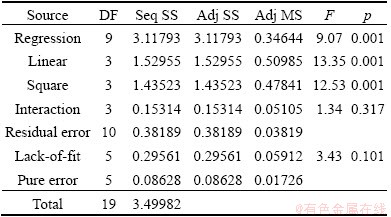

Fig. 8 Plot of predicted value vs observed value for molybdenum recovery
3.3 Model construction for rhenium recovery
The model equation representing the rhenium recovery (Y3) was expressed as functions of initial pH (A), solid concentration (B), and inoculation percent (C) for coded unit as given below:
Y3=5.42-0.85A-4.47B-1.01C+1.47A2+1.34B2+1.32C2+0.74AB+0.52AC (10)
The statistical significances of Eq. (10) and ANOVA for response surface model are shown in Table 8. The predicted values of rhenium recovery obtained using Eq. (10) are given in Table 5. The coefficient of multiple determinations, R2, was found to be 0.93, which means that the model could explain 93% of the total variations in the system. The high value of R2 indicates that the equation is capable of representing the system under the given experimental domain. This fact was also confirmed from the plots of the predicted versus observed values for rhenium recovery in Fig. 9.
Table 8 Analysis of variance of response surface model to predict rhenium recovery
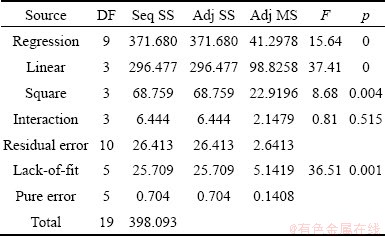
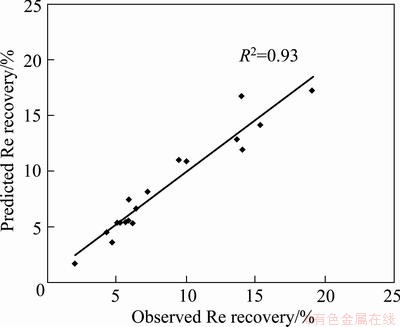
Fig. 9 Plot of predicted value vs observed value for rhenium recovery
3.4 Jarosite and sulfur formation
A mesophilic microorganism such as A. ferrooxidans is commonly grown on 9K medium developed by SILVERMAN and LUNDGREN [27]. The ferrous ions oxidation occurs via reaction (11).
 (11)
(11)
 (12)
(12)
 (13)
(13)
Since there is consumption of hydrogen ions, the pH value of the liquid media initially increases. However, this pH increase is counteracted by the hydrolysis of ferric iron:


 (14)
(14)

 (15)
(15)

 (16)
(16)
Therefore, it is quite clear that the pH of the system has an effect on the extent of the oxidation and hydrolysis reactions. Furthermore, there is a reaction in competition with the hydrolysis reaction giving products of basic ferric hydroxy sulphates with the formula MFe3(SO4)2(OH)6, where M=K+, Na+, NH4, Ag+, or H3O+ [28,29]. These hydroxy sulphate precipitates are known as jarosite. The following is the formula for jarosite precipitation:

 (17)
(17)
Since the 9K medium contains a high concentration of  ions, the jarosite produced was mainly ammoniojarosite with the formula NH4Fe3(SO4)2(OH)6. Jarosite and sulfur formation has negative effects on many applications, especially in the process of biohydrometallurgy. Jarosite and sulfur create kinetic barriers due to the small diffusion of reactants and products through the precipitation zone [28,29]. The precipitation of jarosite is widely used in the zinc industry to remove iron solubilized in the processing circuit [28-30]. The precipitation reaction is greatly accelerated by the presence of jarosite seed, and the rate increases in a nearly linear manner with increasing seed additions [28-30]. Also, in the process of coal desulfurization, the formation of jarosite on the surface of the biooxidized metal sulfide particle significantly decreases the rate of bioleaching by deactivating the surface. Jarosite formation in coal desulfurization results in residual sulfur, which cannot be removed from coal. Furthermore, jarosite formation in immobilization matrices limits the amount of biomass retention since ferric iron deposits occupy most of the available space [28,29].
After bioleaching test on the molybdenite concentrate, the remaining sample was analyzed using XRD method and its results indicated the presence of considerable amounts of jarosite and elemental sulfur. High amount of jarosite and sulfur formation is due to the addition of Fe2+ and sulfur in the bioleaching tests. Microorganism activity (particularly mesophilic species) causes the conversion of ferrous to ferric iron and consequently a good environment created for the production of jarosite. Also part of jarosite and elemental sulfur were produced because of sulfide mineral dissolution and release of iron and sulfur in solution. The two compounds produced during the process can cover the surface of the minerals and may hinder the dissolution of the sulphide minerals resulting in slow kinetics (diffusion control in the process). The XRD pattern for the sample from mixed mesophilic bioleaching is presented in Fig. 10. Furthermore, the SEM images of residue particles from bioleaching tests confirmed the presence of jarosite and sulfur, which were formed on the molybdenite surface. X-ray mapping shows that most of the particle surfaces are covered with S- and Fe-bearing compounds (Fig. 11).
3.5 Optimization of process parameters
The main objective of this study was to define the optimum bioleaching conditions for the maximum individual recoveries of Cu, Mo and Re.
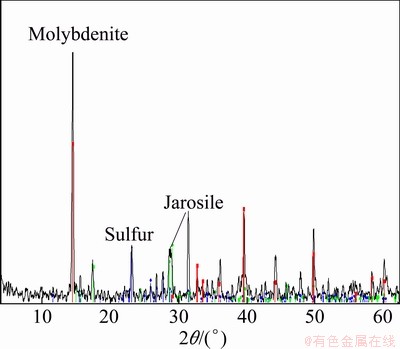
Fig. 10 XRD pattern of molybdenite after bioleaching process
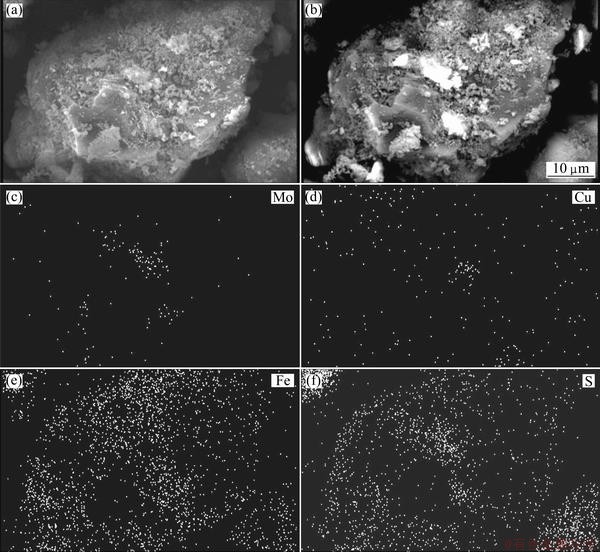
Fig. 11 SEM images showing jarosite particles and sulfur on molybdenite surface with X-ray mapping
The model Eq. (8) was optimized using quadratic programming of the mathematical software package (Matlab 7.1) to maximize copper recovery within the experimental range of conditions studied. The optimum process variables were found to be 1.68 (code value: -0.588) for pH, 0.95% (code value: -1.682) for solid concentration and 18.41% (code value: +1.682) for inoculum percent with a prediction of 64.72% Cu recovery. In that case, the predicted Mo and Re recovery were 2.18% and 24.41%, respectively.
In the same way, Eq. (9) was optimized to maximize molybdenum recovery within the experimental range of conditions studied. The optimum process variables were found to be 1.46 (code value: -1.682) for pH, 1.88% (code value: -1.373) for solid concentration and 18.41% (code value: +1.682) for inoculum percent with a prediction of 2.76% Mo recovery. In that case, the predicted Cu and Re recoveries were 50.49% and 2.76%, respectively.
In the same way, Eq. (10) was also optimized to maximize Re recovery within the experimental range of conditions studied. The optimum process variables were found to be 1.46 (code value: -1.682) for pH, 0.95% (code value: -1.682) for solid concentration and 1.59% (code value: -1.682) for inoculum percent with a prediction of 31.30% Re recovery. In that case, the predicted Cu and Mo recoveries were 53.01% and 2.74%, respectively.
It should be reiterated that the main objective of this work was to maximize Cu, Mo and Re recoveries individually, by finding the optimum conditions of operation from the developed models. Hence, the optimum process variable levels are different for each recovery.
4 Conclusions
In this study, the effect of initial pH, solid concentration, and inoculum percent on copper, molybdenum and rhenium recoveries from molybdenite concentrate from the Sarcheshmeh Copper Mine was investigated. Response surface plots show the effects of pH, solid concentration and inoculum percent on copper, molybdenum and rhenium recoveries. RSM and CCD statistical methods represent the copper, molybdenum and rhenium recoveries which were expressed as a function of these three variables, was developed by computer simulation programming applying the least squares method using Minitab and Matlab software. A statistical analysis (ANOVA) was carried out to study the effects of the individual variables as well as their combined interactive effects on copper, molybdenum and rhenium recoveries. The results showed that the effects of the individual variables, their cubic terms, and all the interactions among the variables were statistically significant. The predicted values of copper, molybdenum and rhenium recoveries using model equations were in good agreement with the experimental values. Therefore, this study has shown that the development of mathematical models for molybdenite bioleaching process based on statistics can be useful for predicting and understanding the effects of experimental factors. What must be noted here is that RSM does not explain the mechanism of the studied bioleaching process, but only ascertains the effects of variables on response and interactions between the variables. This is very important, as can be seen in this study, for the optimization of the operating conditions. This study proved that CCD and RSM can be applied for the modeling and optimization of bioleaching process. It can also be stated that it would be a scientific and economic approach to obtain the maximum amount of information in a short period of time and with the lowest number of experiments.
Acknowledgments
This work was supported by the National Iranian Copper Industry Co. and Geological Survey of Iran. We are grateful to Mr. Golamreza MOLLATAHERI (Head of Mineral Processing Division in the Geological Survey of Iran), Shahram DANESHPAJOUH (Head of Hydrometallurgy in the Sarcheshmeh Copper Mine) and Mohammad Hazrati KASHI for facilities, scientific and technical assistance. We also wish to thank our honorable partners on the project for their contributions to the work reported in this paper.
References
[1] YIN Sheng-hua, WU Ai-xiang, QIU Guan-zhou. Bioleaching of low-grade copper sulphides [J]. Transactions of Nonferrous Metals Society of China, 2008, 18: 707-713.
[2] MISHRA D, KIM D J, AHN J G, RHEE Y H. Bioleaching: A microbial process of metal recovery: A review [J]. Metals and Materials International, 2005, 11(3): 249-256.
[3] DOPSON M, SUNDKVIST J E, LINDSTROM E B. Toxicity of metal extraction and flotation chemicals to sulfolobus metallicus and chalcopyrite bioleaching [J]. Hydrometallurgy, 2006, 81: 205-213.
[4] MOUSAVI S M, YAGHMAEI S, VOSSOUGHI M, JAFARI A, HOSEINI S A. Comparison of bioleaching ability of two native mesophilic and thermophilic bacteria on copper recovery from chalcopyrite concentrate in an airlift bioreactor [J]. Hydrometallurgy, 2005, 80: 139-144.
[5] QIU M Q, XIONG S Y, ZHANG W M, WANG G X. A comparison of bioleaching of chalcopyrite using pure culture or a mixed culture [J]. Minerals Engineering, 2005, 18: 987-990.
[6] ZHANG Yan-sheng, QIN Wen-qing, WANG Jun, ZHEN Shi-jie, YANG Cong-ren, ZHANG Jian-wen, NAI Shao-shi, QIU Guan-zhou. Bioleaching of chalcopyrite by pure and mixed culture [J]. Transactions of Nonferrous Metals Society of China, 2008, 18: 1491-1496.
[7] AKCIL A, CIFTCI H, DEVECI H. Role and contribution of pure and mixed cultures of mesophiles in bioleaching of a pyritic chalcopyrite concentrate [J]. Minerals Engineering, 2007, 20: 310-318.
[8] VILCAEZ J, SUTO K, INOUE C. Bioleaching of chalcopyrite with thermophiles: Temperature�CpH�CORP dependence [J]. Int J Miner Process, 2008, 88: 37-44.
[9] ROMANO P, BLAZQUEZ M L, ALGUACHIL F J, MUNOZ J A, BALLESTER A, GONZALEZ F. Comparative studies on the selective chalcopyrite bioleaching of a molybdenite concentrate with mesophilic and thermophilic bacteria [J]. FEMS Microbiol Lett A, 2001, 196: 71-75.
[10] ASKARI ZAMANI M A, VAGHAR R, OLIAZADEH M. Selective copper dissolution during bioleaching of molybdenite concentrate [J]. Int J Miner Process, 2006, 81: 105-112.
[11] GUNARAJ V, MURUGAN N. Application of response surface methodologies for predicting weld base quality in submerged arc welding of pipes [J]. Materials Processing Technology, 1999, 88: 266-275.
[12] KANNAN N, RAJAKUMAR A, RENGASAMY G. Optimisation of process parameters for adsorption of metal ions on straw carbon by using response surface methodology [J]. Environmental Technology, 2004, 25(5): 513-522.
[13] ZIVORAD R L. Design of experiments in chemical engineering [M]. Weinheim, Germany: Wiley-VCH Verlag GmbH & Co. KGaA, 2004.
[14] HINKELMAN K, KEMPTHORNE O. Design and analysis of experiments [M]. Hoboken, NJ: John Wiley & Sons, 2005.
[15] KWAK J S. Application of Taguchi and response surface methodologies for geometric error in surface grinding process [J]. Machine Tools and Manufacture, 2005, 45: 327-334.
[16] ASLAN N. Application of response surface methodology and central composite rotatable design for modeling the influence of some operating variables of a multi-gravity separator for coal cleaning [J]. Fuel, 2007, 86: 769-776.
[17] ASLAN N, CEBECI Y. Application of box-behnken design and response surface methodology for modeling of some Turkish coals [J]. Fuel, 2007, 86: 90-97.
[18] ASLAN N. Application of response surface methodology and central composite rotatable design for modeling and optimization of a multi-gravity separator for chromite concentration [J]. Powder Technology, 2008, 185: 80-86.
[19] ASLAN N. Modeling and optimization of multi-gravity separator to produce celestite concentrate [J]. Powder Technology, 2007, 174: 127-133.
[20] OBENG D P, MORRELL S, NAPIER-MUNN T J. Application of central composite rotatable design to modeling the effect of some operating variables on the performance of the three-product cyclone [J]. Int J Miner Process, 2005, 76: 181-192.
[21] BOX G E P, HUNTER W G. The 2k-p fractional factorial designs: Part I and II [J]. Journal of Technometrics, 1961, 3: 311-458.
[22] BOX G E P, WILSON K B. On the experimental attainment of optimum conditions [J]. Journal of the Royal Statistical Society, Series B, Statistical Methodology, 1951, 13: 1-45.
[23] BOX G E P, HUNTER J S. Multi-factor experimental design for exploring response surfaces [J]. Annals of Mathematical Statistics, 1957, 28: 195-241.
[24] CILLIERS J J, AUSTIN R C, TUCKER J P. An evaluation of formal experimental design procedures for hydrocyclone modelling [C]//SVAROVSKY L, THEW M T. Proc 4th Int Conf on Hydrocyclones. Southampton: Kluwer Academic Publishers, 1992: 31-49.
[25] CROZIER R D. Flotation theory, reagents and ore testing [M]. New York: Pergamon Press, 1992.
[26] KARIMI P, ABDOLLAHI H, ASLAN N, NOAPARAST M, SHAFAEI S Z. Application of response surface method and central composite design for modeling and optimization of gold and silver recovery in cyanidation process [J]. International Journal of Mineral Processing and Extractive Metallurgy Review, 2011, 32(1): 1-16.
[27] SILVERMAN M P, LUNDGREN D G. Studies on the chemoautotrophic iron bacterium Thiobacillus ferrooxidans. (I) An improved medium and a harvesting procedure for securing high cell yields [J]. Journal of Bacteriology, 1959, 77: 642-647.
[28] DAOUD J, KARAMANEV D. Formation of jarosite during Fe2+ oxidation by Acidithiobacillus ferrooxidans [J]. Minerals Engineering, 2006, 19: 960-967.
[29] JENSEN A B, WEBB C. Ferrous sulfate oxidation using Thiobacillus ferrooxidans: A review [J]. Process Biochemistry (Oxford), 1995, 30(3): 225-236.
[30] DUTRIZAC J E. The effectiveness of jarosite species for precipitating sodium jarosite [J]. JOM, 1999, 51(12): 30-32.
�������ϸ���Ի������Cu��Mo��Re���������
H. ABDOLLAHI1, S. Z. SHAFAEI1, M. NOAPARAST1, Z. MANAFI2, N. ASLAN3
1. School of Mining, College of Engineering, University of Tehran, Tehran, Iran;
2. National Iranian Copper Industries Co. Sarcheshmeh Mine, Iran;
3. Mining Engineering Department, Cumhuriyet University, Sivas, Turkey
ժ Ҫ��������Ӧ�淽�������븴����תʵ����Ʒ����Ի�����������������Ӱ��ͭ�����諾�����һЩ�������������˽�ģ���Ż����������븴����תʵ����Ʒ�����������3����Ҫ���ض����������Ӱ�죬����ҺpHֵ����Ũ�ȡ�������Ũ�ȣ���ֵ�ֱ�Ϊ��pH1.46~2.14����Ũ��0.95%~11.05%��������Ũ��1.59%~18.41%���������븴����ת��Ʒ�������20���������ʵ�顣�������õ���ͭ�����諾����ʵ�ʵ����������3���������ض���ֱ����˾��鹫ʽ����ʵ��������Χ�ڣ����ݾ��鹫ʽ���ö��η��̶Ի������ͭ�����諾����ʵĹ��������������Ż�������������������ͭ�����ʵĹ�������Ϊ��pH=1.68����Ũ��0.95%��������Ũ��18.41%���ڴ������£����蝹Ľ����ʷֱ�Ϊ2.18%��24.41%��ͭ�����諾����ʵ�Ԥ������ʵ�����ǺϽϺá���������������лƼ��������ɶԽ�����Ӱ�졣
�ؼ��ʣ���������������ͭ���⣻画��������ϸ������Ӧ�棻���븴����ת���
(Edited by Sai-qian YUAN)
Corresponding author: H. ABDOLLAHI; Tel: +98-21-64592257; Fax: +98-912-5032335; E-mail: hadi_abdollahi2003@yahoo.com; h_abdollahi@ut.ac.ir
DOI: 10.1016/S1003-6326(13)62449-8
Abstract: The application of the response surface methodology and the central composite design (CCD) technique for modeling and optimization of the influence of some operating variables on copper, molybdenum and rhenium recoveries in a bioleaching process was investigated. Three main bioleaching parameters, namely pH, solid concentration and inoculum percent, were changed during the bioleaching tests based on CCD. The ranges of the bioleaching process variables used in the design were as follows: pH 1.46-2.14, solid concentration 0.95%-11.05%, and inoculum percent 1.59%�C18.41%. A total of 20 bioleaching tests were carried out by the CCD method according to software-based designed matrix. Empirical model equations were developed according to the copper, molybdenum and rhenium recoveries obtained with these three parameters. Model equations of responses at the base of parameters were achieved by using statistical software. The model equations were then individually optimized by using quadratic programming to maximize copper, molybdenum and rhenium recoveries individually within the experimental range. The optimum conditions for copper recovery were pH 1.68, solid concentration 0.95% and the inoculum 18.41% (v/v), while molybdenum and rhenium recoveries were 2.18% and 24.41%, respectively. The predicted values for copper, molybdenum and rhenium recoveries were found to be in good agreement with the experimental values. Also jarosite formation during bioleaching tests was also investigated.
