
J. Cent. South Univ. (2016) 23: 1915-1923
DOI: 10.1007/s11771-016-3247-1

A land use-based spatial analysis method for human health risk assessment of heavy metals in soil and its application in Zhuzhou City, Hunan Province, China
WANG Zhen-xing(������)1, GUO Qing-wei(���ΰ)1, YANG Zhi-hui(��־��)2, SUN Guo-qing(�����)3,
YE Wan-sheng(Ҷ����)1, HU Xi-bang(��ϰ��)1
1. South China Institute of Environmental Sciences, Ministry of Environmental Protection, Guangzhou 510655, China;
2. School of Metallurgical and Environment, Central South University, Changsha 410083, China;
3. School of Geosciences and Info-physics, Central South University, Changsha 410083, China
 Central South University Press and Springer-Verlag Berlin Heidelberg 2016
Abstract:
A land use- and geographical information system-based framework was presented for potential human health risk analysis using soil sampling data obtained in Zhuzhou City, Hunan Province, China. The results show that heavy metal content in soil significantly differs among different land use types. In total, 8.3% of the study area has a hazard index (HI) above the threshold of 1.0. High HIs are recorded mainly for industrial areas. Arsenic (>87%) and the soil ingestion pathway (about 76%) contribute most to the HI. The mean standardized error and root-mean-square standardized error data indicate that the land use-based simulation method provides more accurate estimates than the classic method, which applies only geostatistical analysis to entire study area and disregards land use information. The findings not only highlight the significance of industrial land use, arsenic and the soil ingestion exposure pathway, but also indicate that evaluating different land use-types can spatially identify areas of greater concern for human health and better identify health risks.
Key words:
soil; heavy metal; health risk; land use; geographic information system (GIS)��
1 Introduction
With the rapid development of industry, heavy metal pollution in soil has become one of the major environmental concerns confronting China and the rest of the world [1]. Estimating the spatial distribution of heavy metals is crucial to quantifying the risk levels at different locations [2-3]. As field investigation is limited by time and cost and the observations thereof contain considerable uncertainty, the accuracy of direct analysis of in situ data is often questionable [4]. Spatial interpolation methods, such as Kriging estimation, have been widely used for quantifying the spatial patterns of pollutants [5-6]. However, research has shown that the Kriging method is applied to whole study areas and rarely considers land use-based risk simulation, which tends to smooth out local details of spatial variations in soil attributes [7]. Therefore, uncertainty associated with the delineation of contaminated areas by the Kriging method as applied to an entire study area needs to be resolved [8], because such uncertainty can be propagated into subsequent health risk assessment modeling and has a fundamental impact on the results of the model [9].
In actual situations, different types of land use in a field scale often exist. Land use is the main factor affecting soil quality, and it is also one of the most important factors influencing health risks that arise from soil contamination [10]. Waste disposal and smelter stacks may be the major sources of pollutants in industrial areas. By comparison, in agricultural areas, contaminates are mainly caused by fertilizer and pesticide use or sewage sludge application. Land use can reflect not only the main sources of pollutants but also soil properties (eg, pH, Eh, organic matter and cation exchange capacity) that influence the mobility and transport patterns of metals [11]. Moreover, land use can represent many human exposure factors (eg, population density, exposure route and frequency) in health risk assessment. Although some health risk assessments are conducted under site-specific exposure scenarios, site- specific (or land use-based) simulation methods are rarely used to better characterize human health risks (HHRs). A geographical information system (GIS) is a powerful tool that stores, analyzes, and represents all kinds of spatial information and data [12]. The integration of risk assessment models and GIS effectively addresses the spatial and temporal variability of different parameters involved in environmental processes and develops risk cartographies [13]. The role of GIS in environmental risk assessment has been thoroughly discussed by NUCKOLS et al [14] and reviewed by LAHR and KOOISTRA [12]. However, very few attempts have been made to study combinations of GIS and risk assessment models according to land use information, which may be better for delineating and quantifying the spatial patterns of the HHRs of soil metals.
In recent years, considerable amounts of heavy metals in soils have become an increasing issue in China [15]. Hunan Province, which is located in the central south part of the country, is regarded as the heartland of Chinese nonferrous mining and has been under severe heavy metal pollution stress [16-17]. For many years, emissions of arsenic (As), cadmium (Cd), and zinc (Zn) in the province have ranked first in China [18]. Zhuzhou City is the base of heavy industry in Hunan Province as characterized by the concentration of industries and conspicuous pollution in the area.
In this work, an extensive survey of As, Cd, and Zn in soil from Zhuzhou City was presented. A combination of geostatistics, GIS, and risk assessment models was applied according to land use information (combined method) to delineate and quantify the spatial patterns of the HHRs of soil metals. Traditional method was also performed, which only applies geostatistical methods to whole study areas and does not consider land use-based risk simulation. Then these methods were compared in detail.
2 Materials and methods
2.1 Site description and soil sampling
Zhuzhou City is a modern industrial city located in the eastern part of Hunan Province, China (Fig. 1), which is located in the central south area of China (E 112��57'30''�C114��07'15'', N 26��03'05''�C28��01'27''). As the largest industrial city in Hunan Province, it has a total area of 11420 km2 and a population of 3.77 million [19]. The major types of industry in Zhuzhou City are machinery, metallurgy, as well as chemical and production of building materials. Zhuzhou City also has a complete set of developing industrial bases, such as for electric power, coal, light, textile, electronics, food, medicine, and leather. Soil pollution in Zhuzhou City, especially heavy metal pollution, mainly comes from the spread of industrial waste to surrounding areas, particularly that associated with the traditional use of solid waste as manure, and irrigation using polluted water from ponds close to the factories [20-21].
Given that Zhuzhou City is a large city, only one industrial area and its surrounding areas for research (about 35 km2) were selected. Surface soil samples (0- 20 cm) were collected in April 2010 from locations that were identified using a global positioning system. The field scale sampling density was one sample per 0.5 km2.
2.2 Analytical procedure
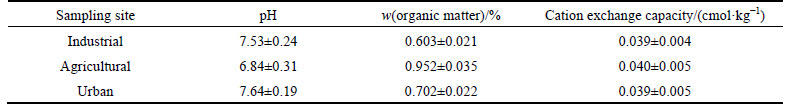
The moisture soil samples were air dried and sieved (<0.15 mm) to determine the content of metals, including As, Cd and Zn [22]. The main chemical properties of these tested soils are presented in Table 1. Soil samples were digested at approximately 180 ��C with 15 mL of HNO3 and 20 mL of HClO4 (70%) in a closed Teflon vessel using a microwave oven to prevent the loss of some metals via volatilization. After the sample was cooled slightly, 3 mL of 1:1 HCl was added [16]. The digested solution was then filtrated and transported to a flask at an increased volume of 50 mL. Total concentrations of Cd and Zn in the filtered solution were then measured using inductively coupled plasma/mass spectrometry. In addition, the content of As was determined by atomic fluorescence spectrophotometry. All samples were analyzed in three replicates. The quality control of analytical accuracy was carried out using reagent blanks and reference soils. Standard reference materials for soil (GBW-07401) obtained from the China National Center for Standard Reference Materials were digested along with the samples and used for quality assurance/quality control.
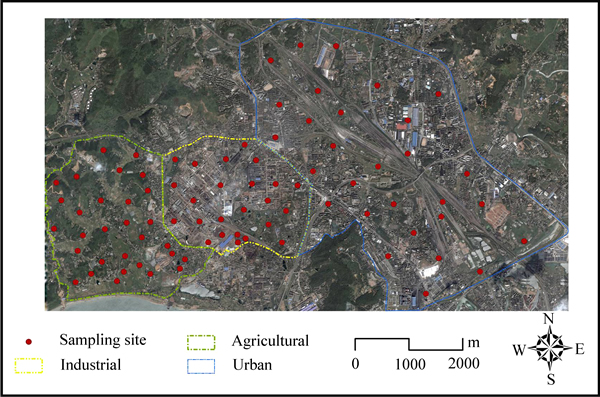
Fig. 1 Site location and sampling distribution
Table 1 Chemical properties of soil samples
2.3 Health risk characterization
To estimate soil exposure, three pathways were considered: incidental ingestion of soil, inhalation of particulates emitted from soil, and dermal contact with soil. The potential risk of metals was expressed as the hazard quotient (HQ, Qh).
The following equation was used to determine the three exposure pathways of soil metals [23]:


 (1)
(1)
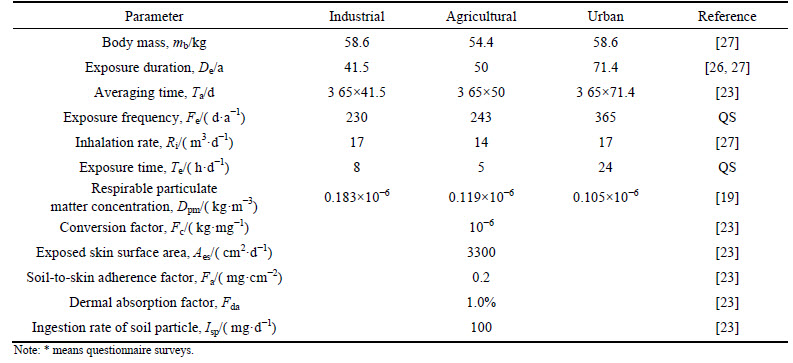
where Icd is the chronic daily intake (mg/(kg��d)), Cs is the metal concentration in soil (mg/kg), Dpm is the concentration of particulate matter that is respirable in air, Mpm is the contaminated concentration of airborne particulate matter (assumed equal to [Cs], where dust is derived from the soil [24]), and Dr is the reference dose (mg/(kg��d)) that estimates the daily exposure of human populations that is likely to be without an appreciable risk of deleterious effects throughout their lifetime. The Dr values were based on 3��10-4, 1��10-3 and 0.3 mg/(kg��d) for As, Cd and Zn, respectively [25]. Other parameters in Eq. (1) are explained in Table 2.
With respect to the assessment of the overall potential risks posed by As, Cd, and Zn, the HQ calculated for each metal was summed and expressed as the hazard index (HI, Ih):
 (2)
(2)
2.4 Exposure factors for three land-use scenarios
Spatial planning and land management have important impacts on the potential transfer of pollutants from contaminated soils to humans [10]. A study area can be categorized into one of three land use types, namely, industrial, agricultural, and urban. Exposure factors, including contaminant concentrations and releases, potential exposure pathways, as well as demographic and life habits of exposed populations, differ among these three types. Details on the exposure factors for each scenario are summarized in Table 2.
2.4.1 Scenario I (Industrial)
Professional women and men from the study area retire at the ages of 55 and 60 years, respectively, with the mean retirement age being 57.5 years. Thus, the exposure duration (ED) for this scenario is considered over their working lifetime: 16�C57.5 years. Employees work 5 days a week and are entitled to up to 6 weeks of leave (including statutory holidays, such as 1 May, 1 October, and Spring Festival) per year, which gives an exposure frequency (EF) of 230 days per year. An 8-hour industrial workday was used to account for this scenario.
2.4.2 Scenario II (Agricultural)
The agricultural site is a large open space with individual cultivated lands used for growing vegetables, where the workers most exposed to soil are female farmers. Approximately 42% of Chinese farmers aged 65 years or older still participate fully in farm work [26]. Therefore, the ED considered for this scenario is 50 years (16-65 years). According to local agricultural activities and questionnaire surveys, farmers spend approximately two thirds of their time on the farm annually (243 days per year). In addition, a 5-hour farm workday was considered appropriate for this scenario.
2.4.3 Scenario III (Urban)
The ED for this land use scenario is 58 years, which is the average age of the Chinese people [27]. The exposure time is 24 h per day (16 h indoors and 8 h outdoors). The EF was assumed to be 365 d per year. The ingestion rates for indoor dust and outdoor soil were both considered.
Table 2 Exposure references of health risk assessment models
2.5 GIS technologies: Geostatistical analysis, TIN model and layer analysis
Geostatistics provides a set of statistical tools for incorporating the spatial and temporal coordinates of observations in environmental data processing [28]. The ordinary Kriging method was applied to both the traditional and combined methods, and estimated values were assembled to form a conditional distribution of probability for health risks. Mean standardized error (MSE) and root-mean-square standardized error (RMSSE) were used to choose the best variogram model in the geostatistical analysis and to select the search radius and lag distances that minimize the Kriging error [29]. An accurate model would have MSE and RMSSE values close to 0 and 1, respectively [30]. The geostatistical analysis was processed with ArcGIS using the module of Geostatistical Analyst.
The triangulated irregular network (TIN) data structure is based on two basic elements, namely, points with x, y and z values (z values were regarded as health risks in this work) and a series of edges joining these points to form triangles. The triangulation method in TIN satisfies the Delaunay criterion [31]. The first phase of generating a TIN from the results of geostatistical analysis entails extracting the skeleton of surface- specific lines (contour lines or isolines). In this work, the surface-specific lines represent the health risk values. A local geometric operator was then used to identify possible points on the contour lines. Subsequently, these points were linked to new contour lines and automatically connected in a Delaunay triangulation. Finally, the resulting model was compared with the original highly dense grid, and additional supporting points were added at the points of worst fit until the maximum discrepancy between the TIN model and the original model was within prespecified tolerance [6]. The TIN model was processed with ArcGIS using the extension module of 3D Analyst [32].
Different layers of land use information must be incorporated into a GIS to yield a more reliable estimate of HHRs. Maps of existing land use were prepared from a satellite imagery (LANDSAT) and entered into the GIS environment. Ten layers (land use types, metal contents, Mpm, Fe, Te, De, Ri, Dpm, Ta and mb) were used in the present analysis (Fig. 2). As summarized in the flowchart given in Fig. 2, land use information was incorporated into health risk assessment using a GIS. All layer information was digitalized in GIS format and their correlations, expressed as the HI, with potential health hazard occurrence were established using the predicted data by geostatistical analysis. A TIN model and a layer joint analysis were then used to create a hazard map.
3 Results and discussion
3.1 Metal distribution in soils
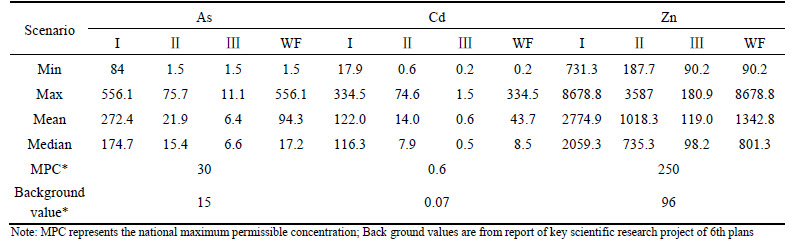
Fifty-nine percent of the soil samples meets the national maximum permissible concentration (MPC) for As, whereas only approximately 29% and 14% fall within the safety limits for Zn and Cd, respectively. All the industrial field samples fail to satisfy the national soil standards for As, Cd, and Zn (Table 3). In addition, the Cd contents in farming soils notably exceed the MPC (0.6 mg/kg) in every case, with the mean level (14.0 mg/kg) exceeding the MPC by more than 23-fold. Moreover, only 77% and 12% of samples in the agricultural area are within the MPCs for As and Zn, respectively.
According to their average concentrations, the field soil most elevated by Cd is from the industrial area,followed by those from the farming and urban areas. The median metal concentrations in soil samples collected from the industrial, agricultural, and urban sites are 116.3, 7.9, and 0.5 mg/kg, respectively.
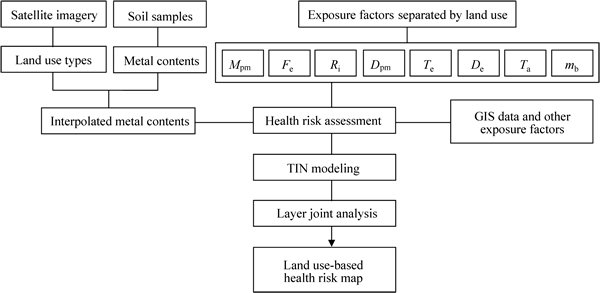
Fig. 2 Flowchart of land use-based health risk assessment and analysis
Table 3 Site-specific and whole field (WF) statistics for soil metal concentrations (Unit: mg��kg-1)
3.2 Geostatistical analysis
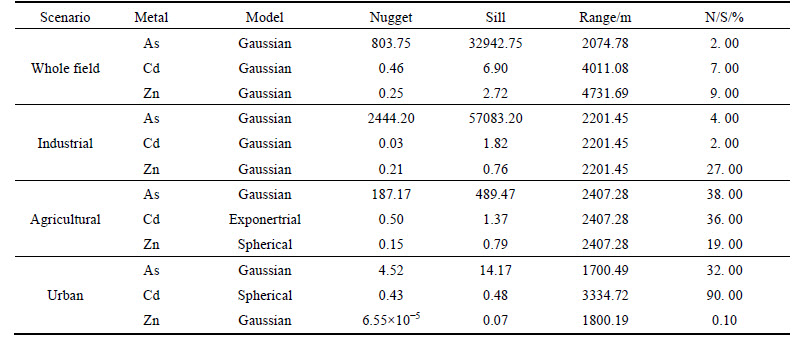
Initial data exploration and directional variograms estimated from the sample data indicate that the data can be analyzed using ordinary Kriging estimation. Sample variograms are then estimated for these directions. The MSE and RMSSE are used to evaluate the variograms and to choose the most appropriate spatial model (spherical, exponential and Gaussian) for the creation of the prediction map for As, Cd and Zn. The results of the best-fit model and parameters are shown in Table 4. The nugget/sill ratio (N/S) quantifies the importance of random components and provides a quantitative estimation of spatial dependence. For all experimental variograms in the whole study area, the N/Ss are below 10%, indicating strong spatial dependence, which may be due to the longer-term pollution (more than 50 years) from the industrial area. The larger N/Ss suggest that extrinsic factors (e.g. human activities) have weaker spatial correlations. For the land use separated experimental variograms of As and Cd in the agricultural and urban areas, the N/Ss range from 32% to 90%, indicating that anthropic inputs play a dominant role. For the land use-based experimental variograms of Zn in the urban areas, the N/S is 0.1% and the mean content of Zn is only 119 mg/kg, suggesting that natural factors are crucial to controlling the distribution of Zn and soils in areas not polluted by it. Thus, metal pollution can be better spatially identified by evaluating different land-use types.
3.3 Land use-based health risk assessment
Health risk values (HQ or HI) higher than 1.0 indicate the potential of an adverse effect to occur. It is shown that the soil metal concentrations in Zhuzhou City are high enough to induce health problems, which is further illustrated by comparing three land use groups using different exposure pathways. Figure 3 shows the spatial distribution of the risk index values calculated for the industrial, agricultural, and urban areas. The average HI is higher than 0.5 in the whole area, and it reaches as high as 1.5 in the industrial area, with the maximum value of 3.0. A total of 14% of the observations and 8.3% of the study area have an HI above the threshold of 1.0. Additionally, 11% of the observations and 2.6% of the study area have an HI higher than 2.0. High HIs are detected mainly in the industrial area because of the accumulation of metals by ore smelting therein. Although the agricultural area has much higher metal concentrations compared with the urban area, higher HIs are also identified across the urban field as a consequence of the higher EF in this land use scenario. Therefore, pollution in the urban area should be given more attention than that in the other areas because of its exposure characteristics and large population.
Table 4 Best-fitted models and parameters
A large discrepancy in the HQ among different metals is observed (Fig. 4). As contributed the most to the HI (>87%), Cd contributes approximately 11.5%, and Zn contributes the least (1.3%). Therefore, the risks of As exposure via soil warrant further consideration.
Identifying the main pathways for the considered risk is important for minimizing and mitigating the effects of soil metal pollution. Figure 4 also presents the proportion of the HI attributable to different exposure pathways. The contribution from dermal contact with soil is the lowest (about 5% of the HI), dust inhalation exposure contributes approximately 19% of the HI, and approximately 76% of the HI could be ascribed to soil ingestion exposure, which is in accordance with published results [24].
3.4 Validation and comparison
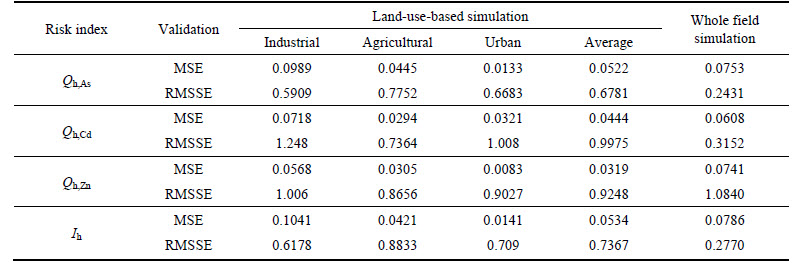
The same data from soil samples is used to simulate the risks without considering land use for comparison, and then to assess the land use-based simulation method derived from the HHR assessment. If the predictions are close to the measured values, then the MSE and RMSSE should be close to 0 and 1, respectively. For land use-based simulation method, the MSE and RMSSE are calculated in each scenario, and the average values of the three scenarios are used to assess the method (Table 5).
The results show that the MSE values for the land use-based simulation method (Qh,As=0.05; Qh,Cd=0.04; Qh,Zn=0.03; Ih=0.05) are closer to 0 compared with those for the traditional method (Qh,As=0.08; Qh,Cd=0.06; Qh,Zn=0.07; Ih=0.08). Moreover, the RMSSE values for the land use-based simulation method (Qh,As=0.68; Qh,Cd=1.00; Qh,Zn=0.92; Ih=0.74) are closer to 1 compared with those for the traditional method (Qh,As=0.24; Qh,Cd=0.32; Qh,Zn=1.08; Ih=0.28). The MSE and RMSSE data indicate that the health risk predicted values of the land use-based simulation method are closer to the measured values compared with those of the traditional method and that the risk values calculated by the land use-based method are more reliable [33].
For the control method, it is estimated that 7.6% of the study area has an HI higher than 1.0 and that 2.9% has an HI higher than 2.0. However, for the land use-based method, a total of 8.3% of the study area has an HI above the threshold of 1.0 and 2.6% has an HI higher than 2.0. Such differences may provide useful information for risk management.
3.5 Implications for risk management and land-use- planning policies
Different land use types (industrial, agricultural, and urban) are considered in the land use simulation method. The results show that they have crucial risk management implications. Firstly, China��s ongoing rapid industrial development, agricultural modernization, and urban construction indicate not only that contaminated sites are increasingly being discovered but also that they will continually be generated in the future. Therefore, it is critical to prioritize those sites posing an imminent threat to human health and ecological systems. The land use-based simulation method developed in this work is useful for prioritizing problem sites not only in the whole area but also in each scenario. Secondly, the results demonstrate that soil contamination from metals is highly region specific. However, current pollution simulation methods have not considered the differences between scenarios. The land use-based simulation method provides a linkage among pollution sources, soil property, and consequent potential health risk. Thirdly, it offers environmental agencies with important information to enable assessments of soil through spatial identification and quantification of sources, pathways and receptors. Spatial HHR information can be used to steer the environmental planning process, assess the needs and potential impacts of land-use planning, design the necessity, set the priority for remedial action, improve environmental planning decisions and land-use- planning policies. The overall benefits can reduce the health risks to inhabitants and minimize the impact of soil contamination on the health of populations.
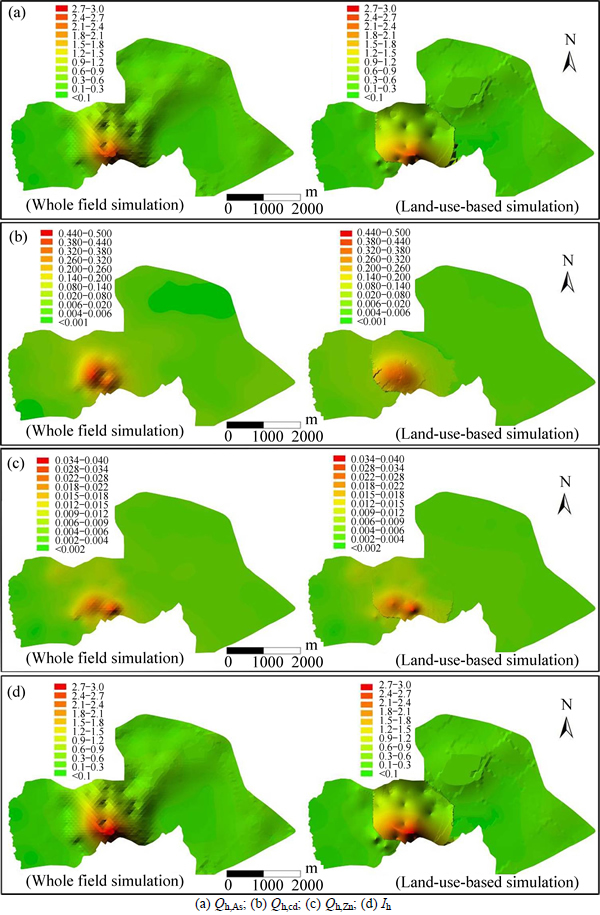
Fig. 3 Analysis of HQs and HIs for different metals and methods:

Fig. 4 Contribution of HQs of different metals and pathways to HI in three land use scenarios
Table 5 MSE and RMSSE statistics for risk simulation
4 Conclusions
1) Approximately only 59%, 29% and 14% of the soil samples collected from the field meet the national MPCs for As, Zn and Cd, respectively. Based on the average concentrations, the field soil most elevated by Cd is from the industrial area, followed by those from the agricultural and urban areas, with the median metal concentrations in soil samples collected from the industrial, farming, and urban sites being 116.3, 7.9, and 0.5 mg/kg, respectively.
2) The metal concentrations in Zhuzhou City soils are high enough to induce health problems. A total of 8.3% of the study area has an HI above the threshold of 1.0, whereas 2.6% has an HI higher than 2.0. The largest contributors to the HI are As (>87%) and the soil ingestion exposure pathway (about 76%). The MSE and RMSSE data indicate that the health risk predicted values of the land use-based simulation method are closer to the measured values compared with those of the traditional method.
3) The areas of greater concern for human health can be spatially identified and health risks can be better quantified by evaluating different land use types. Thus, the method described herein can be used to control the health risks associated with soil pollutions. The framework of land use-based health risk analysis with GIS technology could result in a more reliable health risk map for land use planning, and its potential misuse can be minimized.
References
[1] WEI Bing-gan, YANG Lin-sheng. A review of heavy metal contaminations in urban soils, urban road dusts and agricultural soils from China [J]. Microchemical Journal. 2010, 94 (2): 99-107.
[2] KOMNITSAS K, MODIS K. Geostatistical risk estimation at waste disposal sites in the presence of hot spots [J]. Journal of Hazardous Materials, 2009, 164 (1/2): 1185-1190.
[3] SUN Yue-bing, ZHOU Qi-xing, XIE Xiao-kui, LIU Rui. Spatial, sources and risk assessment of heavy metal contamination of urban soils in typical regions of Shenyang, China [J]. Journal of Hazardous Materials, 2010, 174 (1/2/3): 455-462.
[4] JUANG Kai-wei, CHEN Y S, LEE D Y. Using sequential indicator simulation to assess the uncertainty of delineating heavy-metal contaminated soils [J]. Environmental Pollution, 2004, 127(2): 229-238.
[5] YANG Ping-guo, MAO Ren-zhao, SHAO Hong-bo, GAO Yun-feng. An investigation on the distribution of eight hazardous heavy metals in the suburban farmland of China [J]. Journal of Hazardous Materials, 2009, 167(1/2/3): 1246-1251.
[6] CHAI Li-yuan, WANG Zhen-xing, WANG Yun-yan, YANG Zhi-hui, WANG Hai-ying, WU Xie. Ingestion risks of metals in groundwater based on TIN model and dose-response assessment-A case study in the Xiangjiang watershed, central-south China [J]. Science of The Total Environment, 2010, 408(16): 3118-3124.
[7] GOOVAERTS P. Geostatistics in soil science: State-of-the-art and perspectives [J]. Geoderma, 1999, 89(1/2): 1-45.
[8] GOOVAERTS P, Geostatistical modelling of uncertainty in soil science [J]. Geoderma, 2001, 103 (1/2): 3-26.
[9] ZHAO Yong-cun, SHI Xue-zheng, YU Dong-sheng, WANG Hong-jie, SUN Wei-xia. Uncertainty assessment of spatial patterns of soil organic carbon density using sequential indicator simulation, a case study of Hebei province, China [J]. Chemosphere, 2005, 59(11): 1527-1535.
[10] POGGIO L,  B, HEPPERLE E, SCHULIN R, MARSAN F A. Introducing a method of human health risk evaluation for planning and soil quality management of heavy metal-polluted soils-An example from Grugliasco (Italy) [J]. Landscape and Urban Planning, 2008, 88(2/3/4): 64-72.
[11] LUO Wei, LU Yong-long, John PG, WANG Tie-yu, SHI Ya-juan, WANG Guang, XING Ying. Effects of land use on concentrations of metals in surface soils and ecological risk around Guanting Reservoir, China [J]. Environmental Geochemistry and Health, 2007, 29(6): 459-471.
[12] LAHR J, KOOISTRA L. Environmental risk mapping of pollutants: State of the art and communication aspects [J]. Science of the Total Environment, 2009, 408(18): 3899-3907.
[13] ROBERTO V, MAURA C, GUIDO M, DOMENICA A, SERENELLA S, ANTONIO F, MARCO V. GIS-based system for surface water risk assessment of agricultural chemicals��1. Methodological approach [J]. Environmental Science & Technology, 2002, 36(2): 1532-1538.
[14] NUCKOLS J R, WARD M H, JARUP L. Using geographic information systems for exposure assessment in environmental epidemiology studies [J]. Environmental Health Perspectives, 2004, 112(9): 1007-1015.
[15] BRUS D J, LI Z B, SONG J, KOOPMANS G F, TEMMINGHOFF E J M, YIN X B, YAO C X, ZHANG H B, LUO Y M, JAPENGA J. Predictions of spatially averaged cadmium contents in rice grains in the Fuyang valley, PR China [J]. Journal of Environmental Quality, 2009, 38(3): 1126-1136.
[16] WANG Zhen-xing, CHAI Li-yuan, YANG Zhi-hui, WANG Yun-yan. Identifying sources and assessing potential risk of heavy metals in soils from direct exposure to children in a mine impacted city, Changsha, China [J]. Journal of Environmental Quality, 2010, 39(5): 1616-1623.
[17] WANG Zhen-xing, CHAI Li-yuan, YANG Zhi-hui, HUANG Shun-hong, ZHENG Yu. Environmental impact and site-specific human health risks of chromium in the vicinity of a ferro-alloy manufactory, China [J]. Journal of Hazardous Materials, 2011, 190(1/2/3): 980-985.
[18] NBSC(National Bureau of Statistics of China), National Bureau of Statistics of China [EB/OL]. [2015-10-03], http://www.stats.gov.cn/ was40/gjtjj_outline. jsp.
[19] LI Pei. Zhuzhou almanac [M]. Zhuzhou, China: Zhuzhou almanac Editorial Committee, 2007: 32-33. (in Chinese)
[20] WANG Hai-yan. Assessment and prediction of overall environmental quality of Zhuzhou City, Hunan Province, China [J]. Journal of Environmental Management, 2002, 66(3): 329-340.
[21] CHEN Ming, LI Xiao-ming, YANG Qi. Total concentrations and speciation of heavy metals in municipal sludge from Changsha, Zhuzhou and Xiangtan in middle-south region of China [J]. Journal of Hazardous Materials, 2008, 160(2/3): 324-329.
[22] MEP (Ministry of environmental protection of the people��s republic of China), The Technical Specification for soil Environmental monitoring (HJ/T 166-2004) [EB/OL]. [2015-10-03]. http://www. mep.gov.cn/pv_obj_cache/pv_obj_id_C5B40157F2296EA55F92DFDF745FDF68DB130300/filename/5406.pdf.
[23] USEPA.User's Guide [EB/OL]. [2015-10-03]. http://www.epa.gov/ reg3hwmd/risk/human/rb-concentration_table/usersguide.htm.
[24] HOUGH RL, BREWARD N, YOUNG S D, CROUT N M J, TYE A M, MOIR A M, THORNTON I. Assessing potential risk of heavy metal exposure from consumption of home-produced vegetables by urban populations [J]. Environmental Health Perspectives, 2004, 112(2): 215-221.
[25] USEPA.Integrated Risk Information System (IRIS). [2015-10-03]. http://www.epa.gov/ncea/iris/index.html
[26] PANG L, BRAUW A, ROZELLE S. Working until dropping: Employment behavior of the elderly in rural China [D]. University of California, California, 2004.
[27] Ministry of Health. Yearbook of Chinese health statistics [M]. Beijing, China: People��s Health Press, 2007: 19-21. (in Chinese)
[28] SAITO H, GOOVAERTS P. Geostatistical interpolation of positively skewed and censored data in a dioxin-contaminated site [J]. Environmental Science & Technology, 2000, 34(5): 4228-4235.
[29] DAVIS B M. Uses and abuses of cross-validation in geostatistics [J]. Mathematical Geology, 1987, 19(3): 241-248.
[30] WEBSTER R, OLIVER M A. Geostatistics for environmental scientists [M]. New York: John Wiley & Sons, 2007: 26-28.
[31] PEUCKER T K, FOWLER R J, LITTLE J J, MARK D M. The triangulated irregular network [M]. New York: Proceedings Digital Terrain Models (DTM) Symposium, 1978: 43-44.
[32] BOOTH B, BRATT S. Using ArcGIS 3D analyst [M]. Redlands, USA: Environmental Systems Research Institute, 2002: 9-10.
[33] WACKERNAGEL H. Multivariate geostatistics: an introduction with applications [M]. New York: Springer Verlag, 2003: 6-7.
(Edited by FANG Jing-hua)
Foundation item: Project(51204074) supported by the National Natural Science Foundation of China; Projects(201309051, PM-zx021-201212-003, PM-zx021-201106-031) supported by the National Environmental Protection Public Welfare Industry Targeted Research Fund, China
Received date: 2012-08-10; Accepted date: 2012-11-24
Corresponding author: HU Xi-bang, Senior Engineer, PhD; Tel: +86-20-85620700; E-mail: hooyan@126.com
Abstract: A land use- and geographical information system-based framework was presented for potential human health risk analysis using soil sampling data obtained in Zhuzhou City, Hunan Province, China. The results show that heavy metal content in soil significantly differs among different land use types. In total, 8.3% of the study area has a hazard index (HI) above the threshold of 1.0. High HIs are recorded mainly for industrial areas. Arsenic (>87%) and the soil ingestion pathway (about 76%) contribute most to the HI. The mean standardized error and root-mean-square standardized error data indicate that the land use-based simulation method provides more accurate estimates than the classic method, which applies only geostatistical analysis to entire study area and disregards land use information. The findings not only highlight the significance of industrial land use, arsenic and the soil ingestion exposure pathway, but also indicate that evaluating different land use-types can spatially identify areas of greater concern for human health and better identify health risks.
