

Effects of sonic speed ??on location accuracy of acoustic emission source in rocks
LI Qi-yue, DONG Long-jun, LI Xi-bing, YIN Zhi-qiang, LIU Xi-ling
School of Resources and Safety Engineering, Central South University, Changsha 410083, China
Received 10 March 2011; accepted 14 September 2011
Abstract:
To quantitatively study the location errors induced by deviation of sonic speed, the line and plane location tests were carried out. A broken pencil was simulated as acoustic emission source in the rocks. The line and plane location tests were carried out in the granite rod using two sensors and the cube of marble using four sensors, respectively. To compare the position accuracy between line and plane positions, the line poison test was also carried out on the marble surface. The results show that for line positioning, the maximum error of absolute distance is about 0.8 cm. With the speed difference of 200 m/s, the average value of absolute difference from the position error is about 0.4 cm. For the plane positioning, in the case of the sensor array of 30 cm, the absolute positioning distance is up to 8.7 cm. It can be seen that the sonic speed seriously impacts on the plane positioning accuracy. The plane positioning error is lager than the line positioning error, which means that when the line position can satisfy the need in practical engineering, it is better to use the line position instead of the plane location. The plane positioning error with the diagonal speed is the minimum one.
Key words:
acoustic emission source; sonic speed; line location; plane positioning; rock;
1 Introduction
Geophysical methods, such as acoustic emission, microseismic monitoring, geotomography, and in-seam seismic techniques, have shown an increased significance in rock mechanics and mining engineering in recent decades [1, 2]. And the acoustic emission and microseismic monitoring have become the most important method to predict the rockburst hazards and microseismic evens in the deep level geotechnical engineering. Many countries, such as South Africa, Poland, Canada, the United States, Australia, China, India, Chile, Germany and Japan, have experienced different rockburst hazards at different time in some mines and tunnels [2-7]. The developments of seismic monitoring bring hope to predict the rockburst hazards.
As we all know, the prediction of time for rockburst is almost impossible, which likes the problem with the earthquake, but the prediction of space is entirely possible. The main objectives of the prediction of rockburst through routine seismic monitoring in mines are to indicate the locations of potential rockbursts associated with intermediate or large seismic events, and to detect spatio-temporal changes in seismic parameters and relate these changes to the stability of deformation within the volume of interest. This prediction would guide control measures and warnings to manage the exposure to potential rockbursts. Therefore, the seismological method of the prediction of the areal rockbursts is very important for rockburst control and warning in a mine, and the method to locate possible position of microseismic of pre-rockburst time effectively by a seismic monitoring system is the most important problem, which could ensure the safety of deep geotechnical engineering.
Many researchers have developed many acoustic emission or seismic source location techniques [8-13], and some of which were mature technologies and widely used in the positioning of acoustic emission or seismic source currently. However, all of them almost require a given sonic speed or practical measured sonic speed. The sonic speed is influenced by the materials, size andsurface conditions of transmission media and other factors.
When the input sonic speed is different from the real sonic speed of the measured object, the error would occur in the system. On the one hand, the average sonic speed is different from various regions, and the actual location of the occurrence of rock burst is not necessary in the area pre-determined sonic speed. On the other hand, the measured velocity is affected significantly by the distance between probes. When the distance is large, the measured sonic speed of the general container is 2800-3100 m/s, while that is about 5000-6000 m/s when the distance is small. Therefore, both of these conditions result in some errors between the average sonic speed of entering the positioning system and the actual area, and this would result in a huge position error [14, 15].
Generally, the locating error, caused by the sonic speed measurement deviation, is generally 10-50 m, even more, which would seriously affect the accuracy of rockburst prediction. It can be seen that the sonic speed measurements have seriously affected the positioning accuracy in the actual engineering and tests. It is possible to study the location accuracy induced by sonic speed. Therefore, the quantitative study for sonic speed ??effect on location accuracy of acoustic emission source was discussed in this work.
2 Measurement and analysis of sonic speeds for samples
The ultrasonic test of rock was widely applied to the field of rock mechanics. The dynamic elastic modulus, Poisson ratio and other parameters can be calculated by measuring the sonic speed. And the measurement of sonic speed is one of the most important parameters in the problems of acoustic emission source location. A site test result in a marble mine showed that longitudinal wave speed of 1390-6905 m/s with 80 ultrasound tests in various 8 locations, and the gap is enormous. Because there is damping in the probe, and regardless of how sharp electrical pulse launched, the probe vibration is always gradually increasing, therefore, the received waveform is gradually rising. The waveform and signal attenuation of the first time are influenced by the coupling ratio and the way of the probe. Therefore, the measurement accuracy of ultrasonic pulse method can only reach 1%-3% [16]. Several tests in no obvious defect on the rocks of naked eye were carried out by YOU [17], and it has found that compared with the average of several tests, the variability measured speeds is from 2.55% to 9.34%. It shows that the accurate measurement of longitudinal wave speed is very difficult to express by an average because of the anisotropy of the rocks.
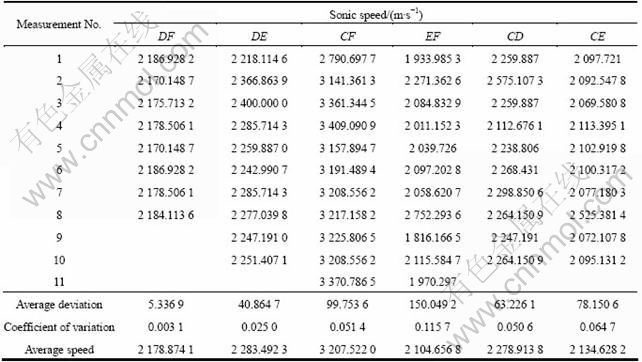
To quantitatively study the location errors induced by deviation of sonic speed, the line and plane location tests were carried out. A broken pencil was simulated as acoustic emission source in the rocks. For line location problem, the test was carried out in the cross section of 35 mm��35 mm, 500 mm-length rod of granite rock using two sensors. For the plane problem, the test was carried out in the 400 mm��400 mm cube of marble using four sensors. The direction of sonic speed measurements is shown in Fig. 1. The sonic speed measurement direction of line position sample is AB, the sonic speed measurement directions of plane position sample are DF, DE, CF, EF, CD, and CE on the face of the sample. Measurement results are shown in Tables 1 and 2. To compare the variation of the measurements, the average deviation, coefficient of variation, and average speed (m/s) are also listed in Tables 1 and 2. From the several measured results of sonic speed, it shows that the coefficient of variation for line position is smaller than six direction speeds of plane position.

Fig. 1 Diagram of locating samples and measurement directions: (a) Line location sample; (b) Plane location sample
Table 1 Measurement results of sonic speed in line position
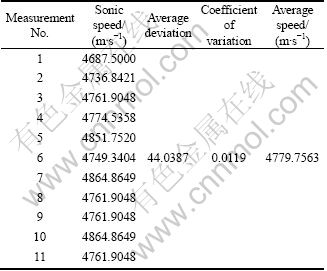
Table 2 Measurement results of sonic speed in plane position
3 Sonic speed ??effects on location accuracy of acoustic emission source
3.1 Location principle of acoustic emission
3.1.1 Line location problem
A problem of line location needs two sensors to record the trigger time from acoustic emission source, the diagram of a line location is shown in Fig. 2. The coordinates of sensors No. 1 and No.2 were expressed x1 and x2, respectively. The sonic speed was denoted as v; the coordinate of acoustic emission source was expressed as x0; the occurred time of acoustic emission source was expressed as t0; the trigger times of sensors No. 1 and No. 2 from acoustic emission were expressed as t1, t2, respectively. According to the distance equation, it can be expressed by
![]() (1)
(1)
![]() (2)
(2)
From Fig. 2, x2>x1, Eq. (1) minus Eq. (2), the coordinate of acoustic emission source can be calculated by
![]() (3)
(3)
where t1, t2, x1, x2, and v are known parameters; x0 is the unknown parameter, and x0 can be solved by Eq. (3).
![]()
Fig. 2 Diagram of line locating problem
3.1.2 Plane location problem
The function of the acoustic emission related with time can be expressed as
![]() (4)
(4)
where xi, yi and ti respectively express the 2D coordinate axis and the time of the ith sensor; x and y are the source locations of acoustic emission in 2D coordinate; t is the happened time of acoustic emission; v is the sonic speed (v>0). There are three undetermined coefficients including x, y, and t. Therefore, more than three sensors are needed to locate the source of acoustic emission. To eliminate the location errors, four sensors were used, as shown in Fig. 3. The theory of source location in acoustic emission is simple; however, it can lead to the mistaking location due to the asymmetry sonic speed and environmental noise. In order to eliminate the effects of asymmetry sonic speed, the influences of sonic speed on location results were studied in this work.
The time difference between the ith and jth sensors and their corresponding 2D coordinates can be written as
![]() (5)
(5)
where x and y are unknown parameters, and the others are known. The nonlinear fitting equation is can be resolved using Marquardt method.
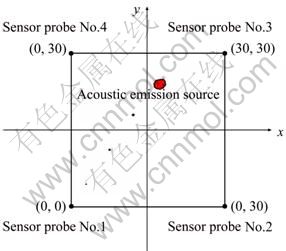
Fig. 3 Diagram of plan location
3.2 Tests of line and plane position
For the line location problem, a broken pencil was simulated as acoustic emission source in the rocks, and the test was carried out in the cross section of 35 mm�� 35 mm, 500 mm-length rod of granite rock using two sensors. Seven acoustic emission events and trigger times of two sensors are listed in Table 3. For the plane problem, a broken pencil was also simulated as acoustic emission source in the rocks, the test was carried out in the 400 mm��400 mm cube of marble using four sensors. To compare the position accuracy between line and plane positions, the line poison test was also carried out in the marble surface. Nine acoustic emission events and trigger times of four sensors are listed in Table 4. Figures 4 and 5 show the typical waves of the line and plane locations.
Table 3 Line location events and sensor trigger time
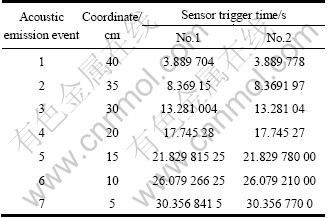
Table 4 Plane location events and sensor trigger time
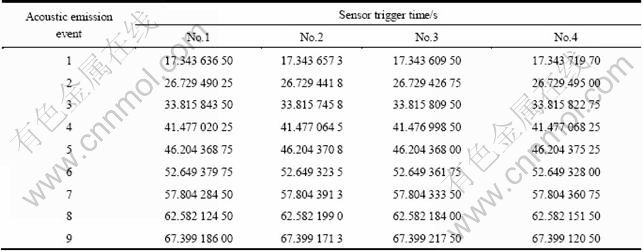
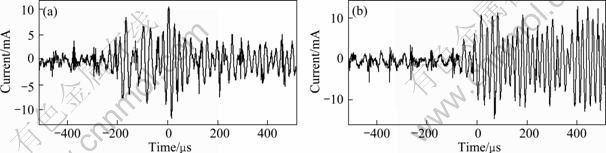
Fig. 4 Typical waves of line location: (a) Sensor No. 1; (b) Sensor No. 2
3.3 Position accuracy analysis under different levels of sonic speeds
According to measured speed results in Section 2, the location method described in Section 3.1, and the sensors triggered time of the acoustic emission source in Section 3.2, the coordinates of acoustic emission source were calculated. With different speed levels, the results of line and plane positions are shown in Tables 5 and 6.
To further analyze the impact of speed on the positioning accuracy, Fig. 6 shows errors of the absolute distance diagram under the different speed levels of line positioning, and Fig. 7 shows the positioning errors diagram of the absolute distance under different speeds of plane positioning.
From Fig. 6, it can be seen, for line positioning, the maximum error of absolute distance is about 0.8 cm. When the sonic speed is 4587.15 m/s, the error of absolute distance is up to the maximum; when the sonic speeds are 4736.8421, 4749.3404, 4774.5358, 4761.9048 m/s, the errors of absolute distances are relative small.
There are six events in the positioning error of about 0.2 cm. It can be got the granite bar quasi-real speed of 4 700 m/s or so. With the speed difference of 200 m/s, and the average value of absolute difference from the position error is about 0.4 cm.
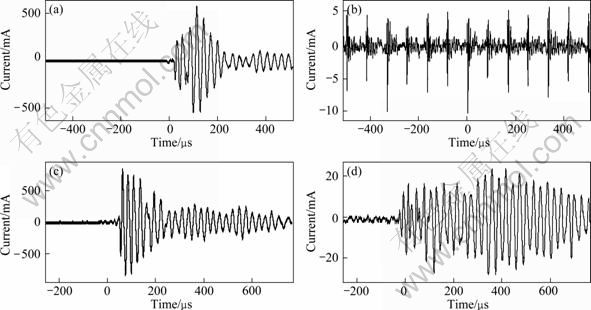
Fig. 5 Typical waves of plane location: (a) Sensor No. 1; (b) Sensor No. 2; (c) Sensor No. 3; (d) Sensor No. 4
Table 5 Real and calculated coordinates under various levels of sonic speeds for line position
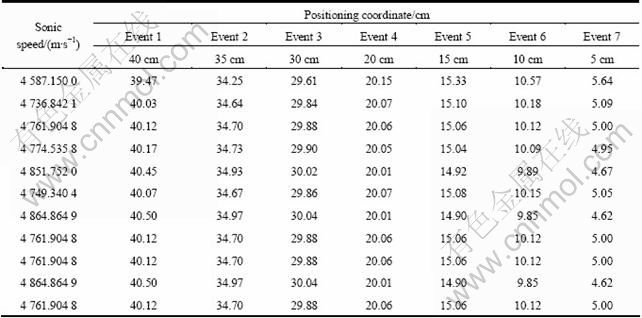
Table 6 Real and calculated coordinates under various levels of sonic speeds for plane position


Fig. 6 Errors of absolute distance under different speed levels of line positioning

Fig. 7 Positioning errors of absolute distance under different speed levels of plane positioning
For the plane positioning shown in Fig. 7, in the case of the sensor array of 30 cm, the absolute positioning distance is up to 5 cm, or 8.7 cm. It can be seen that the sonic speed seriously impacts on the plane positioning accuracy. Positioning average errors of absolute distance by six directions of DF, DE, CF, EF, CD, CE and the average speeds of six directions are 1.163924, 1.27231, 5.099751, 1.167377, 1.21937, 1.112782, and 1.445625 cm. It is found that the CF direction speed generated the maximum average location error of absolute distance, which is up to 5.099751 cm. CE and DF directions speed generated the relative minimum average location errors of absolute distance, which are 1.112782, and 1.163924 cm, respectively. It is also found a strange phenomenon that the results of positioning error by the average speed of six directions are not the minimum. On the contrary, the average error is second only to the largest CF, and this is not the same as the conventional understanding. It tells us the traditional position method based on pre-measurement average speed could bring big errors in practice engineering. And the average speed should be careful to strike.
The experimental study was based on samples of small size, and the degree of precision positioning certainly was higher than the work of the site microseisms project. Though, in the case of the sensor array of 30 cm, the absolute distance error is up to 5 cm, or 8.7 cm. Under the positioning of this fine work under the proportional calculation, in the practical engineering of the sensor array of 300 m, the average speed measured by pre-positioning, the positioning error may be up to 50-80 m. It is usually greater than this range, because the microseismic location in field work was seriously influenced by the existing roadway engineering, blasting, groundwater and various human factors, in which case, the results of microseismic monitoring is difficult to be convincing. Therefore, it is very necessary to study the new location method without using the average sonic speed, and the specific contents may see the literature.
To compare the position accuracy between line and plane location, line location test was also carried out in CE direction on cube marble surface, and the calculated result is consistent with the results of line location by granite rock sample. It shows that the plane positioning error is lager than the line position, which means that when the line position can satisfy the need in practical engineering, it is better to use the line position instead of the plane location. The above important conclusions can apply useful guidance to acoustic emission or microseismic source locations in practice engineering.
4 Conclusions
1) From the several measured results of sonic speed, it shows that the coefficient of variation for line position is smaller than six direction speeds of plane position.
2) For line positioning, the maximum error of absolute distance is about 0.8 cm. When the sonic speed is 4587.15 m/s, the error of absolute distance is up to the maximum. There are six events in the positioning error of about 0.2 cm. With the speed difference of 200 m/s, the average value of absolute difference from the position error is about 0.4 cm. For the plane positioning, in the case of the sensor array of 30 cm, the absolute positioning distance is up to 5 cm or 8.7 cm. It shows that the results of positioning error by the average speed of six directions is not the minimum, on the contrary the average error is second only to the largest CF. This is not the same as the conventional understanding. It tells us the traditional position method based on pre-measurement average speed could bring big errors in practice engineering. And the average speed should be careful to strike.
3) The plane positioning error is lager than the line positioning error, which means that when the line position can satisfy the need in practical engineering, it is better to use the line position instead of the plane location. The experimental study is based on samples of small size, and the degree of precision positioning certainly is higher than the work of the project site microseisms. In the practical engineering of a 300 m sensor array, the positioning error may be up to 50-80 m. It is usually greater than this range.
References
[1] MILEV A M, SPOTTISWOODE S M, RORKE A J, FINNIE G J. Seismic monitoring of a simulated rock burst on a wall of an underground tunnel [J]. Journal of the South African Institute of Mining and Metallurgy, 2001, 101(5): 253-260.
[2] THEODORE I U, TRIFU C I. Recent advances in seismic monitoring technology at Canadian mines [J]. Journal of Applied Geophysics, 2000, 45(4): 225-237.
[3] WANG H L, GE M C. Acoustic emission/microseismic source location analysis for a limestone mine exhibiting high horizontal stresses [J]. International Journal of Rock Mechanics and Mining Sciences, 2008, 45(5): 720-728.
[4] GE M C. Efficient mine microseismic monitoring [J]. International Journal of Coal Geology, 2005, 64(1-2): 44-56.
[5] HIRATA A, KAMEOKA Y, HIRANO T. Safety management based on detection of possible rock bursts by AE monitoring during tunnel excavation [J]. Rock Mechanics and Rock Engineering, 2007, 40(6): 563-576.
[6] YANG C X, LUO Z Q, HU G B, LIU X M. Application of a microseismic monitoring system in deep mining [J]. Journal of University of Science and Technology Beijing, 2007, 14(1): 6�C8.
[7] XU Nu-wen, TANG Chun-an, SHA Chun, LIANG Zheng-zhao, YANG Ju-ying, ZOU Yan-yan. Microseismic monitoring system establishment and its engineering applications to left bank slope of Jinping I hydropower station [J]. Chinese Journal of Rock Mechanics and Engineering, 2010, 29(5): 915-935. (in Chinese)
[8] TIAN Yue, CHEN Xiao-fei. Review of seismic location study [J]. Progress in Geophysics, 2002, 17(1): 147-155. (in Chinese)
[9] LIENERT B R, BERG E, FRAZER L N. Hypocenter: An earthquake location method using centered, scaled, and adaptively damped least squares [J]. Bulletin of the Seismological Society of America, 1986, 76(3): 771-783.
[10] LEI X, MASUDA K, NISHIZAWA O. Detailed analysis of acoustic emission activity during catastrophic fracture of faults in rock [J]. Journal of Structural Geology, 2004, 26: 247-258.
[11] SILENY J, MILEV A. Source mechanism of mining induced seismic events: Resolution of double couple and non double couple models [J]. Tectonophysics, 2008, 456: 3-15.
[12] ALBER M, FRITSCHEN R, BISCHOFF M. Rock mechanical investigations of seismic events in a deep long wall coal mine [J]. International Journal of Rock Mechanics and Mining Sciences, 2009, 46: 408-420.
[13] MERCER R A, BAWDEN W F. A statistical approach for the integrated analysis of mine-induced seismicity and numerical stress estimates, a case study. Part I: Developing the relations [J]. International Journal of Rock Mechanics and Mining Sciences, 2005, 42: 47-72.
[14] LI X B, DONG L J. Comparison of two methods in acoustic emission source location using four sensors without measuring sonic speed [J]. Sensor Letters, 2011, 9(5): 2025-2029.
[15] DONG Long-jun, LI Xi-bing, TANG Li-zhong, GONG Feng-qiang. Mathematical functions and parameters for microseismic source location without pre-measuring speed [J]. Chinese Journal of Rock Mechanics and Engineering, 2011, 30(10): 2057-2067. (in Chinese)
[16] CHEN Yong. Mechanical properties of earth shell rock ��Theoretical foundation and experimental methods [M]. Beijing: Earthquake Press, 1988. (in Chinese)
[17] YOU Ming-qing. Mechanical properties of rocks [M]. Beijing: Geological Publishing House, 2007: 235-238. (in Chinese)
��ʯ���ٶȶ�������Դ��λ���ȵ�Ӱ��
������, ��¤��, ��Ϧ��, ��־ǿ, ��ϣ��
���ϴ�ѧ ��Դ�밲ȫ����ѧԺ����ɳ 410083
ժ��Ҫ��Ϊ�����о���ʯ���ٶ�����ƫ���������Դ��λ���ȵ�Ӱ�죬�ֱ��һά�ߺͶ�άƽ���������ʯ��������Դ��λ����������顣�����߶�λ�����û������Ҹˣ�����ƽ�����⣬��������������ң���Ǧ��о�۶ϵ�����ģ��������Դ��Ϊ�Ƚ��߶�λ��ƽ�涨λ�ľ��ȣ��ڴ������ϱ���������Ͻ����߶�λ�����ٶȵĶ�β�������������߶�λ���ٶȱ���ϵ����ƽ�涨λ��������ҪС���о����֣������߶�λ�����Ծ�����������0.8 cm���ң����ٶ����200 m/s ʱ�����Ծ��붨λ������0.4 cm���ң�����ƽ�涨λ���ڴ�����30 cm����������£����Ծ��붨λ�ߴ�5 cm������8.7 cm���ɼ���ƽ�涨λ�ٶ�����Ӱ�춨λ���ȣ�ƽ�涨λ�����߶�λ����˵���ڹ���ʵ���У������߶�λ��������⾡�������涨λ���볣����ʶ��һ�µ��ǣ�ƽ�涨λ��6�������ٶȵ�ƽ��ֵ�Ķ�λ���Ȳ�����С�ģ����Խ������ٶȵľ�ֵ�Ķ�λ������С��
�ؼ��ʣ� ������Դ�����٣��߶�λ��ƽ�涨λ����ʯ
(Edited by LI Xiang-qun)
Foundation item: Projects (50934006, 10872218) supported by the National Natural Science Foundation of China; Project (2010CB732004) supported by the National Basic Research Program of China; Project (kjdb2010-6) supported by Doctoral Candidate Innovation Research Support Program of Science & Technology Review, China
Corresponding author: DONG Long-jun; Tel: +86-18711191205; E-mail: csudlj@163.com
DOI: 10.1016/S1003-6326(11)61115-1
Abstract: To quantitatively study the location errors induced by deviation of sonic speed, the line and plane location tests were carried out. A broken pencil was simulated as acoustic emission source in the rocks. The line and plane location tests were carried out in the granite rod using two sensors and the cube of marble using four sensors, respectively. To compare the position accuracy between line and plane positions, the line poison test was also carried out on the marble surface. The results show that for line positioning, the maximum error of absolute distance is about 0.8 cm. With the speed difference of 200 m/s, the average value of absolute difference from the position error is about 0.4 cm. For the plane positioning, in the case of the sensor array of 30 cm, the absolute positioning distance is up to 8.7 cm. It can be seen that the sonic speed seriously impacts on the plane positioning accuracy. The plane positioning error is lager than the line positioning error, which means that when the line position can satisfy the need in practical engineering, it is better to use the line position instead of the plane location. The plane positioning error with the diagonal speed is the minimum one.
