
J. Cent. South Univ. Technol. (2007)04-0514-06
DOI: 10.1007/s11771-007-0100-6![]()
Microwave digestion polarography for determining seven trace elements in Salvia Miltiorrhiza Root and compound Salvia Miltiorrhiza Root injection simultaneously
HUANG Yi(�� ��)1,2, ZHANG Tai-ming(��̩��)1, CAO Juan(�� ��)1, LIANG Yi-zeng(������)1
(1. School of Chemistry and Chemical Engineering, Central South University, Changsha 410083, China;
2. Department of Chemistry and Life Science, Xiangnan University, Chenzhou 423000, China)
________________________________________________________________________________________
Abstract��The sensitive second derivative waves of Cu(��), Pb(��), Cd(��), Ni(��), Zn(��), Fe(��) and Mn(��), forming in the substrate solution (pH=9.26) consisting of ammonia, ammonium chlorid, gelatin and ascorbic acid were researched. The peak potentials of the polarographic waves of the seven ions are at about -0.48, -0.63, -0.79, -1.04, -1.28, -1.44 and -1.60 V respectively. Combining with microwave technique, a new method for the simultaneous determination of the seven trace elements in Chinese traditional medicine was developed. The method is easy to operate, rapid, simple and convenient. When the signal-to-noise rate equals 3, the detection limits of Cu, Pb, Cd, Ni, Zn, Fe and Mn are 4.2��10-3, 5.3��10-3, 2.1��10-3, 5.8��10-4, 3.0��10-3, 7.7��10-4 and 1.1��10-3 ��g/mL respectively. Well linear relationships exist between the concentrations and the peak currents when Cu, Pb, Cd, Ni, Zn, Fe and Mn concentrations are within 8.5��10-3-10, 9.7��10-3-10, 4.5��10-3-10, 1.2��10-3-10, 6.4��10-3-10, 1.5��10-3-10 and 2.8��10-3-10 ��g/mL, respectively. The method has been used to the simultaneous determination of the seven trace elements in Salvia Miltiorrhiza Root and compound Salvia Miltiorrhiza Root injection, the relative standard deviations(RSDs) of the Cu, Pb, Cd, Ni, Zn, Fe and Mn in the two medicines are 3.9% and 5.8%, 4.0% and 4.1%, 4.3% and 5.7%, 4.9% and 5.3%, 4.4% and 4.7%, 3.5% and 4.0%, 0.51% and 2.8%, respectively; the comparisons of the determination results with the values obtained by the standard method indicate that the presented method has very well veracity.
Key words:
________________________________________________________________________________________
1 Introduction
In Chinese traditional medicines, many microelements have important roles in biological functions of vitamins, hormones, enzymes, some proteins and so on. They take a very important place for the disease cure and life health of human being, so that they are intituled ��life elements��. Therefore, the determinations of the contents of the microelements in Chinese traditional medicines have very important significance[1] for the researches on the medicinal effect and the metabolism dynamics. Different techniques and methods are usually required for the determinations of the microelements in Chinese traditional medicines. Atomic absorption spectrometry (AAS)[1], inductively coupled plasma (ICP) technology[2], cathodic stripping voltammetry[3] and gas chromatography(GC)[4] have been used in the determination of the microelements in plant medicines, synthetic pharmaceuticals and their raw materials. However, it is quite difficult to determine the microelements in Chinese traditional medicine exactly. AAS has been used mostly for these purposes. However, this method is unable to be used in simultaneous multi-element determination, moreover, the determinations of some elements such as selenium, arsenic, tin and so on have to be made by hydride generation; many interferences and matrix effects affect this analytical technique, and also some losses may take place because of volatilizations during treating with the samples, which causes poor sensitivity and reproducibility. Induction coupling plasma-mass spectrum(ICP-MS) is universally recognized as a good technology for simultaneous multi-element determination because it has not spectrum interferences in induction coupling plasma-atom emission spectrum(ICP-AES). However, not only its instrument is extortionate and the run cost very high, but also it has certain extent of mass spectrum interference. Because of the possibility to have same mass-charge ratios (m/z), coexisting element, oxide, hydroxide and multi-atom group ions may interfere badly with the determination of many microelements, especially some life elements[5]. The advantages of voltammetry are that it requires inexpensive instrumentation, has ability for multi-element determination[6-8], and is capable of determining elements accurately at trace and ultra trace levels[9]. In recent years, there have been many reports of voltammetric research on the complex adsorption polarography for single micro-elements such as copper[10], cadmium[11], nickel[12], selenium[13], Moly- bdenum[14], mercury[15]. However the complex adsorption wave polarographic system for the simultaneous determination of the trace multi-elements is seldom researched. A simple, convenient, sensitive and exact polarography for the simultaneous determination of copper, lead, cadmium, nickel, zinc, iron and manganese in Chinese traditional medicines was established in this paper.
2 Experimental
2.1 Reagents and standards
The reagents were as follows: the buffer solution (pH=9.26, 20 ��) consisting of ammonia liquor (3.0 mol/L) and ammonium chloride (3.0 mol/L); gelatin(1.0 g/L); ascorbic acid solution (8.0 g/L, prepared just before use); hydrochloric acid; hydrogen peroxide; sodium hydroxide. The concentrations of the stock standard solutions of copper, lead, cadmium, nickel, zinc, iron and manganese were 2.100, 8.000, 2.670, 0.200, 2.650, 0.621, 1.160 g/L, respectively. The standard stock solutions were prepared with relevant primary standard substances, and the others were prepared with analytical grade reagents. Bi-distillated water was used.
2.2 Instrumentation
An oscilloscopic polarograph (Model JP-303, Chengdu Analytical Instrument Factory, Chengdu) with a three-electrode (mercury drop-platinum-saturated calomel) system, a photic-fibre-pressure-automation- microwave oven for dissolving samples (Model MK-1, Shanghai Xinke Application Institute of Microwave Technology, Shanghai) and a pH meter (Model 25, Shanghai Exact Science Instrument Ltd., Shanghai) were used.
2.3 Procedure
2.3.1 Digestion of samples
1 g of the powder Salvia Miltiorrhiza Root samples dried in a desiccation box (105 ��) until constant mass was accurately weighed (or 10 mL of compound Salvia Miltiorrhiza Root injection) and added into a Teflon digestion jar. Add 4.0 mL of HCl (6.0 mol/L) and 1.0 mL of H2O2 (30%) in it, place it in the microwave oven to heat for 4.0 min of the digestion after covering its top to make it airproof. The material in it was digested 2-3 times for the powder sample or 1-2 times for the injection, and the digestion jar was cooled with fluid water whenever the digestion was over. The digestion solutions should be transparent, and all of them were quantificationally transferred into a 50 mL calibrated flask by rinsing with water, diluting to the mark with water and shaking up after adding 6 mol/L NaOH (about 3.0n mL, n is the digestion times) to weak acidity. The solution was kept in Teflon bottle in a refrigerator for standby.
2.3.2 Polarographic determination
Adequate amounts of copper, lead, cadmium, nickel, zinc, iron and manganese standard solutions or sample solution, 5.0 mL of the ammonia-ammonium chloride solution, 4.0 mL of the ascorbic acid solution, 1.0 mL of the gelatin solution were added in proper order into 50 mL volumetric flasks. The mixture was diluted to the mark and shaken up, and then transferred into small beakers. Cathode second derivative wave scan was carried out from -0.30 to -1.75 V at 500 mV/s scan rate, and the current peaks of Cu(��), Pb(��), Cd(��), Ni(��), Zn(��), Fe(��) and Mn(��) at about -0.48, -0.63, -0.79, -1.04, -1.28, -1.44 and -1.60 V were recorded respectively, determining the peak current of the blank under the same conditions at the same time. The trace elements in the sample were determined by standard additions.
3 Results and discussion
In oscilloscopic polarographic analysis(OPA), the commonly-used-polarographic waves are routine, first and second derivative waves. The latter two not only have higher distinguishability than the former but also can get rid of baseline drift. In addition, the derivative waves are suitable for wider range of scan potential than the routine oscilloscopic polarography, cyclic voltammetry, striping voltammetry and pulse polarography. Therefore, on determining trace elements in a complex system, the derivative wave is generally used. The analysts prefer the second to the first for determining trace elements in complex samples because the second derivative wave is in general better in wave form than the first one. Therefore, in this experiment, the research on the polarographic method and the determination of the trace elements in Salvia Miltiorrhiza Root and compound Salvia Miltiorrhiza Root injection were carried out by using second derivative wave.
3.1 Reduction behaviour of Cu(��), Pb(��), Cd(��), Ni(��), Zn(��), Fe(��) and Mn(��)
The scan curves of current-voltage are shown in Fig.1, which were acquired by scanning solution a (ammonia(0.30 mol/L)+ammonium chloride(0.30 mol/L) +ascorbic acid(0.64 g/L)+gelatin (0.02 g/L)) and solution b(a+Cu(��)(3.2��10-5 mol/L)+Pb(��)(3.3��10-5 mol/L) +Cd(��)(3.3��10-6 mol/L) + Ni(��)(3.4��10-6 mol/L)+ Zn(��)(8.4��10-6 mol/L-1)+Fe(��)(4.9��10-6 mol/L-1)+ Mn(��)(7.3��10-6 mol/L)) respectively, in second derivative wave manner through two steps and from -0.30 to -1.75 V. It can be seen from Fig.1 that, at pH= 9.26, the reduction currents of the substrate-solution components are absent in the potential range; the peak potentials corresponding to the reduction currents of Cu(��), Pb(��), Cd(��), Ni(��), Zn(��), Fe(��), and Mn(��) are at about -0.48, -0.63, -0.79, -1.04, -1.28, -1.44 and -1.60 V, respectively, which differ by more than 150 mV from each other. Therefore, the trace Cu(��), Pb(��), Cd(��), Ni(��), Zn(��), Fe(��) and Mn(��) do not interfere with each other in their determination.
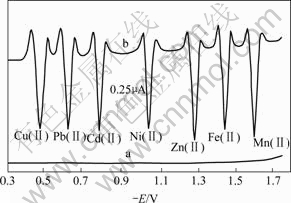
Fig.1 Reduction characters of Cu(��), Pb(��), Cd(��), Ni(��), Zn(��), Fe(��), Mn(��) and components in substrate solution at potential scan rate of 500 mV/s, 59.98 kPa and 15 ��
(a) Solution a; (b) Solution b
3.2 Effect of acidity
The results of experiment indicate that the acidity influences all of the peak current Ip and potential Ep. The currents of Pb(��), Cd(��), Ni(��), Zn(��) and Fe(��) in the substrate solution are stronger and stabler at pH about 9.26, and only those of Cu(��) and Mn(��) lower slightly at the pH. When the concentration ratio of ammonia and ammonium chloride is changed, all of the peak potentials of Cu(��), Pb(��), Cd(��), Ni(��), Zn(��), Fe(��) and Mn(��) linearly decrease with the increase of the pH value and the linear relation equations are Ep(Cu)=-0.21-0.029pH, Ep(Pb)=-0.37-0.028pH, Ep(Cd)= -0.53-0.028pH, Ep(Ni)=-0.76-0.030pH, Ep(Zn)=-1.01- 0.029pH, Ep(Fe)=-1.17-0.029pH and Ep(Mn)=-1.34- 0.028pH (V, 25 ��), respectively. This shows that H+ takes part in relevant electrode reactions. In addition, from the slopes in the relation equations between the peak potentials of the metal ions and the pH value, it is seen that the variation of acidity has no apparent effect on the differences(��Ep) between the peak potentials of the metal ion compounds. The results of experiment also show that if the acidity is too high, the peak currents will decrease because the protonation of the nitrogen atom in ammonia molecule lowers the stabilities of the M(��)-NH3 compounds (M(��)=Cu(��), Pb(��), Cd(��), Ni(��), Zn(��), Fe(��) or Mn(��)). However, when the acidity is too low, the peak currents will also decrease because the concentration of the hydronium that takes part in the relevant electrode reactions decreases and the hydrolyses of the metal ions are likely to take place. An NH3-NH4Cl buffer solution (pH = 9.26) was selected to control the acidity of the test solutions.
3.3 Adsorbability of complexes on electrode
3.3.1 Electrocapillary curve
The experimental electrocapillary curves are shown in Fig.2. From Fig.2, it may be seen that when one of the seven ions exists in the solution, the height of the electrocapillary curve is commonly lower than that of the pure substrate solution (only Mn(��) and Fe(��) complexes make an exception in the ranges of �C10-�C110 mV and �C10-�C300 mV, respectively), which shows that all the M(��)-NH3 complexes can be adsorbed on the electrode. It may also be seen that the relative intensity of the adsorbabilities of the metal complexes is:
Cd(��)��Pb(��)��Cu(��)��Ni(��)��Zn(��)��Mn(��)��Fe(��)

Fig.2 Electrocapillary curves of solutions containing different components at 53.32 kPa and 21 ��; (t is the time needed by the falls of 20 drops of mercury)
1�� Substrate solution (ammonia (0.30 mol/L)+ammonium chloride(0.30 mol/L)+ascorbic acid (0.64 g/L )+gelatin (0.02 g/L)); 2��Substrate solution + Fe(��)(4.9��10-6 mol/L);3��Substrate solution + Mn(��)(7.3��10-6mol/L);4��Substrate solution + Zn(��)(8.4��10-6 mol/L);5��Substrate solution + Ni(��)(3.4��10-6 mol/L);6��Substrate solution+Cu(��)(3.2��10-5mol/L);7��Substrate solution+Cd(��) (3.3��10-6mol/L);8��Substrate solution+Pb(��)(3.3��10-5 mol/L)
In addition, the abscissa of the zero-charge points of the electrocapillary curves of all metal ion complexes move towards the left. This shows that the complex ions have positive charge, that is, the ligands or main ligands in the metal ion complexes are NH3 molecules. From the slopes of the above-mentioned linear relation equations between the peak potentials and pH value, it may be seen that two electrons take part in the electrode reaction for the seven ion complexes.
3.3.2 Relationships between peak current and temperature
The solution was prepared according to section 2.3.2 and heated to 45 ��, and then cooled naturally. The peak currents of the M(��) complexes were recorded at different temperatures. The results show that each of the peak currents of the complex polarographic waves increases with the rise in the temperature below the maximum-peak-current-correspondence temperature but decreases with the rise in temperature above that (see Fig.3). The reason is as follows. The rise in temperature makes the diffusion of the complex ion in the solution more rapid, more ions of the complexes arrive at the electrode in a given time and are adsorbed on the surface, thus increasing the peak currents. When the temperature is equal to the maximum-peak-current-correspondence temperature, the adsorption process influenced by the diffusion effect and its reverse process, and desorption process are in equilibrium because the increase in temperature makes more rapid desorption. Therefore, the peak current of the adsorption wave increases no longer reaching its maximum. When the temperature is above that corresponding to the maximum peak current, the adsorption has the advantage over the adsorption because the adsorbed complex desorbs easily at higher temperature, thus the peak current decreases with the rise of temperature. The variations of the peak currents with temperature show that the polarographic waves of the seven complexes in the substrate solution have obvious adsorbability. The maximum-peak-current temperatures of the Cd(��), Pb(��), Cu(��), Ni(��), Zn(��), Mn(��), Fe(��) are 40.0, 39.0, 35.0, 34.5 , 32.5, 32.0, 30.0 �� respectively, that is, the relative order of the adsorbability intensities of the metal complexes is
Cd(��)��Pb(��)��Cu(��)��Ni(��)��Zn(��)��Mn(��)��Fe(��).

Fig.3 Relations between peak currents and temperature at potential scan rate of 500 mV/s and 59.98 kPa
1��Substrate solution + Mn(��)(7.3��10-6 mol/L);2��Substrate solution + Zn(��)(8.4��10-6 mol/L);3��Substrate solution + Fe(��)(4.9��10-6 mol/L);
4��Substrate solution + Cu(��)(3.2��10-5 mol/L);5��Substrate solution + Cd(��) (3.3��10-6 mol/L);
6��Substrate solution + Pb(��)(3.3��10-5 mol/L);7��Substrate solution+Ni(��)(3.4��10-6 mol/L)
It agrees basically with the conclusion from the experiment about electrocapillary curves mentioned above.
3.3.3 Relationships between peak currents and potential scan rate
The experimental results show that the relations between the peak currents of the polarographic waves of the seven complexes and the potential scan rate are linear. The 1inear regression equations are: Ip(Cu)=1.003 5+0.000 2v, Ip(Pb) =0.965 7+0.000 3v, Ip(Cd) =1.004 7+0.000 2v, Ip(Ni)=0.984 7+0.000 01v, Ip(Zn)=0.707 5+0.000 9v, Ip(Fe) =1.008 5+0.000 1v and Ip(Mn)= 0.917 8+0.000 5v respectively, and the correlation coefficients are 0.997 1, 0.995 4, 0.997 4, 0.995 5, 0.997 6, 0.996 5, 0.993 0 in turn. According to the theory on polarographic adsorption wave, it is obvious that the polarographic waves are absorbable.
3.4 Amounts of reagents used
3.4.1 Ammonium chloride, ammonia and their buffer
Ammonium chloride acts as a supporting electrolyte; ammonia is the ligand of the metal complexes, and the results of the experiment show that all of the peak currents of the complex adsorption waves have tended to be constant when the analytical concentration of NH3 is higher than 0.20 mo1/L. The buffer system formed by iso-concentration of NH4C1 and NH4OH may control the pH value of the solution at about 9.26. We adopted 5.0 mL of the buffer solution consisting of ammonia (3.0 mo1/L) and ammonium chloride (3.0 mo1/L) for this.
3.4.2 Ascorbic acid
Ascorbic acid serves as a phlogistication and stabilization agent. It is shown experimentally that in the absence of ascorbic acid, it is difficult to determine the trace Cu(��), Pb(��), Cd(��), Ni(��), Zn(��), Fe(��) and Mn(��). Especially, because of oxidation of the Fe(��), the peak current of the Fe(��) complex adsorption wave would fast decrease in the absence of ascorbic acid in the solution; however, on adding more than 2.5 mL of ascorbic acid (8.0 g/L) in the substrate solution, the peak current would be invariable for at least 45 min. Ascorbic acid can also reduce higher-valent ions that are likely to exist in the solution into lower-valent ones. The adopted amount of the ascorbic acid solution was 4.0 mL.
3.4.3 Gelatin
Because of the absence of maximum inhibitor in the solution, the repeatabilities of the determinations and the linear relations between the peak currents and relevant ion concentrations are very poor. In the experiments, 1.0 mL of the gelatin(1.0 g/L) was chosen as the maximum inhibitor.
3.5 Time
The results show that, in the polarographic system, not only are the coordination reactions of the seven metal ions very rapid but also all of the complexes are of good stability. The stable times of peak current intensities of all M(��) ions except that of Fe(��)(��45 min) are longer than 24 h.
3.6 Calibration curves
The calibration curves of the seven ions in the substrate solution chosen were determined. Good linear relationships exist between the peak currents and the concentrations when copper, lead, cadmium, nickel, zinc, iron and manganese concentrations are within 8.5��10-3-10, 9.7��10-3-10, 4.5��10-3-10, 1.2��10-3-10, 6.4��10-3-10, 1.5��10-3-10 and 2.8��10-3-10 ��g/mL, respectively. The corresponding correlation coefficients are 0.997, 0.997, 0.996, 0.998, 0.996, 0.998 and 0.997, respectively. When the signal-to-noise rate equals 3, the detection limits of copper, lead, cadmium, nickel, zinc, iron and manganese are 4.2��10-3, 5.3��10-3, 2.1��10-3, 5.8��10-4, 3.0��10-3, 7.7��10-4 and 1.1��10-3 ��g/mL1, respectively.
3.7 Interference
The experimental results about the influences of diverse ions that are likely to exist in the test solution show that a quantity of ions such as F-, Cl-, Br-, SO42-, NO3-, ClO3-, PO43-, P2O74-, HP2O73- and Li+, Na+, K+, NH4+, Sr2+, Ba2+ do not influence the determinations of Cu(��), Pb(��), Cd(��), Ni(��), Zn(��), Fe(��) and Mn(��); the tolerance limits of other coexisting ions, that is, the mass concentration times corresponding to 1.0��10-2 ��g/mL of M(��)(5% relative error), are respectively,Al3+, W(��), Mo(��)(40 000), Ca2+(16 000), Mg2+(4 800), Ge2+, Hg2+(4 000), Sn(��)(3 200), Si(��)(2 000), Bi3+ (1 600), As(��)(44), B3+, In3+ (80), Sb3+ (11), Ti3+, Be2+(10), Cr3+, V(��)(5), Ag+ (4), Co2+(3).
3.8 Application of method
Both Salvia Miltiorrhiza Root and compound Salvia Miltiorrhiza Root injection were from Laobaixing Great Drugstore in Changsha, Hunan, China. According to section 2.3, the contents of the copper, lead, cadmium, nickel, zinc, iron and manganese in the samples were determined by the standard addition method (method A). The scan curve of current-voltage of the actual sample is shown in Fig.4, and the results by comparison with those of relevant standard reference method, that is, AAS(method B)[16] are shown in Tables 1 and 2. It is obvious from the comparison of Fig.1 and Fig.4 that other components in Chinese traditional medicine have not almost influence on the polarographic peak potentials of Cu(��), Pb(��), Cd(��), Ni(��), Zn(��), Fe(��), and Mn(��). On carrying out the determination by method A, the RSDs of the Cu, Pb, Cd, Ni, Zn, Fe and Mn determinations are 3.9% and 5.8%, 4.0% and 4.1%, 4.3% and 5.7%, 4.9% and 5.3%, 4.4% and 4.7%, 3.5% and 4.0%, 0.51% and 2.8%, respectively, while those of these metal determinations by method B are 3.8% and 6.3%, 4.0% and 4.2%, 4.5% and 6.8%, 5.1% and 7.1%, 4.3% and 4.6%, 3.8% and 4.6%, 2.7% and 5.6% separately. From the results in Table 1, it may be seen that the measurements attained by method A accord basically with those by method B, and the precision of the former is better than that of the latter. At the same time, it may also been seen that there are abundant microelements vital to the human body such as Cu, Cd, Ni, Zn, Fe, Mn in the Salvia Miltior rhiza Root and compound Salvia Miltiorrhiza Root injection, the Cd content is appropriate, but the Pb content is on the high side.
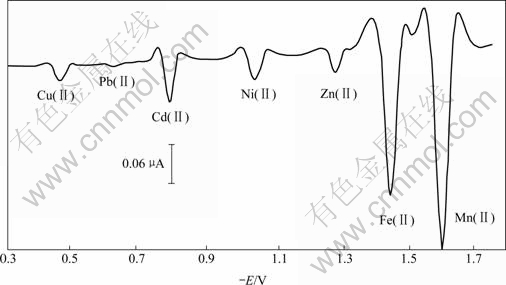
Fig.4 Second derivative waves of Cu(��), Pb(��), Cd(��), Ni(��), Zn(��), Fe(��), Mn(��) in solution of actual sample at 59.98 kPa and 17 ��
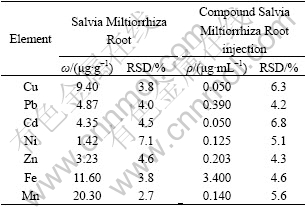
Table 1 Analytical results of Cu, Pb, Cd, Ni, Zn, Fe, Mn in Salvia Miltiorrhiza Root and compound Salvia Miltiorrhiza Root injection by method A(means, parallel measurements 5)

Table 2 Analytical results of Cu, Pb, Cd, Ni, Zn, Fe, Mn in Salvia Miltiorrhiza Root and compound Salvia Miltiorrhiza Root injection by method B(means, parallel measurements 5)
4 Conclusions
1) The polarographic waves of Cu(��), Pb(��), Cd(��), Ni(��), Zn(��), Fe(��), Mn(��) in ammonia- ammonium chloride-ascorbic acid-gelatin substrate solution have obvious adsorbability.
2) Two electrons take part in the electrode reaction for the seven ion complexes, and H+ also takes part in these electrode reactions.
3) The presented method for the simultaneous determination of trace copper, lead, cadmium, nickel, zinc, iron and manganese in aqueous solutions, especially in the digestion solutions of the samples of Chinese traditional medicines, is easy to operate, rapid and sensitive, and has good selectivity, precision and accuracy; the instrument is very cheap and the cost for analysis is tiny.
4) Combining with the microwave digestion technique, the method is used very successfully for simultaneous determination of the trace Cu, Pb, Cd, Ni, Zn, Fe and Mn in different Chinese traditional medicines without any other pretreatments.
Reference
[1] SOLTYK K, LOZAK A, OSTAPCZUK P, et al. Determination of chromium and selected elements in multimineral and multivitamin preparations and in pharmaceutical raw material[J]. J Pharmaceut and Biomed Anal, 2003, 32(3): 425-432.
[2] CHENG Fa-liang, NING Man-xia, MO Jin-yuan, et al. Study on the determination of microelements in lychee fruit[J]. Spectroscopy and Spectral Analysis, 2002, 22(4): 676-678. (in Chinese)
[3] INAM R, SOMER G. Determination of selenium in garlic by cathodic stripping voltammetry[J]. Food Chem, 1999, 66(3): 381-385.
[4] CIZKOVA H, KUBEC R, KOPLIK R, et al. Determination of some microelements in plant medicines by gas chromatography[J]. J Davidek Potravin Vedi, 1997, 15: 197-210.
[5] ZHAO Wen-kuan, HE Fei, FANG Cheng, et al. Instrument Analysis[M]. Beijing: Higher Education Press, 2005: 89-90. (in Chinese)
[6] G?LER S, TASKOPARAN Y ?. Interference between selenium and some trace elements during polarographic studies and its elimination[J]. Talanta, 2005, 65(2): 598-602.
[7] G?LER S, ?LK? ?. A new and direct method for the trace element determination in cauliflower by differential pulse polarography[J]. Talanta, 2004, 62(2): 323-328.
[8] ZHANG Ming-hao; LIANG Yi-zeng. Rapid and simultaneous determination of copper, cadmium, nickel and cobalt in zinc electrolyte solutions by complex adsorption wave polarography[J]. JTMT, 2002, 20(1): 1-14.
[9] INAM R, SOMER G. Differential pulse polarographic determination of trace selenium(IV) and molybdenum(VI) using the catalytic hydrogen wave[J]. Talanta, 1999, 50(3): 609-616.
[10] FERNANDO G, SOLIS VELIA M. Adsorptive square-wave voltammetry applied to study the reduction mechanism of Cu�Csulfoxine and Cu�Cferron complexes[J]. Journal of Electroanalytical Chemistry, 2003, 544: 1-11.
[11] GARAY F, SOL?S V. Square wave stripping voltammetry of Cd�Coxine complexes; surface redox reactions[J]. Journal of Electroanalytical Chemistry, 1999, 476(2): 165-170.
[12] de ALWIS C, CRAYSTON J A, CROMIE T, et al. Cyclic voltammetry study of the electrocatalysis of carbon dioxide reduction by bis(polyazamacrocyclic) nickel complexes[J]. Electrochimica Acta, 2000, 45(13): 2061-2074.
[13] ALANYALIOGLU M, DEMIR U, SHANNON C. Electrochemical formation of Se atomic layers on Au(��) surfaces: the role of adsorbed selenate and selenite[J]. Journal of Electroanalytical Chemistry, 2004, 561: 21-27.
[14] SUN Yuh-Chang, MIERZWA J, LAN Chi-ren. Direct determination of molybdenum in seawater by adsorption cathodic stripping square-wave voltammetry[J]. Talanta, 2000, 52(3): 417-424.
[15] GARAY F. Adsorptive square wave voltammetry of metal complexes. Effect of ligand concentration. Part IV. Experimental applications on Hg�Cferron complexes[J]. Journal of Electroanalytical Chemistry, 2003, 548: 11-18.
[16] QIAN Xiao-hong, XIE Jian-wei. Applications of Modern Instrument Analyses in Biomedicine Study[M]. Beijing: Chemical Industry Press, 2003: 260-264. (in Chinese)
_____________________________
Foundation item: Proejcr(20235020) supported by the National Natural Science Foundation of China
Received date: 2006-10-20; Accepted date: 2006-12-23
Corresponding author: ZHANG Tai-ming, Professor; Tel: +86-731-8830824; E-mail: taimingzhang@163.com
(Edited by ZHAO Jun)
