

J. Cent. South Univ. (2020) 27: 1273-1289
DOI: https://doi.org/10.1007/s11771-020-4366-2

Effect of obstruction on thermal performance of solar water heaters
LI Da-peng(�����)1, WANG Yu-fan(���)1, LIU Gang(����)2,LIAO Sheng-ming(��ʤ��)2, LIU Xian-ping(����Ƽ)3
1. School of Mechanical and Electrical Engineering, Central South University of Forestry and Technology, Changsha 410004, China;
2. School of Energy Science and Engineering, Central South University, Changsha 410083, China;
3. School of Civil Engineering, Hunan University of Science and Technology, Xiangtan 411201, China
 Central South University Press and Springer-Verlag GmbH Germany, part of Springer Nature 2020
Abstract:
Solar water heaters (SWH) are widely used in urban areas because of their advantages in reducing energy consumption and mitigating greenhouse gas emissions. However, the performance of SWH subjected to obstructions is unclear yet. In this study, we present a numerical evaluation on thermal performance of facade-installed SWH under three typical obstructed scenarios, based on various levels of sunshine duration. This study is carried out for four locations with various latitudes across China. Thermal performance is measured by solar fraction for annual and monthly evaluation. The results show that the obstruction can seriously degrade annual solar fraction of SWH, even in the 4-hour sunshine duration scenario, for all the studied locations. Interestingly, only lengthening sunshine duration in the standard day (e.g., from 2 h to 4 h) may not result in increasing annual solar fraction markedly. In terms of the monthly performance, solar fraction in January and December decreases significantly, while from May to August it just declines slightly, except for Guangzhou having a swift reduction. This study can provide insights into the behavior and promote the appropriate application of SWH in urban areas.
Key words:
solar water heaters; thermal performance; obstruction; simulation��
Cite this article as:
LI Da-peng, WANG Yu-fan, LIU Gang, LIAO Sheng-ming, LIU Xian-ping. Effect of obstruction on thermal performance of solar water heaters [J]. Journal of Central South University, 2020, 27(4): 1273-1289.
DOI:https://dx.doi.org/https://doi.org/10.1007/s11771-020-4366-21 Introduction
Solar energy, as one of the main renewable energies [1], has great potential in urban areas [2]. Among solar technologies, solar water heaters (SWH) are increasingly used in urban buildings, thanks to the economic, environmental and energy benefits [3, 4], and governmental support [5]. On the other hand, in dense urban areas increasing are high-rise buildings, which are often subjected to obstructions of nearby buildings. This problem can reduce solar irradiance on building surfaces [6], resulting in the deterioration of the thermal performance of SWH installed on those areas. However, how the thermal performance of SWH is affected by nearby obstructions remains unclear yet.
Building-integrated SWH has been studied by a number of researchers on the aspects of thermal [7-11], economic [12, 13] and environmental performance [14, 15], system design [16, 17] and aesthetic issues [18, 19]. Different types of collectors have been proposed [20, 21] to better adapt to building integration. The thermal and techno-economic performance of SWH can be evaluated with the help of many computer tools, which are reviewed by MA et al [22]. However, only a few studies have focused on the effect of obstructions on the performance of SWH. CHOW et al [23] investigated the potential of central solar water heating system in high-rise residential buildings and considered implicitly the possible effect of nearby structures by only installing solar collectors on the top two-thirds of the facades. SHI et al [24] illustrated the effect of buildings layout on the performance of SWH in high-rise buildings by simulating sunshine duration in a particular district at the winter solstice. Current design guidelines [25] for SWH in the obstructed context recommend empirically at least 4 h of sunshine duration in one day for the proposed installation position. But these works did not evaluate the effect of nearby shadings explicitly and quantitatively. While LI and LIAO [26] proposed an integrated approach suitable for dynamic simulation of SWH subjected to adjacent obstructions, there is a lack of in-depth understanding of the thermal performance of SWH in the urban settings. Lack of such knowledge could hinder the appropriate application of SWH in urban buildings.
In this paper, we aim to assess the effect of obstructions of nearby buildings on the thermal performance of the SWH. This study is conducted for four locations, covering nearly the range of latitudes, from north to south, across mainland China. Through constructing three typical obstructed scenarios based on various levels of sunshine duration, annual and monthly solar fraction and variation of average tank temperature in the typical days are analyzed and compared with those under the unobstructed context. The results from this study indicate that it is necessary to plan and design SWH in urban contexts by dynamic simulation that can consider nearby obstructions explicitly. Also, this study will facilitate understanding the behavior of the SWH in obstructed contexts which is significantly different from that in the unobstructed one, and further promote the spread of SWH in urban areas.
2 Methodology
The research is undertaken using a computer- based simulation tool with different weather data, obstructed scenarios, and sample SWH model as the inputs. This section introduces the obstructed scenarios, the study locations, simulation tool, as well as the specification of modeled components of the SWH. At last, an inter-model comparison is carried out to validate the simulation tool.
2.1 Description of obstructed scenarios
The obstructed model considered in this study is composed of two high-rise buildings, which are lined up along south-north direction (see Figure 1). The southern building can shade the northern one, of which collector of the SWH is installed on the south-facing facade. We selected this kind of building layout because this can well represent the most common one in the residential zone [27]. The combination of two parameters termed distance ratio and width ratio can be used to measure the extent of obstruction on the collector surface proven by LI and LIAO [26]. Specifically, the distance ratio (dr) is defined as the ratio of the horizontal distance between two buildings (S) to the height difference between the bottom of the collector and the top edge of the obstructing building (��H). The width ratio (wr) is defined as the ratio of the width of the obstructing building (W) to ��H.
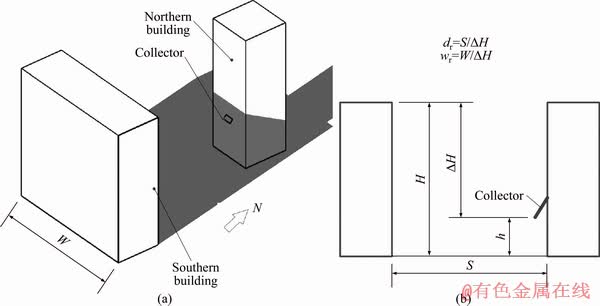
Figure 1 Plan of obstructed scenario
To investigate performance characteristics of SWH in obstructed context at different latitudes, we selected four cities, including Harbin (45.8��N, 126.7��E), Beijing (39.8��N, 116.3��E), Changsha (28.2��N, 113.0��E) and Guangzhou (23.1��N, 113.2��E ). These cities cover the most range of latitudes in mainland China. Three obstructed scenarios are constructed for each studied city separately. Each obstructed scenario is linked to a typical sunshine duration in the standard day, which is simulated by the software Ecotect Analysis 2010. The standard day, according to Ref. [28], is determined as the 20th January, which corresponds to the last solar term (i.e., Dahan day in Chinese). Sunshine duration focused on is, respectively, 2 h that is the minimal requirement of sunshine duration in the residential zones [28] and 4 h that is recommended to meet by Chinese technical standard for SWH [25]. Table 1 lists the distance ratio and width ratio involved in each obstructed scenario and the corresponding sunshine duration in the standard day for the considered cities.
2.2 Description of solar water heater
Consider a common domestic SWH composed of evacuated tube collector, storage tank, auxiliary heating device, circulating pump, controller, and tempering valve, as shown in Figure 2. The SWH is designed to serve a typical 3-person family with domestic hot water. Each person is expected to consume 40 L 50 ��C hot water per day [27] in the period from 20:00 to 23:00. Accordingly, hourly hot water usage is 40 L. If the water temperature in the top of the storage tank in the usage period is greater than 50 ��C, the proper amount of cold water will be mixed with hot water from the tank to keep the supply water temperature at 50 ��C. If less than 50 ��C, the auxiliary heating device is turned on to ensure 50 ��C hot water is supplied. The circulation pump is controlled by means of the temperature difference between the outlet of collector and the bottom of the storage tank, which for turning the pump on and off corresponds to 5 ��C and 2 ��C, respectively.
Gross area of the collector varies from 2 m2 to 6 m2 with an increment of 1 m2 and the slope ranges from 0 to 90�� with an increment of 10��, to investigate the effect of collector area and slope on the performance of the SWH in the obstructed context. According to the collector areas used here, the volume of the storage tank is set at 240 L, which leads to tank volume per square meter of collector ranging from 40 to 120 L/m2. These values fall into the optimal range that is from 50 to 200 L/m2 [29], except for the collector area of 6 m2, whose tank volume per square meter is close to lower limit of the optimal range.
Table 1 Distance ratio and width ratio for considered obstructed scenarios in various cities
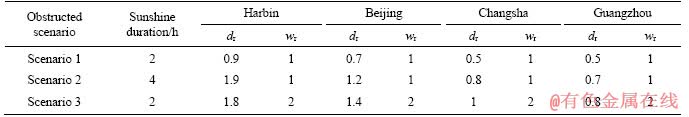
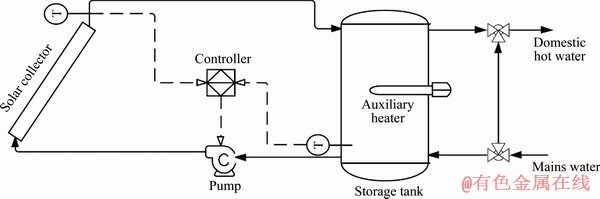
Figure 2 Schematic diagram of common domestic SWH
2.3 Simulation method
The simulation of the performance of the SWH in the obstructed environment was carried out by integrating the radiation model in the urban resource flow tool CitySim [30] with the SWH model developed in the TRaNsient SYStem (TRNSYS) simulation tool [31] (called the integrated approach). The procedure of the simulation is summarized below. First, hourly solar irradiance on the collector surface in the given obstructed scenario is calculated using CitySim. Then, the dynamic performance of SWH as described in Section 2.2 is simulated in TRNSYS with the results from the first step as boundary conditions. Linking CitySim to TRNSYS is performed automatically by a C++-based integrated program. Below are brief descriptions of the radiation model in CitySim and the SWH model in TRNSYS.
CitySim includes a radiation model based on simplified radiosity algorithm (SRA) [32] to compute the hourly irradiance on the surfaces in the obstructed scenes of arbitrary geometric complexity. The SRA has been validated by inter-model comparison with RADIANCE [33]. This validation shows that the algorithm can give satisfactory results at about one-fifth of computation cost compared with RADIANCE.
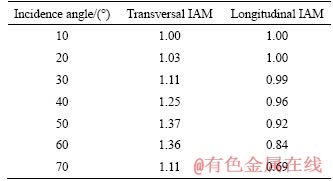
TRNSYS has been extensively used for simulating the dynamic performance of solar thermal systems and widely accepted by the scientific community thanks to its high accuracy [10, 34]. In this study, the TRNSYS information flow diagram of the SWH model is shown in Figure 3, which presents the needed modules (called Type) selected from TRNSYS component library and how they are interconnected. The main design parameters included in the SWH model are listed in Table 2. Incident angle modifiers (IAM) for the selected evacuated tube collector are given in Table 3. Note that thermal properties of the evacuated tube collector are obtained from The Solar Keymark Database and represent above- average level in China��s market.
The climate data used in the simulation is obtained from Chinese Standard Weather Data [35], according to which annual total solar irradiation on horizontal is 1276 kW��h/m2 for Harbin,1400 kW��h/m2 for Beijing, 1084 kWh/m2 for Changsha and 1135 kW��h/m2 for Guangzhou, respectively. The climate data consist mainly of normal beam irradiance, horizontal diffuse irradiance, air temperature, and relative humidity on a basis of hourly interval.
At last, for comparison, we also simulated the performance of SWH with different collector slopes and gross areas in the unobstructed context for each city, which was taken as the reference cases.
2.4 Model validation
To further strengthen the confidence in the integrated approach used, the predictions of the integrated approach was compared with the results from WATSUN software [36, 37], which can carry out hourly simulation for residential solar water heating model and has been well validated against measured results of several solar water heating systems [38]. As WATSUN cannot take account of the effect of obstruction, only the results in the unobstructed context were compared. In addition, there are two main distinctions between the integrated approach and WATSUN. The first one is the integrated approach uses a storage tank with an internal auxiliary heater but WATSUN is assumed to use an inline auxiliary heater to calculate auxiliary heating energy consumption. The second is solar irradiance on the collector surface is calculated by CitySim for the integrated approach and by Perez model [39] for WATSUN, respectively.
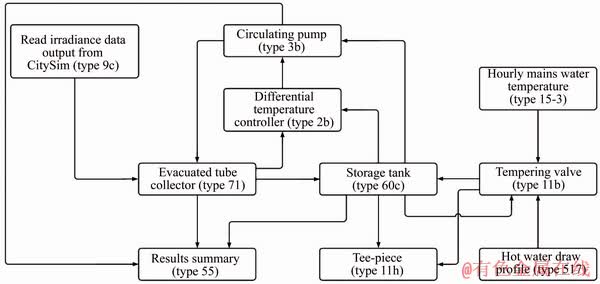
Figure 3 TRNSYS information flow diagram of SWH model
Table 2 Main components and relevant design parameters of the SWH model
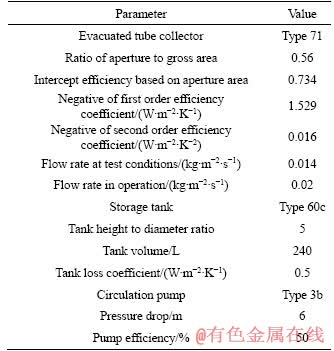
Table 3 Incident angle modifiers of evacuated tube collector
The variables focused in the comparison include annual and monthly solar fraction and hourly solar energy gained by the collector. Note that solar fraction outputted by WATSUN is used directly to compare with that associated with the integrated approach, which can be obtained by Eq. (1). In addition, these two methods can steadily provide hourly solar energy gained by the collector.
 (1)
(1)
where WSWH in kW��h, is annual or monthly energy consumption of SWH, which is outputted from the integrated approach. W0, in kW��h, is annual or monthly energy consumption of conventional water heater. In this paper, W0 was calculated by only simulating the operation of the storage tank (i.e. Tank 60c, assume that the volume is sized to 120 L) in TRNSYS with a heating efficiency of 95%. The resulting annual W0 is 2297 kW��h for Harbin,1880 kW��h for Beijing, 1663 kW��h for Changsha and 1398 kW��h for Guangzhou, respectively.
The comparisons are illustrated in Figure 4 for annual solar fraction, Figure 5 for monthly solar fraction, and Figure 6 for solar energy gained by the collector. The integrated approach tends to marginally underestimate annual solar fraction compared with WATSUN. The maximum error in annual solar fraction occurring in Harbin��s cases is only 0.06 in absolute number or 10% in relative. Also, monthly solar fraction shows a good agreement between the integrated approach and WATSUN, except for the months in winter for Harbin with a slightly noticeable difference. In addition, hourly solar energy gained by the collector from the integrated approach follows the same trend as that from WATSUN. More importantly, the trend of the annual solar fraction with collector area and slope and the variation of monthly solar fraction from the integrated approach are in excellent agreement with those from WATSUN. Given that the objective of this study is to study the effect of obstruction on, rather than to perfectly reproduce, the performance of SWH, the integrated approach is believed to be robust enough, with the help of CitySim that can produce accurate and validated irradiance data.
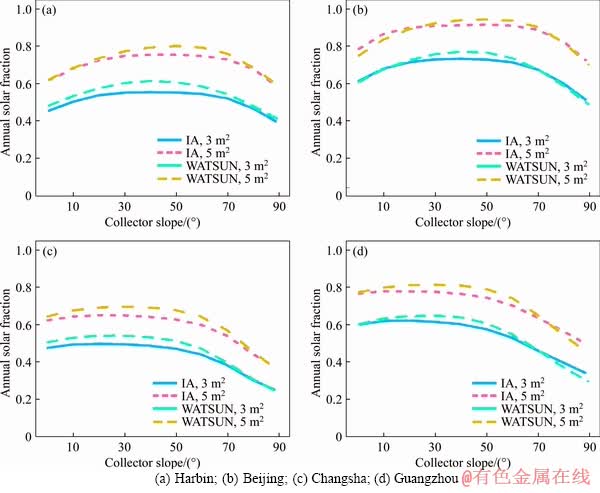
Figure 4 Annual solar fraction comparisons between integrated approach (IA) and WATSUN:
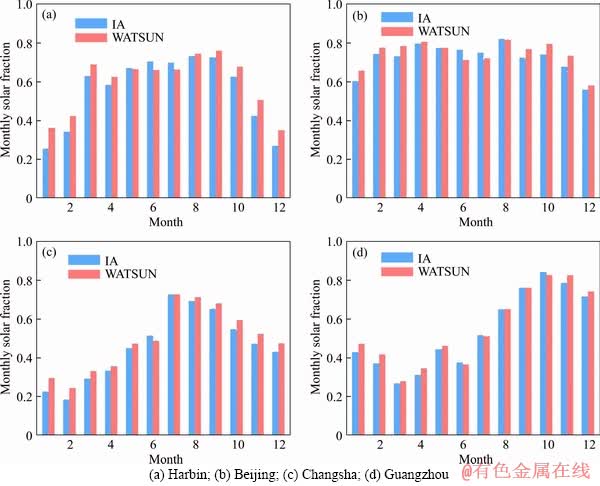
Figure 5 Monthly solar fraction comparisons between integrated approach (IA) and WATSUN (collector area of 3 m2 and slope of 60��):
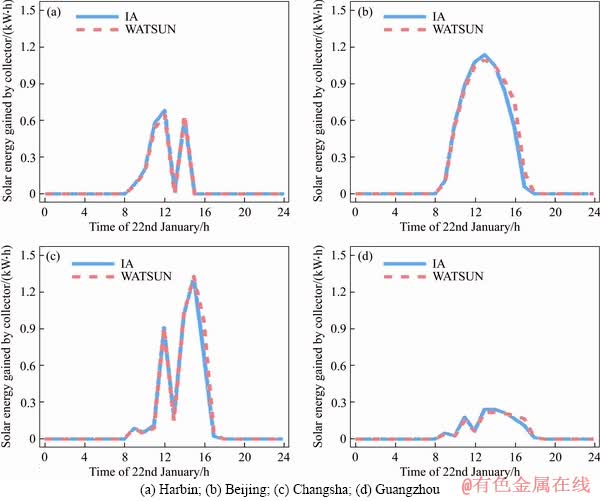
Figure 6 Comparison of hourly solar energy gained by collector on 22nd January between integrated approach (IA) and WATSUN (collector area of 3 m2 and slope of 60��):
3 Results and discussion
3.1 Annual solar fraction
Annual solar fraction is adopted to evaluate the yearly thermal performance of SWH. In addition, to evaluate the effect of obstructions, percent decrease of the annual solar fraction is defined as the ratio of the difference of annual solar fraction with the same collector slope and area between the unobstructed and obstructed scenarios to annual one in the unobstructed scenario.
The effect of the obstruction on annual solar fraction is significant for four cities, as shown in Figures 7 and 8. According to the percent decrease of annual solar fraction, the extent of the obstruction, from the heavier to the lesser, is in the order of Scenario 1, Scenario 3 and Scenario 2. Interestingly, annual solar fraction may be markedly different between two scenarios with the same sunshine duration in the standard day, such as Scenario 1 and 3; however, it may be nearly the same between two scenarios with obviously different sunshine duration, such as Scenario 2 and 3. More importantly, the above results suggest that the sunshine duration in the standard day may be not an accurate index to assess the actual annual performance of SWH in the obstructed context.
Specifically, as shown in Figure 8, in the heaviest obstructed scenario (Scenario 1), annual solar fraction of SWH with a slope of 0-90�� and area of 2-6 m2 can decrease by 14.0%-39.8% for Harbin, 25.2%-58.5% for Beijing, 35.3%-78.0% for Changsha and 28.6%-71.5% for Guangzhou, respectively, compared with that in the unobstructed scenario. Even in Scenario 2 that has the less extent of obstruction, annual solar fraction may still decline by up to 10.6% for Harbin, 32.7% for Beijing, 47.9% for Changsha and 49.8% for Guangzhou, respectively. It should be noted that in Scenarios 2 and 3 of Harbin, solar fraction may be slightly larger than that in the unobstructed scenario if collector slope is very small (such as less than 10��). The reasons may be that (1) collector surface with small slope can receive higher reflected irradiation from the facade (albedo is set at 0.2) where it is installed, and (2) the increased reflected irradiation is larger than the decrease of solar irradiation due to the obstruction.
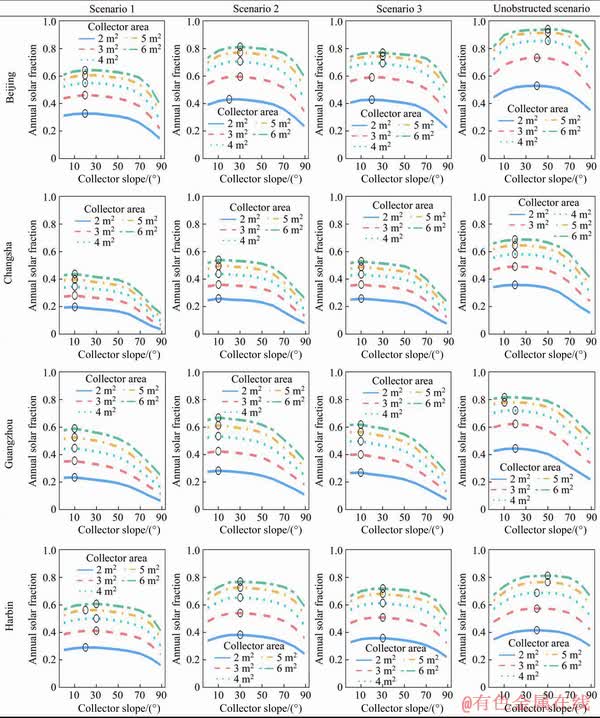
Figure 7 Comparison of annual solar fraction of SWH with different slopes and areas in unobstructed and three obstructed scenarios
In the obstructed environment, the collector slope that makes annual solar fraction maximum (hereafter optimal slope) is smaller than that in the unobstructed context, under which the optimal slope is nearly equal to local latitude (Figure 7). The optimal slope is marked by a hollow circle, as shown in Figure 7. Note that as the increment of collector slope is based on 10��, the shown optimal slope is a round number. This approximation, however, does not lead to marked error, because annual solar fraction keeps rather stable around the optimal slope (Figure 7). Specifically, in the obstructed scenarios, the optimal slope is reduced to 20-30�� for Harbin and Beijing, and to about 10�� for Changsha and Guangzhou. In addition, when collector slope is larger than a critical slope, which is 60�� for Harbin and Beijing and 50�� for Changsha and Guangzhou, annual solar fraction is decreased rapidly with the increase of collector slope. However, collector slope affects solar fraction moderately when it is smaller than the critical one. Taking the SWH with area of 3 m2 in Scenario 2 in Beijing as an example, when collector slope is increased from the optimal one of 30�� to 60��, annual solar fraction is only decreased from 0.594 to 0.555; but as collector slope further increase to 90��, annual solar fraction is reduced sharply to 0.344. Furthermore, with the increase of collector slope, the percent decrease of solar fraction rise (Figure 8), i.e., the effect of obstruction on solar fraction become more significant.
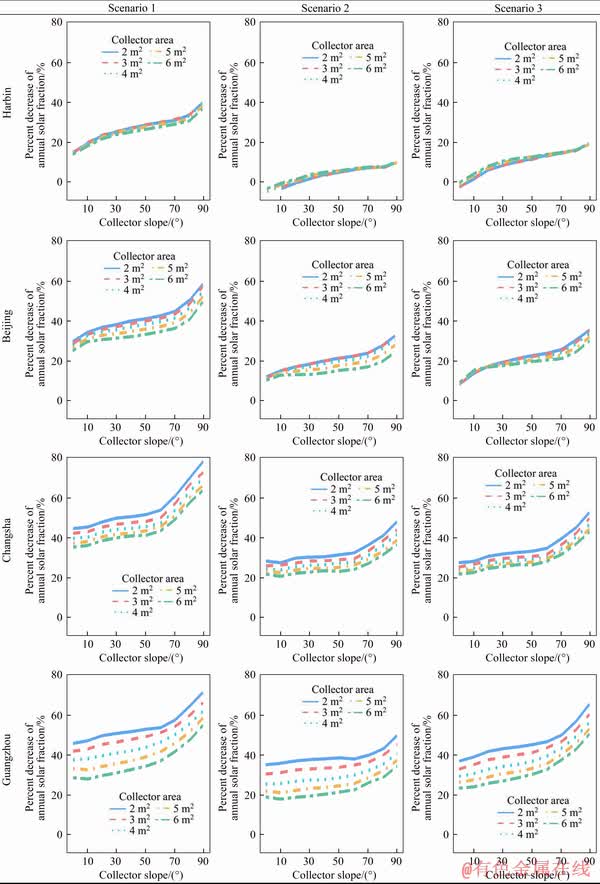
Figure 8 Comparison of percent decrease of annual solar fraction of SWH with different slopes and areas in three obstructed scenarios
The effect of collector area on annual solar fraction in the obstructed scenarios is less significant than that in the unobstructed context (Figure 7). The heavier the extent of obstruction is, the less significant the effect of collector area becomes. For instance, in Harbin, when collector area is increased from 2 m2 to 6 m2, solar fraction of SWH with a slope of 40��increase by 0.415 in the unobstructed scenario, 0.318 in Scenario 1, 0.390 in Scenario 2 and 0.360 in Scenario 3, respectively. Besides, the percent decrease of annual solar fraction shows an upward trend as collector area is decreased (Figure 8), except for Harbin where it almost does not vary with different collector areas.
3.2 Monthly solar fraction
Monthly thermal performance of SWH is evaluated using monthly solar fraction. Figure 9 compares monthly solar fraction between the unobstructed scenario and the three obstructed scenarios for each city considered, taking the SWH with a collector area of 3 m2 and slope of 60�� as an example. The characteristics of the variation of monthly solar fraction in Guangzhou is obviously different from those in the other cities considered, therefore we show the results about Guangzhou and the three other cities, respectively. First, the main findings in terms of Harbin, Beijing, and Changsha from Figure 9 are as follows:
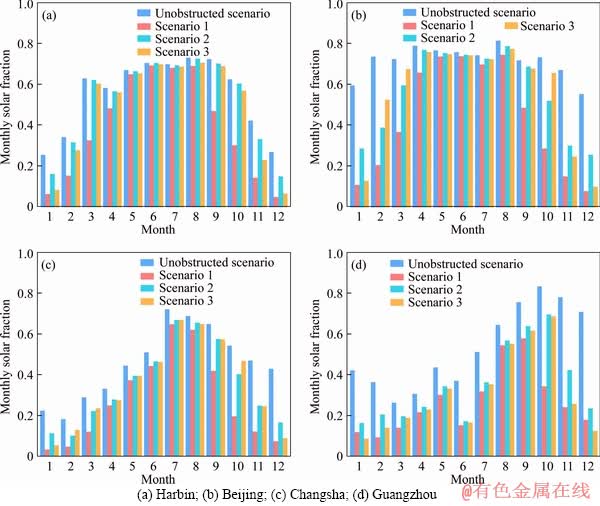
Figure 9 Comparison of monthly solar fraction between the unobstructed scenario and the three obstructed scenarios (collector area of 3 m2 and slope of 60��):
1) From May to August in Harbin, Beijing, and Changsha, the monthly solar fraction is slightly affected by the obstruction for all obstructed scenarios considered. For instance, even in Scenario 1 which has the heaviest extent of the obstruction, solar fraction of August is only decreased by 0.040 (5.4% in percent decrease) for Harbin, 0.070 (8.5%) for Beijing and 0.067 (9.8%) for Changsha, respectively, compared with that in the unobstructed scenario. The reason of the small decrease of solar fraction is that the collector surface can obtain direct sunlight all day during May-August according to the simulation of sunshine duration, and thus the obstructions only reduce solar diffuse irradiation. Moreover, it is found that the percent decrease of solar fraction shows an upward trend as the local latitude decreases for the same scenario. This is because that, the distance ratio is increased with the increase of the local latitude, to get the same sunshine duration for different cities with the same width ratio, hence the less extent of obstruction in terms of solar diffuse irradiation.
2) During December to next January of Harbin, Beijing, and Changsha, monthly solar fraction in any studied scenarios declines sharply compared with that in the unobstructed scenario. In spite of the marked drop, solar fraction in Scenario 2 is obviously higher than that in Scenario 1 and 3. In Beijing, for instance, solar fraction in December is decreased by 86% for Scenario 1, 54% for Scenario 2, 82% for Scenario 3, respectively.
3) From February to March and September to November, there is also a noticeable decrease in solar fraction in Scenario 1. In addition, solar fraction in Scenarios 2 and 3 is evidently higher than that in Scenario 1, but may still decline moderately depending on the month and location.
Next, the main observations from Figure 9 in terms of Guangzhou are listed as below:
1) The percent decrease of solar fraction during May to July is relatively high (even over 50% in June) and is of marginal difference among the three obstructed scenarios considered. This can be explained by that Guangzhou is located in the south of the Tropic of Cancer, as a result, the Sun remains in the northern half of the sky in most time of a day or even all day during May to July. Thus, the collector surface installed on the south-facing facade could be shaded by the facade itself rather than by the nearby building.
2) From November until next February, monthly solar fraction in Scenarios 1-3 is affected seriously by the obstruction, resulting in a reduction of at least 44% (Scenario 2 in February) relative to the unobstructed context. Especially, in December, for instance, solar fraction is decreased by 75% for Scenario 1, 67% for Scenario 2 and 82% for Scenario 3, respectively.
The relationship between monthly solar fraction and sunshine duration in the corresponding month under various obstructed scenarios is examined. It is found that for a particular month, the obstructed scenario, which is associated with longer sunshine duration, also obtains higher solar fraction. However, the sunshine duration cannot quantify the effect of obstructions on monthly solar fraction. In January of Harbin, for example, there is 4 h of sunshine duration in Scenario 2, hence SWH might have a better performance [25], yet in fact, solar fraction in January still drops markedly by 36.5% compared with that in the unobstructed scenario.
When the collector area and slope vary, the effect of the obstruction on monthly solar fraction follows a similar pattern as illustrated above (Figure 10). The only difference is that with the decrease of collector slope and the increase of collector area, the effect of obstruction becomes less significant.
3.3 Daily variation of tank temperature
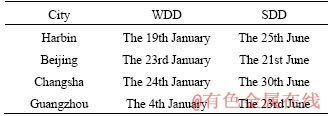
To understand the daily characteristics of SWH in the obstructed context, we simulate the performance of SWH in the unobstructed and the three obstructed scenarios in two design days. The initial tank temperature is set at 20 ��C. A sunny winter and summer day are selected as winter design day (WDD) and summer design day (SDD), respectively, for each of the four cities considered, as listed in Table 4.
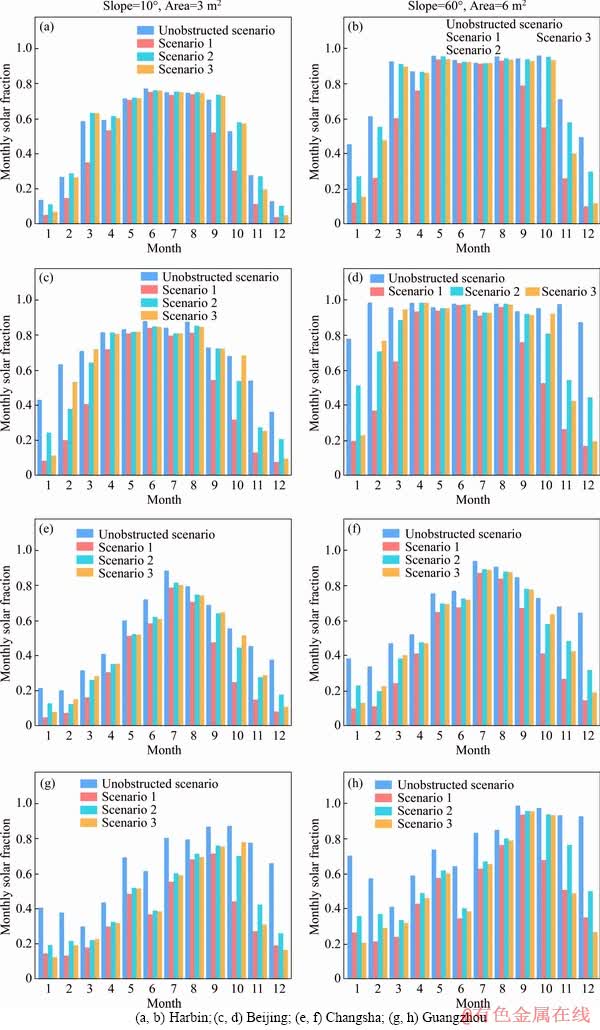
Figure 10 Comparison of monthly solar fraction between unobstructed scenario and three obstructed scenarios (left column: Collector area of 3 m2 and slope of 10��; Right column: collector area of 6 m2 and slope of 60��):
Table 4 Winter and summer design day for different cities
Solar irradiance on the collector surface in the three obstructed scenarios decreases significantly in WDD, resulting in the sharp fall of the average water temperature in the storage tank (Figure 11). In addition, the average tank temperature in Scenarios 1 and 3 are almost identical and are markedly lower than the one in Scenario 2 for Harbin, Beijing, and Changsha. However, the average tank temperature in Guangzhou is of modest difference among Scenarios 1-3. As shown in Figure 11, for instance, the average tank temperature at 18:00 in WDD in Scenario 1-3 is reduced, compared with that in the unobstructed scenario, by 10.5, 5.5 and 9.9 ��C for Harbin, 17.5, 10.5 and 16.9 ��C for Beijing, 15.1, 9.7 and 14.3 ��C for Changsha, and 15.3, 14.1 and 17.1 ��C for Guangzhou, respectively.
In SDD, solar irradiance on the collector surface and average tank temperature in the obstructed scenarios are almost the same as those in the unobstructed scenario for Harbin, Beijing and Changsha. Only before 11:00 and after 15:00 in Changsha, solar irradiance in the obstructed scenarios decreases slightly, which could result in the average tank temperature at 18:00 declines by about 1.5 ��C, as shown in Figure 11. However, in Guangzhou, solar irradiance in the obstructed scenarios is markedly lower than that in the unobstructed scenario, except for at noon when the former can approach the latter. As a result, the average tank temperature drops obviously by about 7 ��C in the obstructed scenarios (Figure 11).
It is found from Figure 12 that in WDD, the average tank temperature in the obstructed scenario is less insensitive to collector slope and area than in the unobstructed scenario. However, in SDD, the effect of collector slope and area on the average tank temperature in the obstructed scenario is almost the same as that in the unobstructed scenario, except for Guangzhou. Furthermore, when the collector slope is 90��, the average tank temperature drops sharply in SDD, compared with that corresponding to the smaller slope (such as 60��), regardless of the obstruction.
4 Conclusions
This paper evaluates the effect of nearby obstructions on the thermal performance of SWH, through investigating annual and monthly solar fraction and typical daily variation of tank temperature of SWH in three obstructed scenarios in four cities with different latitudes across China. The obstructed scenarios can be characterized by two parameters (i.e., distance ratio and width ratio), and are associated with the given typical sunshine duration in the standard day. In addition, to thoroughly understand the behavior of SWH in the obstructed context, collector slope ranges from 0 to 90�� with an increment of 10�� and gross area from 2 to 6 m2 with an increment of 1 m2.
The results indicate that the effect of obstructions becomes more significant with the increase of collector slope and/or the decrease of collector area for these four cities, except for Harbin where the effect does not nearly vary with different collector areas. Annual solar fraction could suffer a marked decrease in any obstructed scenarios. Even under the 4-hour sunshine duration scenario, annual solar fraction could decline by up to 10.6% for Harbin, 32.7% for Beijing, 47.9% for Changsha and 49.8% for Guangzhou, respectively. It is also found that sunshine duration in the standard day does not correlate well positively with annual solar fraction. On the other hand, monthly solar fraction indeed has an upward trend with the increase in sunshine duration within the particular month. As a result, solar fraction in January and December in any obstructed scenarios considered declines significantly (even over 80%) in these four cities; on the contrary, solar fraction from May to August just declines slightly, except for Guangzhou where solar fraction is also subjected to a marked reduction. Finally, the effect of the obstruction on the performance of SWH in WDD and SDD is similar to that on the relevant monthly solar fraction. With a collector area of 3 m2 and slope of 60��, for instance, the average tank temperature in WDD is decreased, depending on different obstructed scenarios, by 5.5-10.5 ��C for Harbin, 10.5-17.5 ��C for Beijing, 9.7-15.1��C for Changsha, and 14.1-17.1 ��C for Guangzhou, respectively, whereas the one in SDD drops by about 7 ��C only for Guangzhou.
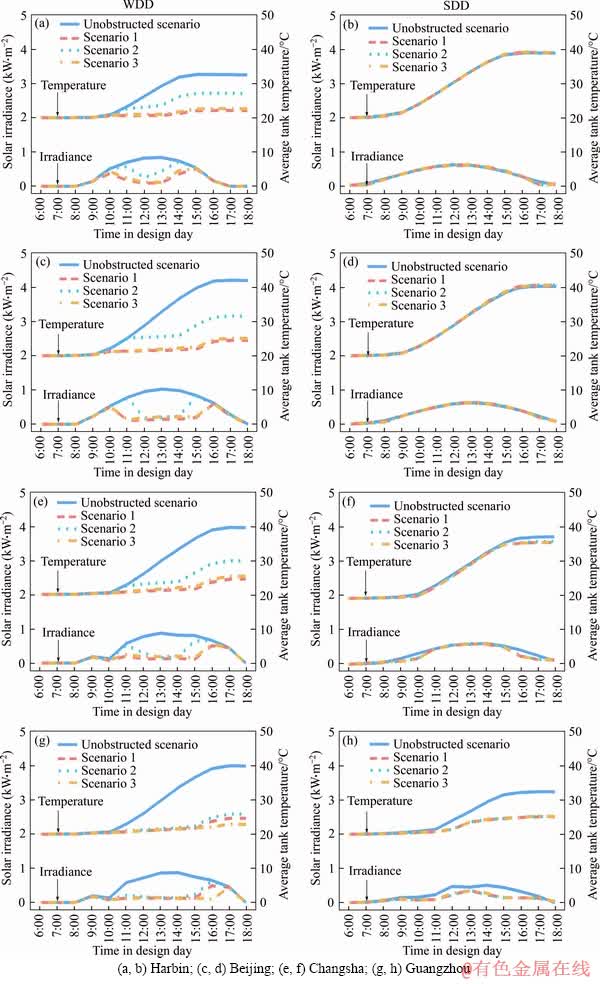
Figure 11 Comparison of hourly profiles of solar irradiance on collector surface and average tank temperature in WDD and SDD between unobstructed scenario and three obstructed scenarios (collector area of 3 m2 and slope of 60��):
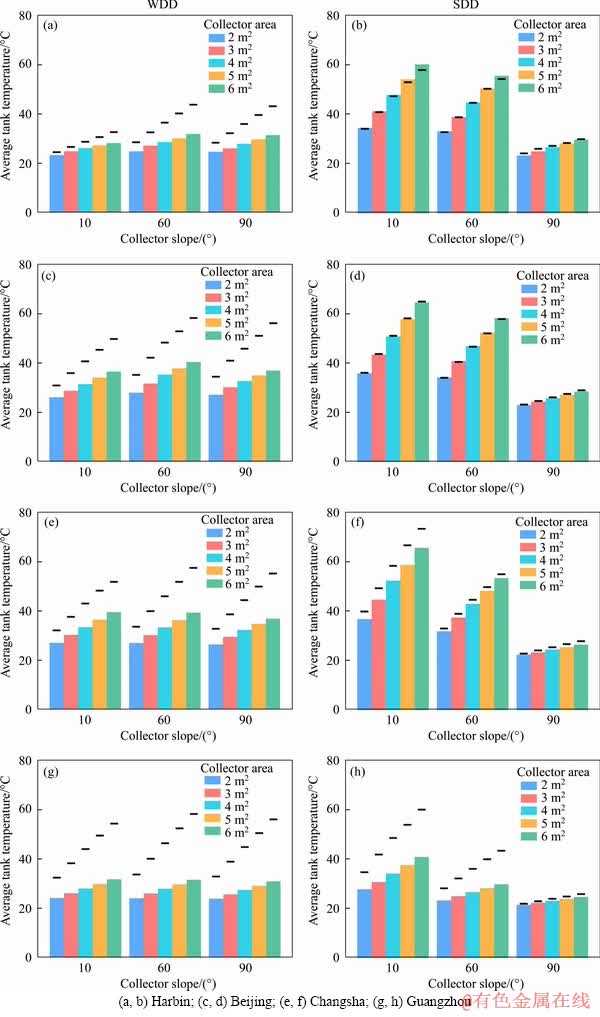
Figure 12 Variation of average tank temperature at 18:00 in WDD and SDD with collector slope and area in Scenario 2 (short horizontal line represents average tank temperature in unobstructed scenario):
Nomenclature
dr
Distance ratio
��H
Height difference between the bottom of collector and the top edge of obstructing building, m
f
Solar fraction
h
Height above the ground of the bottom of collector, m
H
Height of the building, m
W0
Annual energy consumption using conventional water heater, kW��h
WSWH
Annual energy consumption by SWH, kW��h
S
Horizontal distance between obstructing and obstructed building, m
W
Width of obstructing building, m
wr
Width radio
References
[1] LIU G, LI M, ZHOU B, CHEN Y, LIAO S. General indicator for techno-economic assessment of renewable energy resources [J]. Energy Conversion and Management, 2018, 156: 416-426. DOI: 10.1016/j.enconman.2017.11.054.
[2] KAMMEN D M, SUNTER D A. City-integrated renewable energy for urban sustainability [J]. Science, 2016, 352(6288): 922-928. DOI: 10.1126/science.aad9302.
[3] YOO J H. Evaluation of solar hot water heating system applications to high-rise multi-family housing complex based on three years of system operation [J]. Energy and Buildings, 2015, 101: 54-63. DOI: 10.1016/j.enbuild.2015.04.037.
[4] YILMAZ I H. Residential use of solar water heating in Turkey: A novel thermo-economic optimization for energy savings, cost benefit and ecology [J]. Journal of Cleaner Production, 2018, 204: 511-524. DOI: 10.1016/j.jclepro. 2018.09.060.
[5] HE G, ZHENG Y, WU Y, CUI Z, QIAN K. Promotion of building-integrated solar water heaters in urbanized areas in China: Experience, potential, and recommendations [J]. Renewable and Sustainable Energy Reviews, 2015, 42: 643-656. DOI: 10.1016/j.rser.2014.10.044.
[6] LI D, LIU G, LIAO S. Solar potential in urban residential buildings [J]. Solar Energy, 2015, 111: 225-235. DOI: 10.1016/j.solener.2014.10.045.
[7] LIANG R, ZHANG J, ZHAO L, MA L. Performance enhancement of filled-type solar collector with U-tube [J]. Journal of Central South University, 2015, 22(3): 1124-1131. DOI: 10.1007/s11771-015-2624-5.
[8] SHAFIEIAN A, KHIADANI M, NOSRATI A. Thermal performance of an evacuated tube heat pipe solar water heating system in cold season [J]. Applied Thermal Engineering, 2019, 149: 644-657. DOI: 10.1016/ j.applthermaleng.2018.12.078.
[9] SOULIOTIS M, PANARAS G, FOKAIDES P A, PAPAEFTHIMIOU S, KALOGIROU S A. Solar water heating for social housing: Energy analysis and life cycle assessment [J]. Energy and Buildings, 2018, 169: 157-171. DOI: 10.1016/j.enbuild.2018.03.048.
[10] LI R, DAI Y, WANG R. Experimental investigation and simulation analysis of the thermal performance of a balcony wall integrated solar water heating unit [J]. Renewable Energy, 2015, 75: 115-122. DOI: 10.1016/j.renene.2014.09. 023.
[11] NAZARI M A, AHMADI M H, SADEGHZADEH1 M, SHAFII M B, GOODARZI M. A review on application of nanofluid in various types of heat pipes [J]. Journal of Central South University, 2019, 26(5): 1021-1041. DOI: 10.1007/s11771-019-4068-9.
[12] AYDIN E, EICHHOLTZ P, YONDER E. The economics of residential solar water heaters in emerging economies: The case of Turkey [J]. Energy Economics, 2018, 75: 285-299. DOI: 10.1016/j.eneco.2018.08.001.
[13] MICHAEL J J, SELVARASAN I. Economic analysis and environmental impact of flat plate roof mounted solar energy systems [J]. Solar Energy, 2017, 142: 159-170. DOI: 10.1016/j.solener.2016.12.019.
[14] UCTUG F G, AZAPAGIC A. Life cycle environmental impacts of domestic solar water heaters in Turkey: The effect of different climatic regions [J]. Science of the Total Environment, 2018, 622-623: 1202-1216. DOI: 10.1016/ j.scitotenv.2017.12.057.
[15] KYRIAKI E, GIAMA E, PAPADOPOULOU A, DROSOU V, PAPADOPOULOS A M. Energy and environmental performance of solar thermal systems in hotel buildings [J]. Procedia Environmental Sciences, 2017, 38: 36-43. DOI: 10.1016/j.proenv.2017.03.072.
[16] COLMENAR-SANTOS A, VALE-VALE J, BORGE-DIEZ D, REQUENA-PEREZ R. Solar thermal systems for high rise buildings with high consumption demand: Case study for a 5 star hotel in Sao Paulo, Brazil [J]. Energy and Buildings, 2014, 69: 481-489. DOI: 10.1016/j.enbuild.2013.11.036.
[17] HE Z. Solar water heating systems applied in high-rise residential buildings in China [J]. Energy Procedia, 2016, 91: 408-414. DOI: 10.1016/j.egypro.2016.06.278.
[18] MUNARI PROBST M C, ROECKER C. Criteria and policies to master the visual impact of solar systems in urban environments: The LESO-QSV method [J]. Solar Energy, 2019, 184: 672-687. DOI: 10.1016/j.solener.2019.03.031.
[19] FLORIO P, MUNARI PROBST M C, SCHULER A, ROECKER C, SCARTEZZINI J. Assessing visibility in multi-scale urban planning: A contribution to a method enhancing social acceptability of solar energy in cities [J]. Solar Energy, 2018, 173: 97-109. DOI: 10.1016/j.solener. 2018.07.059.
[20] KALOGIROU S A. Building integrated solar thermal systems-A new era of renewables in buildings [J]. Bulgarian Chemical Communications, 2016, 48: 102-108. http://www. bcc.bas.bg/BCC_Volumes/Volume_48_Special_E_2016/Special%20Issue%20E/Statii/Pages102-108.pdf.
[21] VISA I, MOLDOVAN M, COMSIT M, NEAGOE M, DUTA A. Facades integrated solar-thermal collectors-challenges and solutions [J]. Energy Procedia, 2017, 112: 176-185. DOI: 10.1016/j.egypro.2017.03.1080.
[22] MA W, XUE X, LIU G. Techno-economic evaluation for hybrid renewable energy system: Application and merits [J]. Energy, 2018, 159: 385-409. DOI: 10.1016/j.energy.2018.06. 101.
[23] CHOW T T, FONG K F, CHAN A L S, LIN Z. Potential application of a centralized solar water-heating system for a high-rise residential building in Hong Kong [J]. Applied Energy, 2006, 83(1): 42-54. DOI: 10.1016/j.apenergy. 2005.01.006.
[24] SHI J, SU W, ZHU M, CHEN H, PAN Y, WAN S, WANG Y. Solar water heating system integrated design in high-rise apartment in China [J]. Energy and Buildings, 2013, 58: 19-26. DOI: 10.1016/j.enbuild.2012.10.018.
[25] The Ministry of Construction of China. GB 50364-2005, Technical code for solar water heating system for civil buildings [S]. Beijing, China: China Architecture and Building Press, 2005. (in Chinese)
[26] LI D, LIAO S. An integrated approach to evaluate the performance of solar water heater in the urban environment [J]. Energy and Buildings, 2014, 69: 562-571. DOI: 10.1016/j.enbuild.2013.11.044.
[27] China National Engineering Research Center for Human Settlements. Integration design for solar water heating system in dwelling [M]. Beijing: China Architecture and Building Press, 2006. (in Chinese)
[28] The Ministry of Construction of China. GB 50180-93, Code of urban residential areas planning and design (Ver. 2002) [S]. Beijing, China: China Architecture and Building Press, 2002. (in Chinese)
[29] DUFFIE J A, BECKMAN W A. Solar Engineering of Thermal Processes [M]. 4th Edition. New York: John Wiley & Sons, Inc, 2013.
[30] ROBINSON D, HALDI F, KAMPF J, LEROUX P, PEREZ D, RASHEED A, WILKE U. CitySim: comprehensive micro-simulation of resource flows for sustainable urban planning [C]// Proc of CISBAT 2009. Lausanne, Switzerland, 2009: 1083-1090.
[31] TRNSYS 16. A transient system simulation program [M]. Solar Energy Laboratory, University of Wisconsin-Madison, 2006.
[32] ROBINSON D, STONE A. Solar radiation modelling in the urban context [J]. Solar Energy, 2004, 77(3): 295-309. DOI: 10.1016/j.solener.2004.05.010.
[33] ROBINSON D, STONE A. A simplified radiosity algorithm for general urban radiation exchange [J]. Building Services Engineering Research and Technology, 2005, 26(4): 271-284. DOI: 10.1191/0143624405bt133oa.
[34] SHRIVASTAVA R L, VINOD KUMAR, UNTAWALE S P. Modeling and simulation of solar water heater: A TRNSYS perspective [J]. Renewable and Sustainable Energy Reviews, 2017, 67: 126-143. DOI: 10.1016/j.rser.2016.09.005.
[35] China Meteorological Bureau and Tsinghua University. China standard weather data for analyzing building thermal conditions [M]. Beijing: China Architecture and Building Press, 2005. (in Chinese)
[36] Natural Resources Canada. WATSUN 2009 [EB/OL]. [2019-07-20]. https://web.archive.org/web/20150415164654/ http://www.nrcan.gc.ca/energy/software-tools/7435.
[37] KALOGIROU S A. Solar energy engineering processes and systems second edition [M]. Amsterdam: Elsevier, 2014.
[38] GEMMELL W L, CHANDRASHEKAR M, VANOLL K H. Detailed modeling of evacuated collector systems, a report of task VI: The performance of solar heating, cooling, and hot water systems using evacuated collectors [R]. IEA-SHAC- TVI-6, IEA Solar Heating & Cooling Programme, 1986.
[39] PEREZ R, STEWART R, SEALS R, GUERTIN T. The development and verification of the perez diffuse radiation model [R]. Sandia Report SAND88-7030, 1988.
(Edited by HE Yun-bin)
���ĵ���
�ڵ���̫������ˮ�������ܵ�Ӱ��
ժҪ��̫������ˮ�������ڼ�����Դ���ĺ����������ŷŷ�������ƶ����㷺Ӧ���ڳ��е��������ǣ������ڵ����������ܵ�Ӱ���в����������ѡȡ�й�4��γ�Ȳ�ͬ�ĵ���(����������������ɳ����)���ֱ�����ֵ����ڵ����������氲װ̫������ˮ���������ܽ����˶Ա��о����ڵ������������ճ���ʱ�������ж��塣�����ܲ���̫���ܱ�֤�����������ۡ�������������������о��ص㣬��ʹ��4 h���ճ���ʱ������£��ڵ�Ҳ�����ؽ�����̫���ܱ�֤�ʣ����ҽ��ӳ����յ�����ʱ��(�����2 h�ӳ���4 h)���ܲ�������������̫���ܱ�֤�ʡ�������ÿ�������ܶ��ԣ��ڵ�������1�º�12�µ�̫���ܱ�֤�������½������������3������5����8�µ�̫���ܱ�֤�ʽ������½��������ݵ�̫���ܱ�֤��Ѹ���½������о��������ڵ�������̫������ˮ�����������ԣ������ڴٽ����ڳ��н����еĺ���Ӧ�á�
�ؼ��ʣ�̫������ˮ���������ܣ��ڵ���ģ��
Foundation item: Projects(2017JJ3517, 2017JJ3090) supported by the Natural Science Foundation of Hunan Province, China; Project(2018NK2066) supported by the Key Research and Development Program of Hunan Province, China; Project(QJ2017007B) supported by the Youth Scientific Research Foundation of Central South University of Forestry and Technology, China
Received date: 2019-05-30; Accepted date: 2020-01-25
Corresponding author: LI Da-peng, PhD, Lecturer; Tel: +86-18229788336; E-mail: dapengli@csuft.edu.cn; ORCID: 0000-0002-3884- 1601
Abstract: Solar water heaters (SWH) are widely used in urban areas because of their advantages in reducing energy consumption and mitigating greenhouse gas emissions. However, the performance of SWH subjected to obstructions is unclear yet. In this study, we present a numerical evaluation on thermal performance of facade-installed SWH under three typical obstructed scenarios, based on various levels of sunshine duration. This study is carried out for four locations with various latitudes across China. Thermal performance is measured by solar fraction for annual and monthly evaluation. The results show that the obstruction can seriously degrade annual solar fraction of SWH, even in the 4-hour sunshine duration scenario, for all the studied locations. Interestingly, only lengthening sunshine duration in the standard day (e.g., from 2 h to 4 h) may not result in increasing annual solar fraction markedly. In terms of the monthly performance, solar fraction in January and December decreases significantly, while from May to August it just declines slightly, except for Guangzhou having a swift reduction. This study can provide insights into the behavior and promote the appropriate application of SWH in urban areas.
