
Trans. Nonferrous Met. Soc. China 22(2012) s54-s60
Thickness distribution and mechanical property of sheet metal incremental forming based on numerical simulation
LI Jun-chao, LI Chong, ZHOU Tong-gui
College of Material Science and Engineering, Chongqing University, Chongqing 400044, China
Received 9 July 2012; accepted 13 August 2012
Abstract:
The thickness distribution and mechanical property of a truncated pyramid processed by incremental forming were investigated based on numerical simulation and tensile tests. A finite element method (FEM) model was set up and then experimentally verified. The tool path of the simulation model was assured to be the same with that of the real process by adding the displacement constraints on the forming tool. Afterwards, the sine law used to predict the final thickness was verified, but it was only applied to the region mainly subjected to pure stretching deformation. Additionally, the relation between the tool path and the minimum thickness as well as its location was discussed. The result indicates that the minimum thickness is much related to tool diameter if a traditional tool trajectory is employed, and its location is largely determined by step depth. Finally, tensile tests with specimens taken from the formed pyramid were carried out. It is indicated that the plasticity of the material decreases sharply while the strength increases markedly owing to the significant work hardening effect during ISF process.
Key words:
incremental forming; numerical simulation; thickness; plasticity; strength;
1 Introduction
Sheet metal incremental forming (ISF), one kind of flexible manufacturing processes, has drawn increasing attention because of its satisfaction of a small batch production or customized designs [1,2]. Figure 1 briefly shows the principle of this technology. During the process usually implemented in a numerical controlled (NC) milling machine [3], a forming tool moves along a series of contour lines. These contour lines, namely tool path, which are closely related to process parameters including depth increment (��z), wall angle (��) and tool diameter (D), play a significant role in forming performances of ISF.
Interests in the investigation of ISF technology have increased so far. However, conventional methods show a little insufficiency to analyze the forming mechanism of ISF. Fortunately, finite element method (FEM) has been introduced to investigate the deformation mechanism of incremental forming [4-6]. In the view of these researches, shell elements are believed to be acceptable considering the calculation time and accuracy. In spite of these achievements, thickness thinning has always been an obstacle to the wide application of incremental forming [7]. Although multi-stage forming is an advisable approach to tackle this problem [7-10], the increased time cost is unsatisfying compared with that of a single-pass process. Whether it is a single-stage process or a multi-stage process, the minimum thickness is often regarded as an indication to improve thickness thinning. However, there are little researches on the relation between the tool trajectory and the minimum thickness as well as its location. Besides, the mechanical property of the sheet material after ISF process has not received attention yet. And what��s more, most of previous simulation studies have a common disadvantage. They were only based on simplified FEM models to research the process of ISF, for the tool path which always involves three-dimensional (3-D) complicated movements is relatively difficult to implement in FEM simulation. In our study, tool path was defined by adding displacement constraints to lead to the equivalence of the tool��s movement in FEM model and in practical process. In addition, the influence of process parameters on the minimum thickness and its location was carefully analyzed, and the mechanical property of the material after forming was researched.
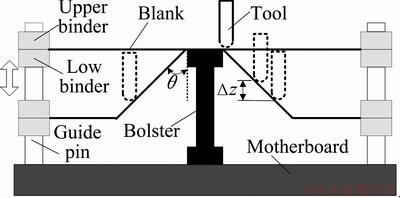
Fig. 1 Principle of sheet metal incremental forming (��z: depth increment; ��: wall angle)
2 Methods
2.1 Benchmark part
In this study, a frustum of pyramid with the height of 120 mm, the wall angle of 30�� and the base edge of 290 mm was selected as the benchmark product. The material used was a DC04 sheet with the size of 400 mm��400 mm��1 mm.
2.2 FEM model
A 3-D elastic-plastic finite element model for incremental forming was established in Abaqus software. In this model, the blank was assumed to be of isotropic property and meshed using shell elements (type S4R). The tool and binders were treated as rigid bodies. Coulomb��s friction law was applied with a friction coefficient of 0.1 between the blank and the tool and of 0.25 between the blank and the binders. Additionally, the contact condition was implemented through a pure master-slave contact algorithm. Besides, the process parameters for the truncated pyramid were D=20 mm and ��z=0.5 mm.
As the forming tool often moves along series of complicated spatial curves, tool path definition has always been difficult in FEM analysis. Previous studies were just based on simplified tool trajectory, which inevitably led to some errors between a FEM model and an actual process. To tackle this problem, in this study, the tool trajectory in FEM model was defined by adding the 3-D displacement coordinates of the forming tool in real process. Figure 2 describes the procedure of tool path definition. Firstly, the benchmark product was modeled in CAD module of Unigraphics NX. Afterwards, in CAM module, the tool path was generated with Zlevel profile operation and then exported in APT (automatically programmed tools) format from which the 3-D displacement coordinates were able to be achieved. Assuming that the forming tool��s moving speed was fixed, a time series could be generated by programming for the distance between two adjacent points of the tool path was known. Accordingly, three time-coordinate arrays were obtained to be used to create boundary conditions of displacements of the forming tool in load module of Abaqus. As a result, the tool path in the simulation model is the same as that in the real process. The long calculation time, however, has always been a crucial problem for ISF simulation because of the complicated tool path [11,12]. To deal with this problem, the tool speed was artificially increased below a critical value in our study and the total calculation time was sharply reduced.
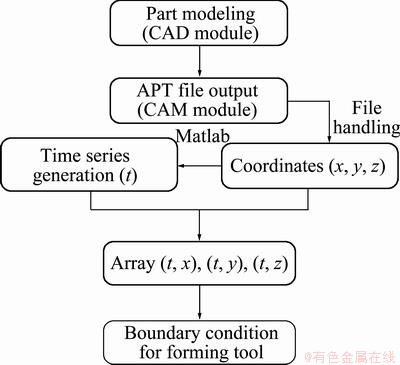
Fig. 2 Flow chart of tool path definition in FEM model
3 Results
3.1 Simulation result
Based on the method proposed in Section 2, the benchmark part was modeled and the thickness distribution after simulation was shown in Fig. 3. If two points, expressed as A1 and A2, were selected at different height, the principal strain history of A1 and A2 could be obtained as displayed in Fig. 4.
It is evident that during forming the intermediate principle strains for both points are nearly zero all along. The result indicates that the blank mainly undergoes plane deformation, stretching in the radical direction and compressing in the normal direction. This consequence is well in accordance with the previous studies [1,13]. In addition, it is worth noticing that the maximum and minimum strains equal zero from the beginning, and then gradually reach to the final value and remain unchangeable. This phenomenon is in general due to the fact that there are no evident plastic deformation occurred at A1 and A2 when the tool moves far from the selected points. Further, the final strains of the two nodes are close to each other for they undergo approximately identical deformations in spite of the difference of occurring sequence.
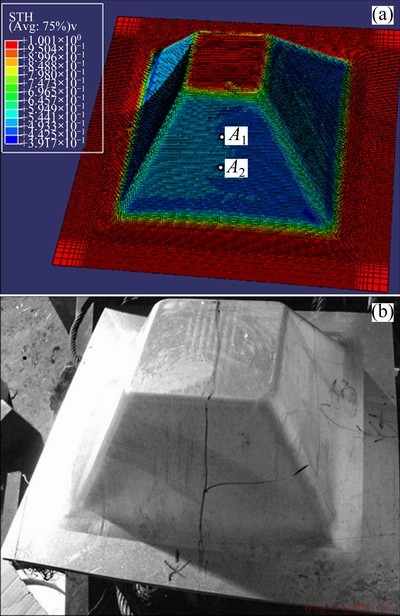
Fig. 3 Simulation (a) and experimental result (b) of benchmark part (A1, A2: selected nodes)

Fig. 4 Principle strain history of nodes A1 and A2
3.2 Experimental verification
The verification test for the designed part was carried out on a 3-axis milling machine. In the process, the tool��s feeding rate was set to 1500 mm/min and oil was applied to further minimize the friction. Meanwhile, all process parameters, such as tool diameter and depth increment, were strictly equal to those in simulation model. The formed product is also exhibited in Fig. 3.
For validating the previous FEM model, the thickness distribution along with the longitude-sectional profile was obtained, as shown in Fig. 5. Meanwhile, the comparison between the numerical and experimental result was made. In terms of the thickness variations in the radial direction, the whole deformation area could be divided into three distinct parts: AB, BC and CD regions. At the vicinity of the center of the parts, the blank suffers from little plastic deformation and therefore the thickness is close to its initial value. With the increase of the distance, the thickness swiftly reduces in AB region, to a comparatively stable value in BC region and then increases to 1 mm. Although there is a little difference at some areas, the thickness distributions of the numerical and experimental result are in substantial agreement. Therefore, the previous FEM model was verified.
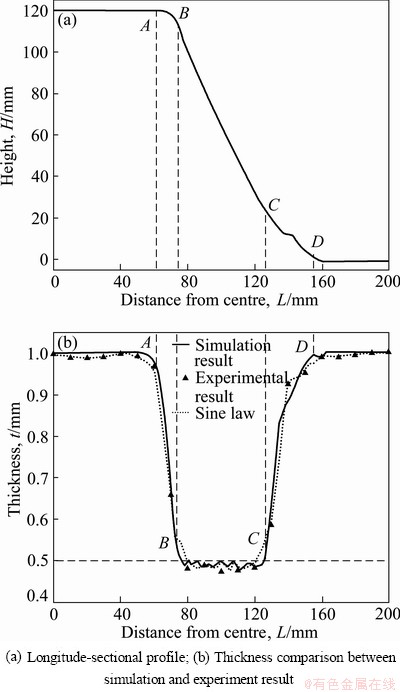
Fig. 5 Simulation result of truncated pyramid
4 Discussion
4.1 thickness distribution
In the previous researches, the sine law, t=t0sin ��, has always been used to predict the final thickness in ISF process [9,14]. In this expression which is derived from shear deformation, t is the ultimate sheet thickness, t0 is the initial thickness and �� is the wall angle. In our study, as �� is 30��, the thickness after forming can be easily calculated to be 0.5 mm. As depicted in Fig. 5, the deformation area from point A to point D has been divided into three segments. In BC region, the thickness fluctuates slightly around 0.5 mm. However, this is not the case in AC and CD regions. The difference between them may be attributed to the different deformation characteristics. The material in BC area is mainly subjected to a pure shear deformation [15,16], while the stretching deformation and bending deformation coexist in the other two areas [6].
In order to verify the effectiveness of the sine law further, samples were made in 12 positions and were marked by straight lines along certain directions in Fig. 6. It should be noted that the values of 40 mm, 70 mm and 100 mm represent the depths where the corresponding specimens are located. All the specimens are shown in Fig. 7.
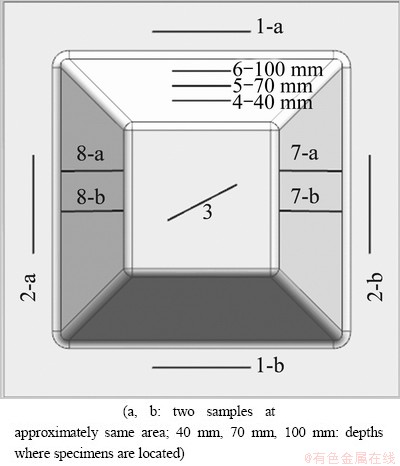
Fig. 6 Positions of specimens
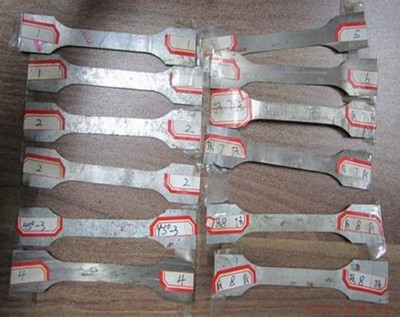
Fig. 7 Specimens taken from formed pyramid
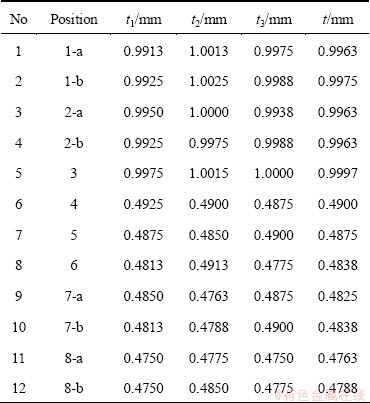
For each specimen, measure the thickness at three positions and calculate their average. Table 1 lists the measuring results of all the samples. In Table l, t represents the mean thickness. Obviously, the thickness of specimens 1-5 is close to 1 mm for the reason that they are located in nearly undeformed areas. On the contrary, as specimens 6-12 lies in the areas similar to BC region shown in Fig. 5, the thickness of them is near to the predictive value of sine law. However, the actual thickness is somewhat less than the prediction.
Table 1 Measuring results of thickness of all specimens
4.2 Minimum thickness and its location
The reduction rate of thickness is of great concern in manufacturing industry. However, thickness reduction is one of the main defects of incremental forming, especially for parts with a steep wall angle. As the forming performance of incremental forming is primarily dependent on the tool trajectory, the influence of tool path on the minimum thickness was discussed in our study. Considering the long simulation time, a relatively small truncated cone with the height of 35.5 mm, the wall angle of 35�� and the major diameter of 70 mm was taken as our research subject here.
Figure 8 shows three kinds of tool trajectory. The first two which often adopt constant step depth can be conveniently achieved by CAM software but have an evident feeding path causing depressions. Spiral trajectory won��t be bothered by feeding path, but it is difficult to generate for complex parts. Therefore, the former two kinds are common in previous studies and are closely related with process parameters. As the wall angle is definite for a given part, step depth and tool diameter were analyzed in our study. The numerical results with different process parameters are illustrated in Fig. 9.
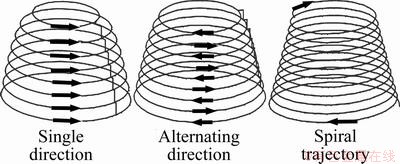
Fig. 8 Three kinds of tool trajectory
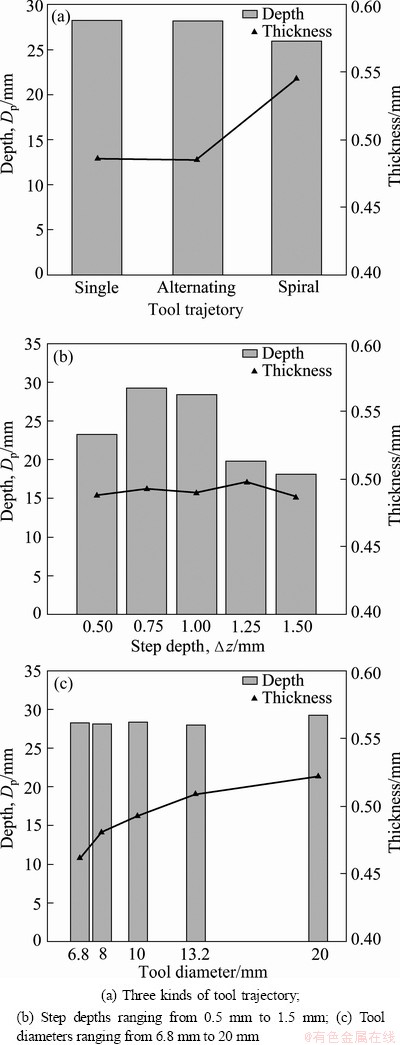
Fig. 9 Minimum thickness and its location under condition of varying process parameters
It is known that the larger minimum thickness and the deeper location of the least thickness lead to more uniform thickness distribution. As shown in Fig. 9, spiral trajectory has much larger thickness than that of conventional tool path, and their locations of the minimum thickness are nearly of the same height. Besides, step depth has little effect on the minimum thickness but has significant association with its location. With the increase of step depth, the depth of the minimum thickness increases initially and then decreases. The optimum value of step depth should be 0.75 mm. In addition, tool diameter almost has nothing to do with the location of the minimum thickness, but the thickness will increase continuously as the size of tool diameter grows. Further, it should be observed that the minimum thickness is not located at the bottom of the formed part. And it is possible to predict the location of the least thickness based on the values of process parameters.
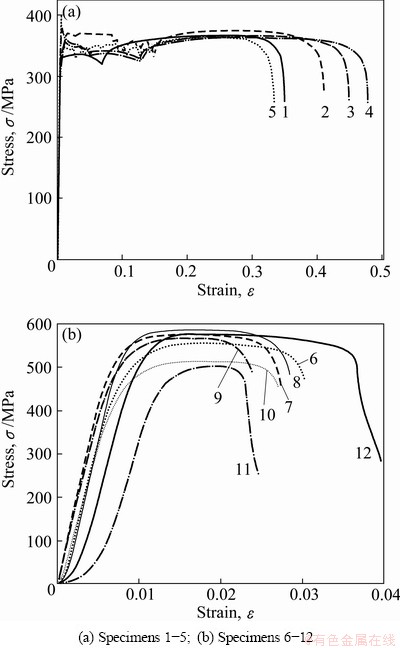
Fig. 10 Strain-stress curves of tensile tests
4.3 Mechanical property after forming
Tensile tests with all the specimens shown in Fig. 7 were carried out under the condition that the drawing speed was 6 mm/s. Figure 10 presents the strain-stress curve of each specimen. As specimens 1-5 were sampled in approximately undeformed areas, their strain-stress curves exhibit the initial mechanical property of DC04. It is obvious that there exists a clear yield platform. Meanwhile, the yield strength is almost equivalent to the tensile strength of the material, which proves that there is no distinct work hardening effect during the drawing test. On the contrary, the curves of specimens 6-12 provide much information about mechanical performance after ISF process. Each specimen breaks swiftly after going through a short elastic deformation stage and a brief plastic deformation stage. The maximum strain of each specimen decreases notably and is less than 4%. The material which has good plasticity before can be taken as a brittle material now. It is interesting to note that the curves of samples 11 and 12 have a curvature at the beginning. The reason is that the ends of the two specimens are a little bent, which is in accordance with the bending deformation discussed in Section 4.1. Further, the average elongation declines sharply by 94% and the average tensile strength increases significantly by 51%. The result shows that work hardening arises remarkably during ISF process and therefore the strength increases and the plasticity decreases.
5 Conclusions
1) The tool trajectories in both the simulation model and real process are the same by creating the displacement boundary conditions of the forming tool based on the tool��s 3-D coordinates from APT file. The principle strain history for selected nodes reveals that the intermediate principle strain is constantly close to zero and therefore the deformation remains to be a plane strain state.
2) According to the thickness distribution, the deformation area is divided into three regions. The sine law has been verified in the region primarily subjected to shear deformation although the predictive value is slightly less than the real thickness. However, this rule does not apply to the other two regions where the bending deformation occurs. How to recognize the three regions quantitatively is an interesting work in the future.
3) Spiral trajectory, appropriate step depth and large tool diameter lead to more uniform thickness distribution. The minimum thickness is much associated with tool diameter if traditional tool trajectory is employed, and its location is largely decided by step depth.
4) The tensile experiment indicates that the elongation of the material decreases sharply but the strength increases markedly owing to the significant work hardening effect during ISF process.
References
[1] JACKSON K, ALLWOOD J. The mechanics of incremental sheet forming [J]. Journal of Materials Processing Technology, 2009, 209(3): 1158-1174.
[2] JESWIET J, MICARI F, HIRT G, BRAMLEY A, DUFLOU J, ALLWOOD J. Asymmetric single point incremental forming of sheet metal [J]. Cirp Annals-Manufacturing Technology, 2005, 54(2): 623-649.
[3] JACKSON K R, ALLWOOD J M, LANDERT M. Incremental forming of sandwich panels [J]. Journal of Materials Processing Technology, 2008, 204(1-3): 290-303.
[4] SHIM M S, PARK J J. The formability of aluminum sheet in incremental forming [J]. Journal of Materials Processing Technology, 2001, 113(1-3): 654-658.
[5] ISEKI H. An approximate deformation, analysis and FEM analysis for the incremental bulging of sheet metal using a spherical roller [J]. Journal of Materials Processing Technology, 2001, 111(1-3): 150-154.
[6] MA L W, MO J H. Three-dimensional finite element method simulation of sheet metal single-point incremental forming and the deformation pattern analysis [J]. Proceedings of the Institution of Mechanical Engineers Part B: Journal of Engineering Manufacture, 2008, 222(3): 373-380.
[7] BAMBACH M, TALEB ARAGHI B, HIRT G. Strategies to improve the geometric accuracy in asymmetric single point incremental forming [J]. Production Engineering, 2009, 3(2): 145-156.
[8] HIRT G, AMES J, BAMBACH M, KOPP R. Forming strategies and process modelling for CNC incremental sheet forming [J]. Cirp Annals-Manufacturing Technology, 2004, 53(1): 203-206.
[9] JESWIET J, YOUNG D. Wall thickness variations in single-point incremental forming [J]. Proceedings of the Institution of Mechanical Engineers Part B: Journal of Engineering Manufacture, 2004, 218(11): 1453-1459.
[10] ZHOU Jie, HU Jian-biao, ZHANG Xu, LI Jun-chao. Numerical simulation and experimental investigation of double-stage sheet incremental forming [J]. Journal of Chongqing University, 2011, 34(7): 46-50. (in Chinese)
[11] HIRT G, AMES J, BAMBACH M. A new forming strategy to realise parts designed for deep-drawing by incremental CNC sheet forming [J]. Steel Research International, 2005, 76(2-3): 160-166.
[12] HADOUSH A, VAN DEN BOOGAARD A. Time reduction in implicit single point incremental sheet forming simulation by refinement-derefinement [J]. International Journal of Material Forming, 2008, 1: 1167-1170.
[13] HAN F, MO J. Numerical simulation and experimental investigation of incremental sheet forming process [J]. Journal of Central South University of Technology, 2008, 15(5): 581-587.
[14] ZHOU Liu-ru. Research on the thickness change laws in numerical control incremental sheet forming [J]. Jounal of Mechanical Engineering, 2011, 47(18): 50-54. (in Chinese)
[15] FILICE L, FRATINI L, MICARI F. Analysis of material formability in incremental forming [J]. Cirp Annals-Manufacturing Technology, 2002, 51(1): 199-202.
[16] EMMENS W C, VAN DEN BOOGAARD A. Strain in shear, and material behaviour in incremental forming [J]. Key Engineering Materials, 2007, 344: 519-526.
������ֵģ��Ľ�����Ľ������ΰ��ֲ�����ѧ���ܷ���
��������� �磬��ͬ��
�����ѧ ���Ͽ�ѧ�빤��ѧԺ������ 400044
ժ Ҫ���Է�̨Ϊ��ģ�ͣ�������ֵģ������������о�������Ľ������εİ�ĺ�ȷֲ�����ѧ���ܣ�����������������Ԫģ�Ͳ�����������֤��ͨ���Գ��ι���ͷ��λ��Լ������֤����Ԫģ���еij��ι켣��ʵ�ʼӹ�ʱһ�¡���֤���ҷ���Ԥ�������Ч�ԣ��о����ι켣����С�����λ�õĹ�ϵ������������÷���ֻ�������Դ�������η�ʽΪ���ij���������С����빤��ͷֱ��������أ�����λ��������ڲ��࣬���κ�����������������������κ�������Լ����½���ͬʱ���ڼӹ�Ӳ����Ӱ�쵼��ǿ��������ǿ��
�ؼ��ʣ��������Σ���ֵģ�⣻������ԣ�ǿ��
(Edited by CHEN Ai-hua)
Foundation item: Project (51005258) supported by the National Natural Science Foundation of China; Project (CDJZR12130065) supported by the Fundamental Research Funds for the Central Universities of China
Corresponding author: LI Jun-chao; Tel: +86-27-65105164; E-mail: ljchust@163.com
Abstract: The thickness distribution and mechanical property of a truncated pyramid processed by incremental forming were investigated based on numerical simulation and tensile tests. A finite element method (FEM) model was set up and then experimentally verified. The tool path of the simulation model was assured to be the same with that of the real process by adding the displacement constraints on the forming tool. Afterwards, the sine law used to predict the final thickness was verified, but it was only applied to the region mainly subjected to pure stretching deformation. Additionally, the relation between the tool path and the minimum thickness as well as its location was discussed. The result indicates that the minimum thickness is much related to tool diameter if a traditional tool trajectory is employed, and its location is largely determined by step depth. Finally, tensile tests with specimens taken from the formed pyramid were carried out. It is indicated that the plasticity of the material decreases sharply while the strength increases markedly owing to the significant work hardening effect during ISF process.
