
J. Cent. South Univ. (2012) 19: 1938-1945
DOI: 10.1007/s11771-012-1229-5![]()
Grey correlation analysis of factors influencing maldistribution in feeding device of copper flash smelting
ZHOU Ping(��Ƽ)1, YAO Ying-jin(Ңӱ�)1, AI Yuan-fang(��Ԫ��)1,
LIU An-ming(������)2, XU Ze-lin(������)1, XIE Jian-cai(���)2
1. School of Energy Science and Engineering, Central South University, Changsha 410083, China;
2. Jinlong Copper Co., Ltd., Tongling 244100, China
? Central South University Press and Springer-Verlag Berlin Heidelberg 2012
Abstract:
An experimental model of maldistribution was established and grey correlation analysis method was employed to describe quantitatively the maldistribution phenomenon in the feeding device of copper flash smelting. Particle motion in the feeding device was separated into uniform flow in chute and restricted slanting parabolic motion in distributor channel. Factors affecting particle velocity at the chute outlet and particle moving distance in the distributor channel, which also cause the maldistribution, were analyzed based on the assumption of pseudo fluid. Experiments were conducted to study the maldistribution using river sand. The results indicate obvious mass maldistribution and an even higher degree with the increase of feeding mass rate; meanwhile, size maldistribution is negligible. Also, feeding intensity has a larger impact on circumferential maldistribution than on radial maldistribution. Based on the experimental results of the eight factors impacting the maldistribution, grey relation of each factor was calculated using grey correlation analysis. The importances of these factors were sequenced. The results show that a proper adjustment of the structure will ameliorate the maldistribution phenomenon in the feeding device of copper flash smelting.
Key words:
particle maldistribution; grey correlation; pseudo fluid; copper flash smelting��
1 Introduction
An increasing intensity of copper flash smelting has led to a higher degree of material maldistribution in the feeding device of concentrate spray nozzle (particle maldistribution) [1-2], thus adversely impacting the production. An uneven distribution of particles in the reaction tower hampers the effective utilization of the reacting space. Meanwhile, large concentration of particles in local domains decreases the oxygen concentration around, thus leading to incomplete reaction of the raw materials. Moreover, high-temperature zone near the wall and lining erosion decrease the operational life span of the flash furnace. Therefore, the uniform feeding of particles would enhance the effective mixing between gas and particles, the complete reaction of particles, the formation of highly-efficient reacting zone, and the favorable temperature distribution in the tower, under a high feeding mass rate [3-4].
The geometric configuration of the feeding device is the main factor that causes the maldistribution [5]. There are various configurations of particle feeding devices in the currently running flash furnaces in different plants according to the restrain of circumstances, e.g. space and facility, thus causing various conditions of maldistribution in the reacting tower. Study of this phenomenon through direct observation and examination is difficult due to the high temperature, strong oxide and enclosing boundary inside the flash furnace. Further difficulties are also met with theoretical analysis. These reasons above have left the study of particle maldistribution with little flexibility but cold experiments. In the present work, an experimental model of particle feeding device of copper flash smelting was built based on a real system. Effects of different parameters, e.g. configuration, mass flux and particle species, on the particle maldistribution were measured.
Grey correlation method can be used to determine the uncertain relations among factors or their contribution to a given system by calculating the absolute value of the data difference between sequences. The grey theory, on the other hand, uses relatively small datasets and does not demand strict compliance to certain statistical laws among the observables [6-8]. Thus, grey correlation method was used to analyze the experimental data and to compare and sort the importance of different factors affecting particle maldistribution. These are supposed to provide basis for optimal design to improve the operating conditions of the particle feeding device and to increase the smelting intensity.
2 Model of particle maldistribution
2.1 Classification of maldistribution phenomenon
Maldistribution is a phenomenon that flowing particles distribute non-uniformly in the plane perpendicular to the axis of the pipe. As for the particle feeding system of copper flash smelting, maldistribution is the uneven distribution of particles on horizontal cross-section of distributor channel after flowing out from the feeding system.
Particle maldistribution is divided into local maldistribution, circumferential maldistribution and redial maldistribution, according to the spatial distribu- tion of particles on the cross-section of the distributor channel. For local maldistribution, the concentration zones of particles distribute randomly across the entire section while for circumferential maldistribution and radial maldistribution, the concentration zones of particles distribute either along periphery or along the radius. These can be seen in Fig. 1, in which black zones are those that particles concentrate in.
2.2 Function of maldistribution
Mass maldistribution and size maldistribution are defined based on the statistical method of the particle distribution in certain cross-section, in which mass is measured in mass maldistribution and average particle size is measured in size maldistribution. Then, mass maldistribution function can be defined as
![]() (i=1, 2, ��, n) (1)
(i=1, 2, ��, n) (1)
where i is the cell number divided in a cross-section, ��i is the mass of particles per area of the i-th cell, and ![]() denotes the average mass of particles per area over the whole cross-section.
denotes the average mass of particles per area over the whole cross-section.
Similarly, size maldistribution is given by
![]() (i=1, 2, ��, n) (2)
(i=1, 2, ��, n) (2)
where ![]() is the average particle size in the i-th cell and
is the average particle size in the i-th cell and ![]() refers to the average particle size over the whole cross-section.
refers to the average particle size over the whole cross-section.
In Eq. (2), there are
![]() (j=1, 2, ��, k) (3)
(j=1, 2, ��, k) (3)
![]() (i=1, 2, ��, n) (4)
(i=1, 2, ��, n) (4)
where j is the group of particle size; dj is the size of particles of group j; m is the mass of particles through the
cross-section,![]() ; mi,j is the mass of particles of
; mi,j is the mass of particles of
the j-th group in the i-th cell; mi is the total mass of particles in the i-th cell.
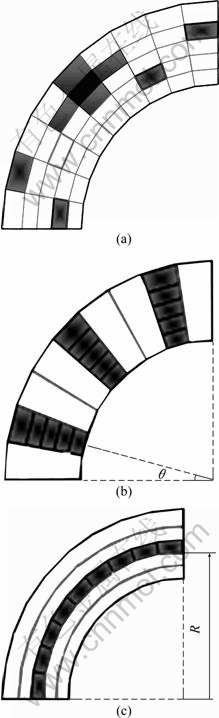
Fig. 1 Sketch of maldistribution types: (a) Local maldistribution; (b) Radial maldistribution; (c) Circumferential maldistribution
2.3 Normalization of particle maldistribution function
Linear normalization was made for the calculated particle maldistribution grade, mapping the value between 0 and 1. The following equation was used:
![]() (5)
(5)
The maximum value of Mm is ![]() by mathematical analysis of Eq. (1) [9]. Substitute this to Eq. (5), then the normalized mass maldistribution
by mathematical analysis of Eq. (1) [9]. Substitute this to Eq. (5), then the normalized mass maldistribution ![]() would be
would be
![]() (6)
(6)
where ![]() represents a uniform distribution of particles. The bigger the
represents a uniform distribution of particles. The bigger the ![]() value is, the higher the degree of particle maldistribution will be. When
value is, the higher the degree of particle maldistribution will be. When ![]() =1, mass maldistribution attains the peak.
=1, mass maldistribution attains the peak.
Similarly, the normalized size maldistribution ![]() is given by
is given by
![]() (7)
(7)
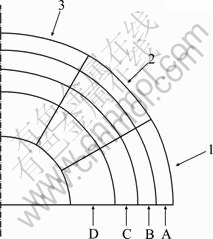
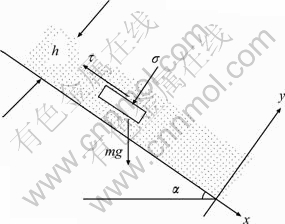
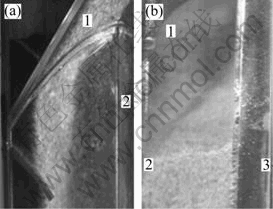
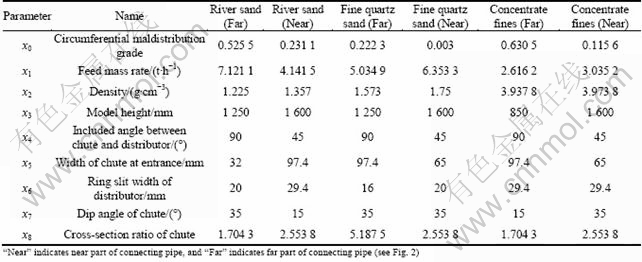
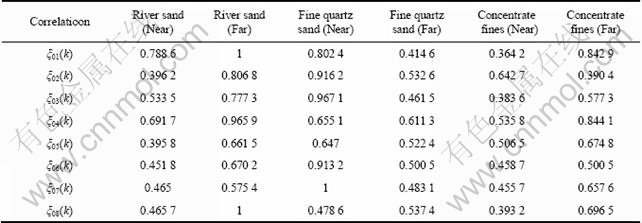
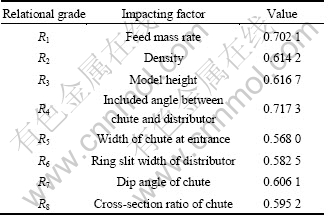
According to industrial data and experimental results, particle maldistribution could be neglected when M��<0.1. When 0.1 3 Experimental model A model of particle feeding device of copper flash smelting was constructed based on a real system. Only half of the original configuration was built considering the symmetry of the system, and the size of the model is 1/4 that of the real one. The model is made of transparent organic glass, as shown in Fig. 2. In the model, the Y-type connecting pipe is 100 mm deviated from the center of the chute. In the experiment, the connecting pipe nearer to the chute is called the near part and the other the far part. Fig. 2 Sketch of experimental model for pre-dispersed feeding device in flash furnace: 1��Y-type connecting pipe; 2��Circular-to-square connecting pipe; 3��Chute; 4��Baffle of chute; 5��Central oxygen pipe; 6��Baffle of distributor channel A key step of the experiment is to measure the mass and size of particles in divided areas (cells) of the cross-section of distributor channel. Thus, a granular collector was set under the distributor channel. The granular collector reserves particle in different cells, then particles can be sieved and weighted, respectively, providing data for different maldistribution functions. Considering the symmetry characteristic, half the Y-type connecting pipe was taken, then particles would be distributed in 1/4 of a circular area after passing the chute. The cell areas of the granular collector were determined through the following steps. First, determine the size of layer A, which depends on the flow area of process air. Then, calculate the size of layers B and C, giving that they have the same area as A. Finally, the area left is regarded as layer D. Each layer was trisected along circumferential direction and referred to by 1, 2 and 3. Thus, the cross-section of granular collector was divided into twelve cells as shown in Fig. 3. Fig. 3 Sketch of granular collector 4 Flow of copper concentration particles The size of most copper concentration particles are among 10-120 mm [10]. The particle flow characteristic in the feeding system obeys that of the granular flow. Investigations have been made on the flow characteristics of particles [11-14], in which the friction and collision stress among particles were mostly simplified as vicious stress. Hence, a constitutive law of granular flow was built in a manner analogous to the fluid flow. Since there is major difference between the characteristics of granular flow and Newtonian fluid flow, the granular flow was assumed to be non-Newtonian flow in the pseudo fluid method [14]. The path that copper concentration flows through is from Y-type connecting pipe, circular-to-square connecting pipe to the chute and then the distributor channel. Particle motion in the blanking device is separated into uniform flow in the chute and restricted slanting parabolic motion in distributor channel. 3.1 Granular flow inside chute The model is made of organic glass to minimize the wall friction of the chute. Concentration particles are motivated jointly by gravity, shear stress and normal stress [15] (see Fig. 4). Take h as the thickness of the granular flow, �� as the dip angle of the chute, and x direction is down along the incline. Fig. 4 Force analysis of granular flow in chute Assuming that granular flow in the chute is uniform and steady, based on non-Newtonian fluid model, the velocity of particles leaving the chute can be deduced as [16] and where �� is the density of the granular flow; g is the acceleration of gravity; m�� is the exponential term of velocity gradient of the non-newtonian fluid; �� is the angle of repose; i�� and A are exponential of the normal stress and coefficient of proportionality in the viscosity function of granular flow, respectively; ub is the surface velocity of the particles in the chute and 4.2 Granular flow in distributor channel When neglecting the scattering effects caused by the free falling, particle motion in the distributor channel can be regarded as slanting parabolic motion. Assume that the projectile velocity of a certain flow layer is u, the included angle between u direction and horizontal direction, ��, equals the dip angle of the pipe. The motion equation of projected particles under gravity only is where H is the vertical displacement while L is the horizontal displacement. Particles may hit the wall of the distributor channel and rebound during their falling, because of the limited width of the channel. Assume the actual vertical displacement of the particles is l, then where d is the width of the ring slit of the distributor, and �� is the rebounded distance which is dependent on the physical properties of the particle and wall materials. 4.3 Factors affecting particle distribution at outlet of distributor channel From sections 3.1 and 3.2, it could be concluded that position of particles entering the granular collector is affected both by the initial velocity of projection and by the moving distance of restrained slanting parabolic motion. From Eqs. (8)-(11), we can obtain where f1 and f2 indicate certain functional relations. The thickness of particle flow, h, is dependent on the feeding mass rate, inlet width and change rate of cross-section of the chute. The included angle between the chute and the baffle of the distributor channel also affect the position of particles at the outlet of distributor channel. Parameters m��, �� and �� are determined by the particle property and wall material of the distributor channel and are treated as constants. It can be seen from Eqs. (12) and (13) that the main factors that influence the landing position of particles in the model are the density of particle ��, the dip angle of the chute ��, the feeding mass rate m, the width of chute at entrance W, the change rate of cross-section of the chute rW, the angle between the chute and the baffle plate of distributor q, the ring slit width of the distributor d, and the model height H. 5 Experiments of particle maldistribution in feeding device River sand was adopted to study the particle maldistribution of feeding device in the process of copper flash smelting. Experiments were conducted with 15 different kinds of feeding mass rates from the far part of the connecting pipe. 5.1 Experimental procedure Experiments were conducted with the following steps after leveling of the model. 1) Take proper amount of particles with balance and put them into the connecting pipe; 2) Use a baffle to adjust the rate of feeding mass, assuring the steady inventory of particles; 3) Photograph the motion of particles from facade and profile of the distributor channel with high speed photogrammetric instrument when particles pass the plant, providing information for qualitative analysis of the particle distribution; 4) Sieve and weigh the particles in the twelve cells of the granular collector, respectively, and record data of the mass and size; 5) Change the feeding rate, and repeat steps 1)-4). 5.2 Qualitative analysis of particle maldistribution Figure 5 shows a set of photos recorded by high speed photogrammetric instrument. From the analysis of particle distribution in the distributor channel under different working conditions, it can be seen that: 1) Obvious circumferential maldistribution was observed. Particles rushed toward the baffle in the distributor channel under the action of inertial force after leaving the chute, causing a concentration of particles in 1/3 area around the plate, while the other 2/3 of the circumferential area shared little particles. Particles fell without obvious bounce after hitting the plate/wall. 2) Local maldistribution is visible, especially at outer annulus and corner area formed by wall and plate. Fig. 5 Photographs of motion of river sand in connecting piece of chute and distributor channel (1��Chute; 2��Outer annulus of chute; 3��Central oxygen pipe): (a) Side view; (b) Front view 5.3 Quantitative analysis of particle maldistribution Experimental data of 15 kinds of different feeding mass rate conditions were processed with Eqs. (1)-(7), and results are given in Table 1. The following items can be seen from Table 1. 1) 2) Mass local maldistribution ( Table 1 Maldistribution results of river sand with different feeding mass rates when feeding from far part 6 Grey correlation analysis of factors affecting circumferential maldistribution It can be seen from the above analysis that various factors have effect on particle maldistribution in the feeding device of copper flash smelting and these factors interact in a complex way. In order to determine the importance of these factors, grey correlation analysis was used to evaluate the experimental results. 6.1 Experiments of particle maldistribution under various conditions According to the results above, the main factors affecting the particle maldistribution of the model of feeding device are the density of the particles, the dip angle of the chute, the feeding mass rate, the width of the chute at entrance, the cross-section ratio of the chute, the angle between the chute and baffle of distributor channel, the ring slit width of the distributor and the model height. Experiments were conducted with different combinations of these eight parameters. The results are given in Table 2. Considering that circumferential mass maldistribution has a relatively high sensitivity to the change of influential factors, it was used in the analysis to determine the grade of maldistribution. 6.2 Normalization of raw data Take the value of circumferential maldistribution as reference sequence, x0, and sequences of factors affecting particle maldistribution serve as comparison sequences xi. Use equalization method [17] to pre-process the raw data, transferring them into dimensionless data: where i=0, 1, 2, ��, m; k=1, 2, ��, n; m is the number of the factors and n is the number of experimental groups. 6.3 Grey correlation coefficient The coefficient of the transferred reference sequence and comparison sequences at t=k can be calculated with the following equation [18]: where k=1, 2, ��, N and N is the changing times of the experimental conditions (i.e., N=6 in the present work); �� is the resolution ratio, which is to enlarge the difference between various coefficients, and ��=0.5 is generally used [19-20]. Use ��01(k)-��08(k) to denote the correlation coefficients between the value of circumferential maldistribution and feeding mass rate, particle file density, model height, angle between the chute and the baffle in the distributor channel, inlet width of the chute, ring slit width of the distributor, dip angle of the chute and cross-section ratio, respectively. Then, the correlation coefficients calculated with Eq. (15) are given in Table 3. Table 2 Circumferential mass maldistribution grade in different experimental conditions Table 3 Calculation results of correlation factors 6.4 Grey relational grade Grey relational grade Ri can be determined by the average value of two sequences of coefficients, that is Manipulating the grey correlation coefficients with Eq. (16), grey relational grades of particle maldistribution in the feeding device were obtained, as listed in Table 4. 6.5 Results The effect of factors on control variables can be determined through the grey relational grade of reference sequence and comparison sequences. However, the absolute values of relational grade are meaningless until they are ordered. The aim of grey correlation analysis is to determine the importance of each factor on affecting the control variables through comparing their relational grades. The larger the relational grade is, the more important the factor will be. It can be seen from Table 4 that the sequence considering the influence of each factor on particle maldistribution is R4>R1>R3>R2>R7>R8>R6>R5. This indicates that, of all the factors examined, the included angle between the chute and the baffle plate of the distributor, the feed mass rate, the model height, the particle density, and the dip angle of the chute have larger impact on particle maldistribution, while other factors are relatively less important. Giving that density of the particle flow depends mainly on particle size, feeding mass rate and particle size should be adjusted in real production. In production, the increase of feed mass rate to increase production capacity may lead to more serious particle maldistribution, thus other important factors should be adjusted to offset the effect. Table 4 Result of grey relational grade 7 Conclusions 1) Particle maldistribution was classified into local maldistribution, circumferential maldistribution, radial maldistribution, according to the spatial distribution of particles, and mass maldistribution and size maldistribution according to physical parameters of the particles examined. The particle maldistribution is described by maldistribution grade, which lies between 0 and 1. Particle maldistribution could be neglected when M��<0.1. When 0.1 2) The experimental results indicate that size maldistribution is relatively weak with maldistribution grade less than 0.02. However, mass maldistribution manifests its importance with local maldistribution grades between 0.35 and 0.80, circumferential maldistribution 0.25-0.90 and radial maldistribution 0.60-0.75. In addition, the degree of maldistribution increases with increasing feeding mass rate. Also, feeding intensity has a larger impact on circumferential maldistribution than on radial maldistribution. 3) Granular flow in the feeding device was separated into uniform flow in chute and restricted slanting parabolic motion in distributor channel. Factors impacting particle velocity at the chute outlet and moving distance in the distributor channel, also those affecting the particle maldistribution, are the density of the particle flow, the dip angle of the chute, the feeding mass rate, the width of the chute at entrance, the cross-section ratio of the chute, the angle between the chute and baffle of distributor channel, the ring slit width of the distributor and the model height. 4) Grey correlation analysis of the experimental results indicates that the included angle between the chute and the baffle of the distributor channel, the feed mass rate, the model height, the particle density, the dip angle of the chute have larger impact on particle maldistribution than other factors. In production, major factors should be adjusted to weaken the particle maldistribution when increasing the feeding mass rate. References [1] SONG Xiu-ming. Optimization for concentration nozzle of Jinlong flash furnace [J]. China Nonferrous Metallurgy, 2006(1): 11-14. (in Chinese) [2] JIANG Gui-ping, LIAO Chun-fa. Development course and production practice of flash smelting nozzle [J]. Copper Engineering, 2008(2): 31-35. (in Chinese) [3] CHEN Zhuo, MEI Chi, CHEN Hong-rong, MO Jiao. Simulation of moving boundary of the reaction shaft in a flash smelting furnace [J]. Journal of Central South University of Technology, 2001, 8(3): 213-218. [4] CHEN Hong-rong, MEI Chi, XIE Kai, LI Xin-feng, ZHOU Jun, Operation optimization of concentrate burner in copper flash smelting furnace [J]. Trans Nonferrous Met Soc China, 2004, 14(3): 631-636. [5] WANG Xiao-hua. Study and improvement of central jet concentrate burner in flash smelter [J]. Mining & Metallurgy, 2005, 14(4): 34-37. (in Chinese) [6] DENG Ju-long, Control problems of grey systems [J]. System Control Letters, 1982, 1(5): 288-294. [7] KUO Yiyo, YANG Taho, HUANG Guan-wei. The use of grey relational analysis in solving multiple attribute decision-making problems [J]. Computers & Industrial Engineering, 2008, 55(1): 80-93. [8] XIE Yan-min, YU Hu-ping, CHEN Jun, RUAN Xue-yu. Application of grey relational analysis in sheet metal forming for multi-response quality characteristic [J]. Journal of Zhejiang University: Science A, 2007, 8(5): 805-811. [9] YAO Ying-jin. Model experimental study on maldistribution in the feeding device of copper flash furnace [D]. Changsha: Central South University, 2010, 27-37. (in Chinese) [10] LI Xin-feng, MEI Chi, ZHANG Wei-hua. Simulation of copper flash smelter [J]. Journal of Central South University of Technology, 2001, 32(3): 262-266. (in Chinese) [11] CHEVOIR F, ROUX J N, CRUZ F, ROGNON P G, KOVAL G Jr. Friction law in dense granular flows [J]. Powder Technology, 2009, 190(1/2): 264-268. [12] SILBERT L E, LANDRY J W, GRESTG S. Granular flow down a rough inclined plane: transition between thin and thick piles [J]. Phys Fluids, 2003, 15(1): 1-3. [13] JOP P, FORTERRE Y, POULIQUEN O. A constitutive law for dense granular flows [J]. Nature, 2006, 441(8): 727-729. [14] ELASKAR S A, GODOY L A. Constitutive relations for compressible granular materials using non-Newtonian fluid mechanics [J]. International Journal of Mechanical Sciences, 1998, 40(10): 1001-1018. [15] THOMPSON P A, GREST G S. Granular flow: Friction and the dilatancy transition [J]. Physical Review Letters, 1991, 67(13): 1751-1754. [16] LIU Chuan-ping, YUE Xian-fang, YIN Shao-wu. Experimental study on the constitutive relation of granular flow [J]. Journal of University of Science and Technology Beijing, 2009, 31(2): 256-260. (in Chinese) [17] YANG Jin, SUN Li-jun, LIU Li-ping. Analysis of factors influencing fatigue performance of rich-bottom using grey correlation theory [J]. Journal of Building Materials, 2008, 11(6): 662-665. (in Chinese) [18] MORA?N J, GRANADA E, MI?GUEZ J L, PORTEIRO J. Use of grey relational analysis to assess and optimize small biomass boilers [J]. Fuel Processing Technology, 2006, 87(2): 123-127. [19] DENG Ju-long. Introduction to grey system [J]. Journal of Grey System, 1989, 1(1): 1-24. [20] CHIANG Ko-ta, CHANG Fu-ping. Optimization of the WEDM process of particle-reinforced material with multiple performance characteristics using grey relational analysis [J]. Journal of Materials Processing Technology, 2006, 180(1/2/3): 96-101. (Edited by YANG Bing) Foundation item: Project(2010AA065201) supported by the National High Technology Research and Development Program of China Received date: 2011-04-12; Accepted date: 2011-09-29 Corresponding author: AI Yuan-fang, Associate Professor, PhD; Tel: +86-13077391372; E-mail: yfai@csu.edu.cn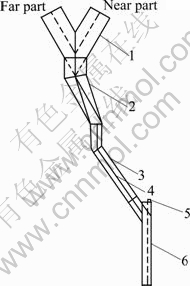
![]() (8)
(8)
![]()
![]() . Parameters m, b, i�� and A depend on the physical properties of the particles, thus could be regarded as constants.
. Parameters m, b, i�� and A depend on the physical properties of the particles, thus could be regarded as constants.![]() (9)
(9)![]() (10)
(10)![]() (11)
(11)![]() (12)
(12)![]() (13)
(13)
![]() <0.02, indicating that size maldistribution in the feeding device is weak enough to be neglected. In this manner, particle size has little influence on the particle maldistribution of the device. Therefore, it is reasonable to adopt the pseudo fluid assumption, which neglects the effect of particle size, to analyze the granular flow.
<0.02, indicating that size maldistribution in the feeding device is weak enough to be neglected. In this manner, particle size has little influence on the particle maldistribution of the device. Therefore, it is reasonable to adopt the pseudo fluid assumption, which neglects the effect of particle size, to analyze the granular flow.![]() ), mass circumferential maldistribution (
), mass circumferential maldistribution (![]() ) and mass radial maldistribution (
) and mass radial maldistribution (![]() ) are all obvious, which match the qualitative analysis in section 5.1. In addition, it is obvious that the value of maldistribution increases with increasing feeding mass rate and this phenomenon is more obvious with circumferential maldistribution. This could be explained by the connection mode of the chute and the distributor channel. Particles rush toward the baffle in the distributor channel under the action of inertial force after leaving the chute, then fall without obvious bounce after hitting the plate/wall, and accumulate near the baffle, leading to serious circumferential maldistribution.
) are all obvious, which match the qualitative analysis in section 5.1. In addition, it is obvious that the value of maldistribution increases with increasing feeding mass rate and this phenomenon is more obvious with circumferential maldistribution. This could be explained by the connection mode of the chute and the distributor channel. Particles rush toward the baffle in the distributor channel under the action of inertial force after leaving the chute, then fall without obvious bounce after hitting the plate/wall, and accumulate near the baffle, leading to serious circumferential maldistribution.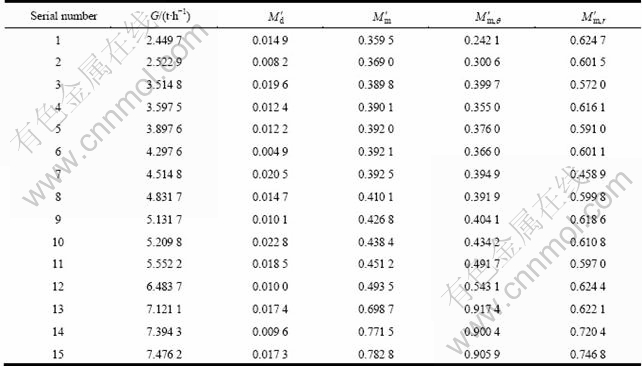
 (14)
(14)![]()
![]() (15)
(15)
![]() (16)
(16)
Abstract: An experimental model of maldistribution was established and grey correlation analysis method was employed to describe quantitatively the maldistribution phenomenon in the feeding device of copper flash smelting. Particle motion in the feeding device was separated into uniform flow in chute and restricted slanting parabolic motion in distributor channel. Factors affecting particle velocity at the chute outlet and particle moving distance in the distributor channel, which also cause the maldistribution, were analyzed based on the assumption of pseudo fluid. Experiments were conducted to study the maldistribution using river sand. The results indicate obvious mass maldistribution and an even higher degree with the increase of feeding mass rate; meanwhile, size maldistribution is negligible. Also, feeding intensity has a larger impact on circumferential maldistribution than on radial maldistribution. Based on the experimental results of the eight factors impacting the maldistribution, grey relation of each factor was calculated using grey correlation analysis. The importances of these factors were sequenced. The results show that a proper adjustment of the structure will ameliorate the maldistribution phenomenon in the feeding device of copper flash smelting.
