

J. Cent. South Univ. (2021) 28: 2067-2078
DOI: https://doi.org/10.1007/s11771-021-4753-3

Multi-factor influence of cross-sectional airflow distribution in roadway with rough roof
HU Jian-hua(������)1, ZHAO Yang(����)1, ZHOU Tan(��̹)1, MA Shao-wei(����ά)1,WANG Xue-liang(��ѧ��)2, ZHAO Lei(����)2
1. School of Resources and Safety Engineering, Central South University, Changsha 410083, China;
2. Hubei Sanning Mining Co., Ltd., Yichang 443000, China
 Central South University Press and Springer-Verlag GmbH Germany, part of Springer Nature 2021
Abstract:
The wall surface roughness renders a significant impact on ventilation of roadways and cross-sectional wind speed distribution. Herein, the wall roughness (Ra) in the roadway has been defined theoretically. Moreover, three-center arched roadway models for different situations are established based on the normal distribution of roof roughness. The influence of inlet velocity, roof roughness and roadway height on wind speed distribution is systematically studied by using Fluent software. At Ra=0.1 m, the simulation results reveal that the wind speed is negatively related to the distance from the wall to the point where 80% of the central wind speed is reached (DA). Also, the wind speed distribution is significantly influenced by increasing the roof roughness. However, the wind speed distribution becomes asymmetric at Ra=0.2 m and 0.3 m. Furthermore, the low-speed area (v��1 m/s) started to concentrate on the roof with the increase of roadway height. Overall, an Ra value of <0.1 m can reduce the influence of wall roughness on wind speed distribution of the roadway, which is suggested in practical applications.
Key words:
roughness model; roadway section; airflow distribution; numerical simulation; mine ventilation��
Cite this article as:
HU Jian-hua, ZHAO Yang, ZHOU Tan, MA Shao-wei, WANG Xue-liang, ZHAO Lei. Multi-factor influence of cross-sectional airflow distribution in roadway with rough roof [J]. Journal of Central South University, 2021, 28(7): 2067-2078.
DOI:https://dx.doi.org/https://doi.org/10.1007/s11771-021-4753-31 Introduction
Mineral resources have played an important role in the development of human society. In the last century, industrial development has increased the demand for mineral mining, which is expected to continue in the near future [1]. However, the production environment of underground mines is extremely poor, and the presence of gases and dust particles raises health hazards for mine workers. Therefore, a good ventilation system is necessary to ensure a safe production environment in mines [2-4]. An effective ventilation system should provide fresh air, remove harmful gases and dust particles, and maintain temperature and humidity at appropriate levels [5-7].
In order to understand the changes in wind speed, velocity sensors are usually installed in roadways for real-time monitoring [8]. Single-point measurements are often used in mines due to the cost and underground environment limitations. However, a single velocity sensor is installed at the top of the roadway, whose measurement accuracy is influenced by the wind speed distribution [9]. Therefore, the wind speed distribution on the section should be studied to improve measurement accuracy, ensure efficient ventilation and provide a reasonable distribution of air volume.
The distribution of wind speed at roadways has been experimentally and theoretically analyzed by several research groups. For instance, DING [10] has obtained the average wind speed distribution of trapezoidal roadways through numerical simulations and experimental measurements. Moreover, LIU et al [11] have utilized non-contact laser doppler anemometry (LDA) to analyze the wind speed distribution of a rectangular symmetrical roadway with a sudden expansion. In addition, LUO et al [12] have investigated the influence of different support methods, such as bolt support, I-steel support, spray anchor support and flat wall, on wind speed distribution.
However, these studies have focused on regular and symmetrical roadways, which do not conform to the actual production process. In addition, the rectangular roadway models have been studied, but the three-element arch roadways, which are commonly used in mines, have not been explored yet. One should note that the over-excavations and under-excavations occur during the construction, resulting in irregular and asymmetrical sections with significant differences in wall roughness, section shape and size. Therefore, the influence of wall roughness should be paid more attention.
ZOU et al [13] have theoretically studied the influence of wall roughness on flow characteristics of channels. ZHANG et al [14] have utilized numerical simulations to study the ventilation effect of a typical rough wall model during tunnel construction. MILICI [15] has studied the near-wall turbulence filled with particles in the rough channel. CHENG et al [16] have constructed a particle effect model and described the influence of wall-surface roughness on particle-wall collision in a closed flow channel. KENT et al [17] have studied the relationship between urban morphological parameters, i.e., roughness, and wind speed through a global elevation model. EDWARD et al [18] have described the urban surface morphology and flatness, and presented a method to improve the wind environment of high-density cities by using wind tunnel tests and numerical simulations.
One should note that the influence of rough walls on the flow field has been widely investigated and rendered certain results. However, these studies mainly focused on collision between rough walls and particles at the micro-level and urban morphological parameters at the macro level. Even though there are a few studies on the flow field under rough wall roadway, but the studied rough wall surface is composed of regular rectangles, triangles and sin curves, which is different from the actual roadway wall surface.
Herein, a roadway model with a rough roof under the normal distribution has been established. Moreover, the influence of wall roughness, inlet velocity and roadway height on wind speed distribution have been studied under a rough roof. Corresponding results can be used for practical design and production in field practice.
2 Roadway roughness
2.1 Roughness
The problems caused by the rough surface have been considered by several scholars for a long time. For instance, SOMMERFELD et al [19] have utilized particle tracking testers to experimentally analyze the effect of different roughness walls on the impact process. GROOM et al [20] have photographed the field and laboratory gravel, and measured the roughness of riverbed patches with different sediment sizes and surface structures. LI et al [21] have utilized statistical analysis and numerical simulations to propose the use of relative undulations and elongation to reflect the joint roughness coefficient (JRC) of the structural surface. Moreover, they have simulated the undulation shape of the Barton standard roughness grade profile curve. WANG et al [22] have utilized four parameters, i.e., average inclination angle, average relative amplitude, standard deviation of inclination angle and standard deviation of amplitude, to establish a relationship between parameters and rock mass JRC. Moreover, they have used three-dimensional (3D) laser scanning to obtain on-site rock mass structural surfaces and verified the established relationship.
It should be noted that the given studies focused on statistical analysis of surface unevenness and defined it as surface roughness, which is mainly caused by different surface particles and rock joints effects. During the ventilation of mine tunnel, the cross-sectional shape largely fluctuates due to construction and environment, which mainly affects the wind speed distribution [23]. Therefore, wall roughness should be accurately defined to study roadway ventilation. Herein, we have considered the rock structure profiles [24-28] to define the wall roughness, which describes a distance that the actual roadway wall deviates from the standard wall due to the construction, environment, load and other factors.
As shown in Figure 1, the deviation can be divided into over-excavation (We) and under-excavation (Wu). The horizontal axis represents the roof of a standard three-element arch roadway, the upper part of the roof is positive (We>0) and the lower part is negative (Wu<0). If both parts are far from 0, the roadway roof renders higher fluctuations. Hence, the wall roughness (Ra) can be defined as:
 (1)
(1)
where We,max refers to the maximum over-excavation and Wu,max represents the maximum under-excavation.
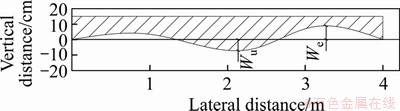
Figure 1 Schematic illustration of roadway wall roughness
2.2 Random generation of rough curves
The wall roughness should be determined quantitatively to facilitate the modeling research and obtain more general laws. In actual construction, the roadway roughness is controlled with some measures to ensure stability and avoid over- and under-excavations [29]. Therefore, the roughness of roadway roof is assumed to exhibit normal distribution, the standard roadway as an expectation and the certain undulation height as a standard deviation.
With reference to the relevant construction inspection standards for over- and under-excavations, We,max��(0.05 m, 0.10 m, 0.15 m), Wu,max��(-0.05 m, -0.10 m, -0.15m) and Ra=0.1, 0.2 and 0.3 m have been selected. Herein, Ra=0.2 m is taken as an example to demonstrate the generation of rough line by MATLAB, as given below:
Step 1): 100 points were generated in [0, 50] interval with a separation of 0.5 m and stored in row matrix A.
Step 2): A normal distribution B was established with 100 points, an expected value of 0, and a standard deviation of 0.1/3.
Step 3): A loop operation was designed to irreversible and randomly extract data points from B, which were stored in a row matrix C.
Step 4): A and C were used to generate random uneven curves.
The normal distribution and randomly generated wall irregularity curves are shown in Figure 2. Due to the randomness of the process, the obtained distribution function is not a standard normal distribution. According to the nature of normal distribution function, it is guaranteed that 99.73% of the data points are in the range of (-0.1, 0.1). Hence, the roadway roughness can meet the simulation requirements.
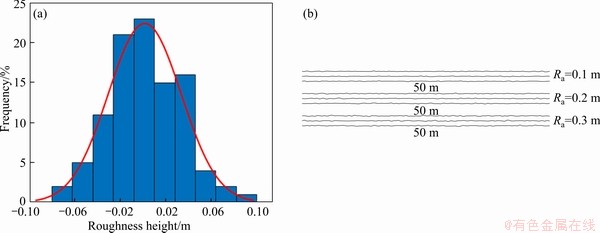
Figure 2 Normal distribution of curve (a) and generated random rough curve (b)
3 Numerical simulations
3.1 Roadway physical model
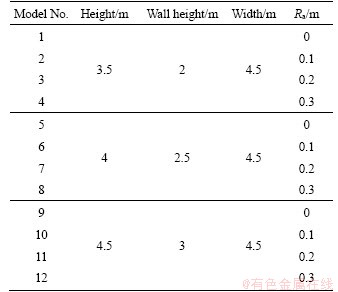
Based on a three-element arch roadway in a certain mine, a simple physical roadway model was established as shown in Figures 3 and 4. The roadway wall height (h), width (B) and length (L) were 2.5, 4.5 and 50 m, respectively. Moreover, 12 different roadway models were established to analyze the influence of various factors on the wind speed distribution of the rough roadway section, as shown in Table 1. Moreover, a 3D rectangular coordinate system of the roadway was established. The air inlet was along the positive direction of z-axis in the x-y plane, where the origin was located at the center of the roadway bottom.
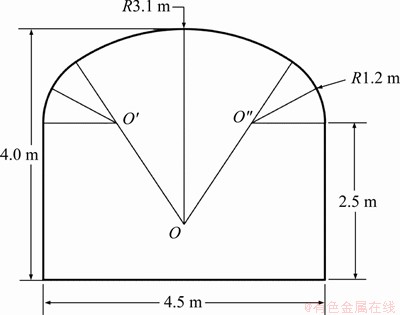
Figure 3 Cross-sectional dimensions of roadway
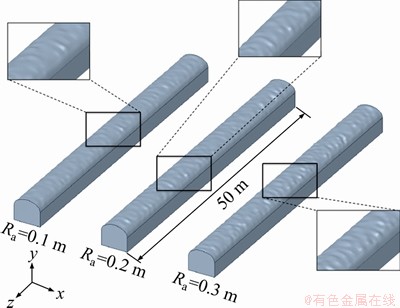
Figure 4 Solid roadway physical model
3.2 Basic assumptions and calculations
The numerical simulations are based on the following assumptions:
1) The air in the roadway is considered incompressible viscous turbulence, the air density is 1.2 kg/m3 and the influence of gravity is ignored.
Table 1 Different models of rough roadway
2) The surface roughness of the roadway is the same without any slip and heat exchange between the airflow and roadway wall. Moreover, different obstacles, such as staff and vehicles, have been ignored.
3) The wall surface is fixed with an inflow from the roadway entrance without any air leakage.
The continuity equation can be expressed as:
 (2)
(2)
where �� refers to the air density, and u, v and w represent the velocity in the x, y and z directions, respectively.
The N-S equation can be given as:

 (3a)
(3a)

 (3b)
(3b)

 (3c)
(3c)
where p refers to the relative pressure of the airflow, and �� corresponds to the dynamic viscosity coefficient of air.
A standard k-�� turbulence model was selected for calculations. The turbulent flow energy (k) and kinetic energy dissipation rate (��) are controlled by the following equations:
 (4)
(4)

 (5)
(5)
where P(u) can be given as:
 (6)
(6)
The eddy current viscosity coefficient can be expressed as:
 (7)
(7)
where ��k, ����, C1��, C2�� and C�� are empirical constants.
3.3 Grid independence study
The grid independence of simulations is studied to ensure calculation accuracy and minimal calculation time. A hexahedral mesh was used to calculate the model mesh. Figure 5 describes the central velocity at the outlets of models 5, 6, 7, and 8 for different numbers of grids.
The central outlet velocity is stabilized with the increase of grid number. Considering the accuracy and cost of calculations, 1.04, 1.69, 2.33 and 3.08 million grids have been used for simulation.
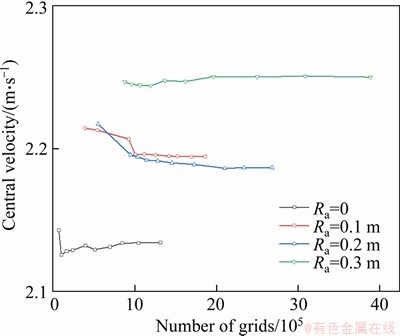
Figure 5 Central velocity of each roughness model under different numbers of grids
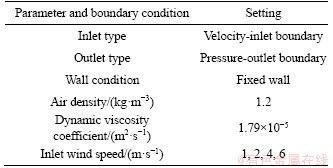
3.4 Numerical simulation parameters and boundary conditions
Based on the ��Safety regulations for metal and non-metal mines�� [30], the average wind speed in the stope should not exceed 4 m/s and the transportation roadways and inlets of the mining area should not exceed 6 m/s. Therefore, the simulated wind speed of the roadway entrance was set at 1, 2, 4 and 6 m/s. Table 2 lists the numerical simulation parameters and boundary conditions.
Table 2 Simulation parameters and boundary conditions
4 Results and discussion
This study mainly focused on the distribution of wind speed in the roadway cross-section with different roof roughness. To analyze the cross-sectional wind speed, three arc radius directions along the three-element arch section were selected, as shown in Figure 6. Herein, 200 points of wind speed data were collected along the three lines (a, b and c) and the average distance between points was about 1 cm.
4.1 Influence of wind speed
The roadway section, 30 m away from the air inlet, was selected to analyze the influence of different inlet wind speeds. Herein, 80% of the central wind speed is defined as the acceptable velocity (VA). Then, the distance between VA points and roof (DA) was obtained, as shown in Figure 7.
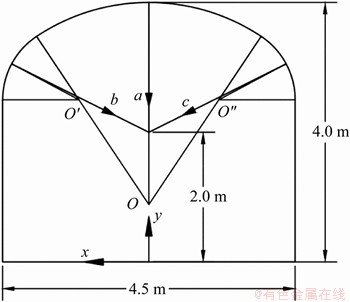
Figure 6 Cross-sectional wind speed analysis line
At Ra=0, Figure 7 shows that DA was about 0.19 m and remained with the increase of inlet wind speed. This observation is consistent with previously reported smooth wall simulation results [10]. At Ra=0.1 m, DA decreased from 0.3 to 0.2 m with the increase of wind speed from 1 to 6 m/s, respectively.
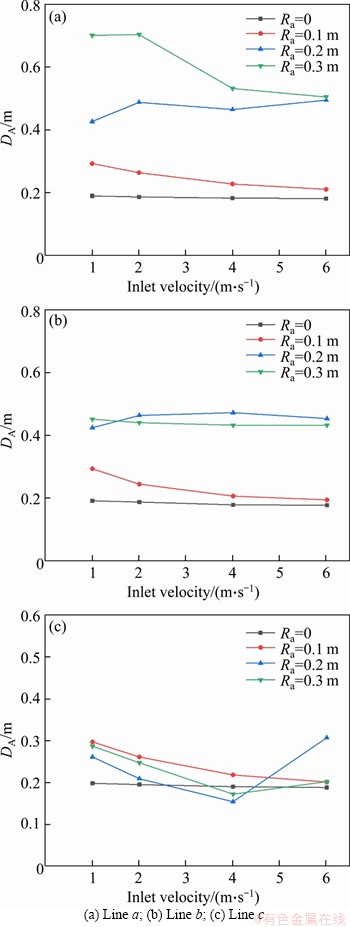
Figure 7 Obtained DA value along different lines (z=30 m):
When Ra increased to 0.2 and 0.3 m, DA also increased at the same inlet wind speed. One should note that the line a rendered maximum increase, whereas lines b and c exhibited a large difference. DA changed and started to fluctuate with the increase in wind speed. As line a is mainly affected by the three arcs roughness, DA significantly increased with the increase of Ra. On the other hand, lines b and c are mainly affected by the adjacent rough top wall and smooth sidewall, therefore, DA exhibited a smaller change with increasing Ra. The cross-sectional asymmetry is also one of the reasons for the difference in wind speed along lines b and c.
Moreover, the roadway shape became the influencing factor of wind speed distribution with increasing Ra. The influence of inlet wind speed is weakened.
4.2 Influence of roadway roughness
At the wind speed of 2 m/s, model Nos. 5, 6, 7 and 8 are selected to analyze the roughness effects of the roadway section, which is 30 m away from the air inlet. The wind speed distribution on the roadway section is shown in Figure 8. The distribution of wind speed along lines a, b and c is shown in Figure 9.
It can be seen from Figure 8(a) that the wind speed distribution on the roadway cross-section is uniform, annular and symmetrical. At Ra=0.1 m,Figure 8(b) shows that the wind speed at the center of the roadway cross-section increased, however, the overall distribution remained symmetrical and regular yet. Here, the roadway roughness influenced the degree of wind speed but not the overall distribution. At Ra=0.2 m, Figure 8(c) shows that the wind speed distribution at the top and side walls is no longer symmetrical, which can be ascribed to the fact that the roughness affects the wind speed distribution. At Ra=0.3 m, the wind speed distribution at roadway cross-section has been significantly changed, as shown in Figure 8(d). And a low-velocity area appeared along the roadway wall and the bottom wind speed was no longer distributed along the floor.
At z=30 m, the wind speed in roadway cross-section, with different roof roughness values, exhibited similar behavior along lines a, b and c (Figure 9). In general, the distance from the steady-velocity point to the roof (Dw) increased with increasing Ra. For instance, Dw increased from 0.5 to 0.7 m when Ra increased from 0 to 0.1 m,respectively. At Ra=0.2 m, the wind speed gradually increased along lines a and b, indicating the appearance of a low-speed region with a certain thickness near the top wall. However, the wind speed rapidly reached the steady-state value along line c with Dw of 0.7 m. The wind speed exhibited an asymmetric distribution in the roadway. At Ra=0.3 m, the maximum Dw (1.3 m) is found along line a, whereas the value of Dw along lines b and c was found to be 1.1 m. It can be concluded that the roof roughness significantly influenced wind speed distribution.
Furthermore, models 5, 6, 7 and 8 are used to analyze the wind speed deviation in the cross-section, and Figure 10(a) presents 10 deviation analysis lines at z=10, 20, 30, 40 and 50 m. Herein, 10 points, with equal intervals, were selected on each line to obtain a dataset of 100 points, as shown in Table 3. The average wind speed deviation (��A) of models 6, 7 and 8 was analyzed by taking the wind speed at a selected point of model 5 as the ideal value, and assuming average error=0 at z=0 (Figure 10(b)).
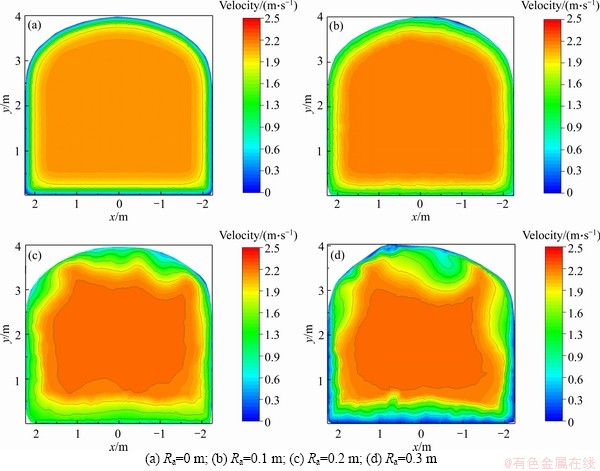
Figure 8 Wind speed distribution at roadway cross-section (z=30 m):
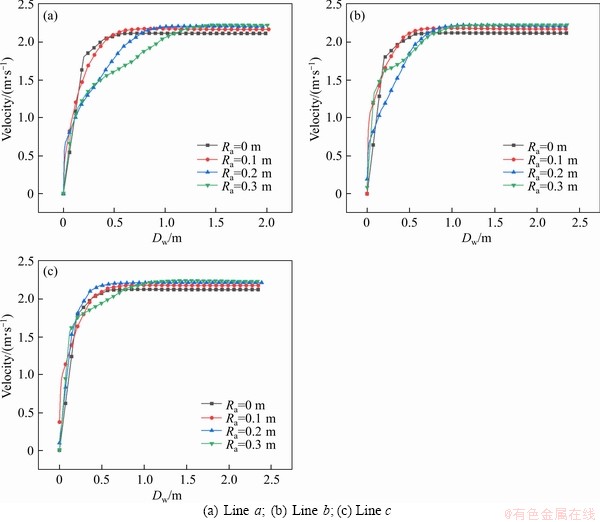
Figure 9 Wind speed distribution at roadway cross-section (z=30 m):
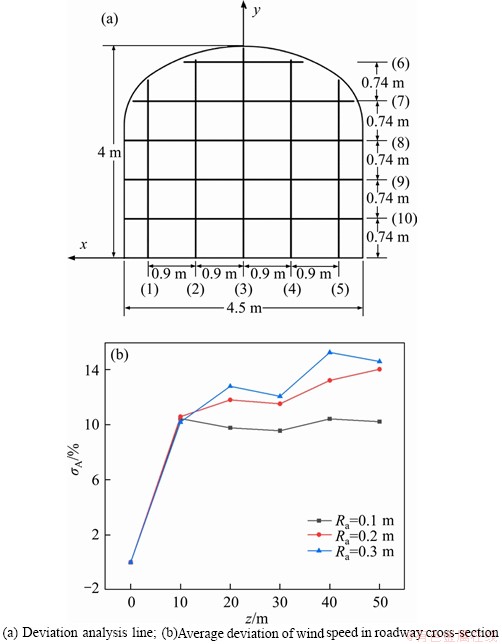
Figure 10 Analysis of wind speed deviation of sections with different roughness:
The average section deviation (��A) can be given as:
 (8)
(8)
where pi refers to the wind speed at the ith point on the jth line of models 6, 7 and 8, and qi refers to the wind speed at the ith point on the jth line of model 5 (i, j=1, 2, 3, 4 ...10).
Figure 10(b) shows that the wind speed distribution of the roadway cross-section, with different roof roughness, exhibits deviation from the smooth roadway (Ra=0 m). Also, the deviation value fluctuated along the flow directions. At Ra=0.1 m, ��A fluctuated about 10%. The deviation fluctuated increasing with increasing Ra value to 0.2 m and 0.3 m. And the maximum fluctuation was observed at Ra=0.3 m. Hence, the deviation correction equation for wind speed measurement of a single cross-section does not apply to other sections and entire roadway.
4.3 Influence of roadway height
Herein, the wind speed distribution of the rough roadway cross-section with different height is studied by using models 3, 7 and 11. The simulated inlet velocity was set at 2 m/s and the roadway cross-section was selected 30 m away from the inlet. The contours of wind speed are shown in Figure 11. The wind speed distribution on the longitudinal symmetry axis (x=0) of the three models on different sections, i.e., 10, 30 and 50 m, from the inlet is shown in Figure 12.
Figure 11 shows that the high-speed area (v��2.2 m/s) decreased with the increase of roadway height, which can be ascribed to the overall increase in the total area of the cross-section without changing the roughness. As the influence of roughness is weakened, the high speed area decreased in the center of roadway. Also, the low-speed area (v��1 m/s) shifted from the roof sides to the center with increasing roadway height. In addition, the contour of wind speed near the roof gradually changed from steep to relatively gentle and wind speed distribution gradually attained a rectangular shape.
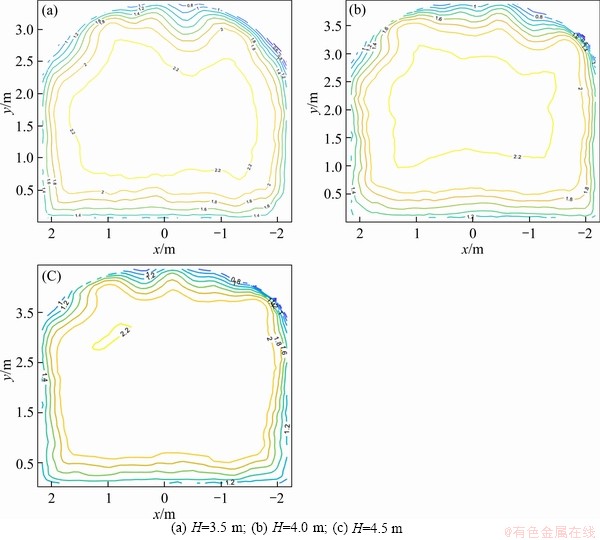
Figure 11 Contour maps of wind speed distribution in roadway cross-section at z=30 m (Ra=0.2):
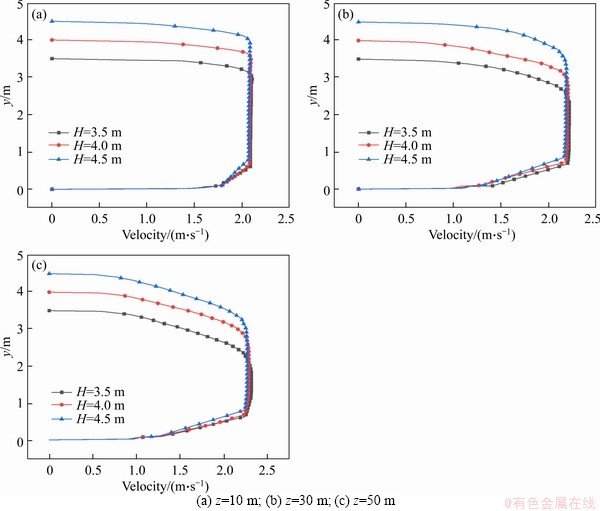
Figure 12 Wind speed distribution at different distances from inlet:
Figure 12 presents the influence of roadway height on wind speed distribution of different section. The roof roughness mainly affected the upper side of the roadway and central wind speed gradually increased with increasing z value. At z=10 m and 30 m, the low-speed area near the roof decreased with increasing the overall roadway height. This phenomenon was more obvious at z=50 m, and the central velocity in the roadway decreased.
5 Conclusions
In this work, the influence of inlet velocity, roof roughness and roadway height on wind speed distribution of the rough roadway have been studied. The main conclusions can be drawn as follows.
1) At Ra=0.1 m, DA decreases with the increase of inlet velocity. Hence, the effect of roughness can be reduced by increasing the inlet wind speed. However, at Ra=0.2 m and 0.3 m, DA changes irregularly and fluctuations start to appear with increasing inlet velocity. Hence, the optimal results cannot be achieved by only increasing the wind speed.
2)The roof roughness renders more prominent impact on wind speed distribution. At Ra=0.2 m, the wind speed distribution exhibited a certain thickness of wind speed layer near the roof. Moreover, the wind speed distribution changes from annular symmetry to asymmetric distribution with increasing roughness. In actual production, it is suggested to improve the roadway ventilation quality by reducing Ra (<0.1 m). The lower roughness can also reduce the fluctuations in wind speed measurement error in different sections and improve the applicability of wind speed error correction formula.
3) The effect of roof roughness can be reduced by increasing the roadway height. The low-speed area (v��1 m/s) of the roadway cross-section shifts from the roof to the center and wind speed distribution attains a rectangular shape with increasing roadway height.
Contributors
HU Jian-hua provided the concept and edited the draft of manuscript. ZHAO Yang conducted the simulation and wrote the first draft of the manuscript. ZHOU Tan and MA Shao-wei instructed the numerical models and edited the draft of manuscript. WANG Xue-liang and ZHAO Lei provided suggestions of the roadway model.
Conflict of interest
HU Jian-hua, ZHAO Yang, ZHOU Tan, MA Shao-wei, WANG Xue-liang and ZHAO Lei declare that they have no conflict of interest.
References
[1] CHENG Jian-wei, WU Yan, XU Hai-ming, LIU Jin, YANG Ye-kang, DENG Huang-jung, WANG Yi. Comprehensive and integrated mine ventilation consultation model�CCIMVCM [J]. Tunnelling and Underground Space Technology, 2015, 45: 49-54. DOI: 10.1016/j.tust.2014.09.004.
[2] NIE Xing-xin, WEI Xiao-bin, LI Xiao-chen, LU Cai-wu. Heat treatment and ventilation optimization in a deep mine [J]. Advances in Civil Engineering, 2018, 2018: 1-12. DOI: 10.1155/2018/1529490.
[3] HAMM V, SABET B B. Modelling of fluid flow and heat transfer to assess the geothermal potential of a flooded coal mine in Lorraine, France [J]. Geothermics, 2010, 39: 177-186. DOI: 10.1016/j.geothermics.2010.03.004.
[4] KOZYREV S A, OSINTSEVA A V. Optimizing arrangement of air distribution controllers in mine ventilation system [J]. Journal of Mining Science, 2013, 48: 896-903. DOI: 10.1134/S1062739148050140.
[5] TORANO J, TORNO S, MENENDEZ M, GENT M, VELASCO J. Models of methane behavior in auxiliary ventilation of underground coal mining [J]. International Journal of Coal Geology, 2009, 80: 35-43. DOI: 10.1016/ j.coal.2009.07.008.
[6] PLESSIS G E, LIEBENBERG L, MATHES E H. The use of variable speed drives for cost-effective energy savings in south African mine cooling systems [J]. Applid Energy, 2013, 111: 16-27. DOI: 10.1016/j.apenergy.2013.04.061.
[7] LIU Q, NIE W, HUA Y, PENG H T, LIU C Q, WEI C H. Research on tunnel ventilation systems: Dust diffusion and pollution behaviour by air curtains based on CFD technology and field measurement [J]. Building and Environment, 2019, 147: 444-460. DOI: 10.1016/j.buildenv.2018.08.061.
[8] RANJAN A, SAHU H B, MISRA P. MineSense: Sensing the radio signal behavior in metal and non-metal underground mines [J]. Wireless Networks, 2019, 25: 3643-3655. DOI: 10.1007/s11276-019-01959-y.
[9] LI Man, HE Man. Simulation study on mine ventilation air quantity measurement and error compensation [J]. China Safety Science Journal, 2018, 28(5): 153-158. DOI: 10.16265/j.cnki.issn1003-3033.2018.05.026. (in Chinese)
[10] DING Cui. Numerical and experimental research on distribution characteristics of average wind speed in trapezoid roadway [J]. Journal of Science and Technology, 2016, 12(1): 28-32. DOI: 10.11731/j.issn.1673-193x.2016.01.005. (in Chinese)
[11] LIU Jian, SONG Ying, LI Xue-bing, BAI Chun-guo. DENG Li-jun, WU Gang. Experimental study on wind speed distribution of the straight roadway and sudden enlarged sections based on LDA [J]. Journal of China Coal Society, 2016, 41(4): 892-898. DOI: 10.13225/j.cnki.jccs.2015.0923. (in Chinese)
[12] LUO Yong-hao, ZHAO Yang-sheng, WANG Yi, CHI Ming-bo, TANG Hai-bo, WANG Shao-qing. Distributions of airflow in four rectangular section roadways with different supporting methods in underground coal mines [J]. Tunnelling and Underground Space Technology, 2015, 46: 85-93. DOI: 10.1016/j.tust.2014.11.005.
[13] ZOU Jiang, PENG Xiao-feng, YAN Wei-mou. Effects of roughness on fluid flow behavior in ducts [J]. Journal of Chemical Industry and Engineering (China), 2008, 59: 25-31. DOI: 10.3321/j.issn:0438-1157.2008.01.005. (in Chinese)
[14] ZHANG Heng, LIN Fang, SUN Jian-chun, ZHOU Ze-lin. CFD analysis of tunnel construction ventilation effect based on typical wall roughness model [J]. China Railway Science, 2016, 37(5): 58-65. DOI: 10.3969/j.issn.1001-4632.2016. 05.08. (in Chinese)
[15] MILICI B. Modification of particle laden near-wall turbulence in a vertical channel bounded by rough walls [J]. International Journal of Multiphase Flow, 2018, 103: 151-168. DOI: 10.1016/j.ijmultiphaseflow.2018.02.020.
[16] CHENG Zhong-fu, ZHU Miao-yong. Analyzing the effect of wall roughness on gas�Cparticle flow in confined channels based on a virtual-wall-group concept [J]. International Journal of Multiphase Flow, 2015, 77: 158-170. DOI: 10.1016/j.ijmultiphaseflow.2015.08.013.
[17] KENT C W, GRIMMOND S, GATEY D, HIRANO K. Urban morphology parameters from global digital elevation models: Implications for aerodynamic roughness and for wind-speed estimation [J]. Remote Sensing of Environment, 2019, 221: 316-339. DOI: 10.1016/j.rse.2018.09.024.
[18] EDWARD N G, YUAN Chao, CHEN Liang, REN Chao, FUNG J C H. Improving the wind environment in high-density cities by understanding urban morphology and surface roughness: A study in Hong Kong [J]. Landscape and Urban Planning, 2011, 101: 59-74. DOI: 10.1016/j.landurbplan. 2011.01.004.
[19] SOMMERFELD M, HUBER N. Experimental analysis and modelling of particle-wall collisions [J]. International Journal of Multiphase Flow, 1999, 25: 1457-1489. DOI: 10.1016/S0301-9322(99)00047-6.
[20] GROOM J, BERTIN S, FRIEDRICH H. Evaluation of DEM size and grid spacing for fluvial patch-scale roughness parameterization [J]. Geomorphology, 2018, 320: 98-110. DOI: 10.1016/j.geomorph.2018.08.017.
[21] LI Hua, HUANG Run-qiu. Method of quantitative determination of joint roughness coefficient [J]. Chinese Journal of Rock Mechanics and Engineering, 2014, 33(s2): 3489-3497. DOI: 10.13722/j.cnki.jrme.2014.s2.012. (in Chinese)
[22] WANG Chang-shuo, WANG Liang-qing, GE Yun-feng, LIANG Ye, SUN Zi-hao, DONG Man-man, ZHANG Nan. A nonlinear method for determining two-dimensional joint roughness coefficient based on statistical parameters [J]. Rock and Soil Mechanics, 2017, 38(2): 565-573. DOI: 10.16285/j.rsm.2017.02.033. (in Chinese)
[23] BASCOMPTA M, SANMIQUEL L, ZHANG H. Airflow stability and diagonal mine ventilation system optimization: A case study [J]. Journal of Mining Science, 2018, 54: 813-820. DOI: 10.1134/S1062739118054927.
[24] WANG Da-wei, WANG Chong-hui, STEINAUER B, TAN Yi-qiu, OESER M. Overview on evaluation methods of pavement evenness for pavements without speed limitations in germany [J]. China Journal of Highway and Transport, 2019, 32(4): 105-129. DOI: 10.19721/j.cnki.1001-7372.2019. 04.007. (in Chinese)
[25] BARTON N. Review of a new shear-strength criterion for rock joints [J]. Engineering Geology, 1973, 7: 287-332. DOI: 10.1016/0013-7952(73)90013-6.
[26] LI Ying-chun, SUN Sheng-yue, TANG Chun-an. Analytical prediction of the shear behaviour of rock joints with quantified waviness and unevenness through wavelet analysis [J]. Rock Mechanics and Rock Engineering, 2019, 52: 3645-3657. DOI: 10.1007/s00603-019-01817-5.
[27] LI Ying-chun, WU Wei, TANG Chun-an, LIU Bo. Predicting the shear characteristics of rock joints with asperity degradation and debris backfilling under cyclic loading conditions [J]. International Journal of Rock Mechanics and Mining Sciences, 2019, 120: 108-118. DOI: 10.1016/ j.ijrmms.2019.06.001.
[28] LEE H S, PARK Y J, CHO T F, YOU K H. Influence of asperity degradation on the mechanical behavior of rough rock joints under cyclic shear loading [J]. International Journal of Rock Mechanics and Mining Sciences, 2001, 38: 967-980. DOI: 10.1016/S1365-1609(01)00060-0.
[29] YANG Xiao-jie, HU Chao-wen, HE Man-chao, WANG Hao-hao, ZHOU Yu-bo, LIU Xiao-yu, ZHEN En-ze, MA Xing-en. Study on presplitting blasting the roof strata of adjacent roadway to control roadway deformation [J]. Shock and Vibration, 2019, 2019: 1-16. DOI: 10.1155/2019/3174898.
[30] State Administration for Market Regulation, Standardization Administration. Safety regulations for metal and non-metal mines [EB/OL]. [2021-09-01]. http://openstd.samr.gov.cn/ bzgk/gb/newGbInfohcno=4BDAE60EAA106D3B78844741DAF3EBD8.
(Edited by FANG Jing-hua)
���ĵ���
���岻ƽ�����������ٷֲ��Ķ�����Ӱ��
ժҪ������ֲڶȶ������ͨ�缰������ٷֲ������ش�Ӱ�졣���Ĵ������϶���������еı���ֲڶ�(Ra)�������ڶ���ֲڶȵ���̬�ֲ��������˲�ͬ����µ����Ĺ����ģ�ͣ�����Fluent����ϵͳ���о��˽��ڷ��١�����ֲڶȺ�����߶ȶԷ��ٷֲ���Ӱ�졣ģ������������Ra=0.1 mʱ��������ӱ��浽���ķ��ٴﵽ80%�ĵ�ľ���(DA)����أ��ҷ��ٷֲ��ܵ�����ֲڶ������Ӱ�����ԣ������ٷֲ���Ra=0.2��0.3 mʱ��ò��Գơ����⣬��������߶ȵ����ӣ���������(v��1 m/s)��ʼ�����ڶ��帽����������ԣ�RaֵС��0.1 m���Լ��ٶ���ֲڶȶ����������ٷֲ���Ӱ�죬������ʵ��Ӧ����ʹ�á�
�ؼ��ʣ��ֲڶ�ģ�ͣ�������棻�����ֲ�����ֵģ�⣻��ɽͨ��
Foundation item: Project(2017YFC0602901) supported by the National Key Research and Development Program of China; Project(2019zzts988) supported by the Postgraduate Independent Exploration and Innovative Project of Central South University, China
Received date: 2020-05-06; Accepted date: 2020-12-16
Corresponding author: ZHOU Tan, PhD Candidate; Tel: +86-13278885686; E-mail: zt3153@csu.edu.cn; ORCID: https://orcid.org/0000-0002-0792-1676
Abstract: The wall surface roughness renders a significant impact on ventilation of roadways and cross-sectional wind speed distribution. Herein, the wall roughness (Ra) in the roadway has been defined theoretically. Moreover, three-center arched roadway models for different situations are established based on the normal distribution of roof roughness. The influence of inlet velocity, roof roughness and roadway height on wind speed distribution is systematically studied by using Fluent software. At Ra=0.1 m, the simulation results reveal that the wind speed is negatively related to the distance from the wall to the point where 80% of the central wind speed is reached (DA). Also, the wind speed distribution is significantly influenced by increasing the roof roughness. However, the wind speed distribution becomes asymmetric at Ra=0.2 m and 0.3 m. Furthermore, the low-speed area (v��1 m/s) started to concentrate on the roof with the increase of roadway height. Overall, an Ra value of <0.1 m can reduce the influence of wall roughness on wind speed distribution of the roadway, which is suggested in practical applications.
