

Numerical simulation of thermal behavior during laser metal deposition shaping
LONG Ri-sheng(������)1, 2, LIU Wei-jun(���)1, XING Fei(�� ��)1, 2, WANG Hua-bing(������)1, 2
1. Advanced Manufacturing Laboratory, Shenyang Institute of Automation, Chinese Academy of Sciences, Shenyang 110016, China;
2. Graduate School, Chinese Academy of Sciences, Beijing 100039, China
Received 11 June 2007; accepted 23 August 2007
Abstract:
Based on the element life and death theory of finite element analysis(FEA), a three-dimensional multi-track and multi-layer model for laser metal deposition shaping(LMDS) was developed with ANSYS parametric design language(APDL), and detailed numerical simulations of temperature and thermal stress were conducted. Among those simulations, long-edge parallel reciprocating scanning method was introduced. The distribution regularities of temperature, temperature gradient, Von Mise��s effective stress, X-directional, Y-directional and Z-directional thermal stresses were studied. LMDS experiments were carried out with nickel-based superalloy using the same process parameters as those in simulation. The measured temperatures of molten pool are in accordance with the simulated results. The crack engendering and developing regularities of samples show good agreement with the simulation results.
Key words:
laser metal deposition shaping; thermal behavior; numerical simulation;
1 Introduction
Laser metal deposition shaping has engendered increasing interest and shown extensive and promising application in many fields, such as aerospace, planes and weapons[1]. Compared with those traditional subtractive manufacturing methods, laser metal deposition shaping (LMDS) processing is an additive, layered manufac- turing and prototyping technology, and it is similar to the laser engineered net-shaping (LENS?) process[2-4]. LMDS incorporates the features of stereo-lithography and laser cladding, and provides the ability to fabricate complex metal components directly from CAD files without intermediate steps or the usage of forming dies, tooling or machining. With its one step manufacturing ability, LMDS can greatly reduce the lead-time and investment cost. Moreover, the as-deposited parts are fully dense, hold rapid solidified microstructure, and can meet the requirements for direct usage.
Due to its highly localized laser heating feature and fast heating and cooling effects, LMDS can offer the extreme conditions that conventional methods cannot provide. In the meantime, high temperature gradients are also produced during the processing. Large temperature gradients not only lead to the directional selection of microstructure in the specimens fabricated by LMDS, but also result in large thermal stresses in specimens. When the thermal stresses exceed the ultimate strength of materials, fractures will take place. So, it is very significant to investigate the regularities of thermal behavior during LMDS.
Over the past ten years, great efforts have been made to investigate the characters of LMDS process [1-8]. Contact sensor measurements and non-contact measurements are used to evaluate temperature, residual stress and features of molten pool. In terms of the contact sensor measurements, thermocouples are usually used to measure the temperature of specified spots, and strain foils are usually used to measure the stress of specified spots[9]. For the non-contact measurements, high-speed images colorimetric method and infrared thermography are often used to obtain the molten pool size as well as the temperature surrounding the molten pool[6,10-12]. However, owing to the complexity of physical processes involved in LMDS, all the above works are mainly focused on the molten pool and its immediate area. The temperature and thermal stress distributions outside of the molten pool are very difficult to be captured experimentally. Thus, computational simulation plays an indispensable role in the analysis of such process. Especially, with the recent advancements in finite element theories and computational power, FEA simulation of complicated transient thermal behavior during LMDS processing has gradually become feasible. Recently, three-dimensional laser forming simulations have been conducted using commercial FEA software or manual programming. YE et al[5] developed a numerical fixed boundary model to investigate the entire thermal behavior during the LENS? process. In the work, a thin-wall part was deposited on a substrate, and the temperatures of those nodes in molten pool were set as the melting point at each incremental step. LABUDOVIC et al[12] coupled on-line high-shutter speed imaging with microstructure analysis, X-ray analysis and numerical modeling to understand the thermal behavior of direct laser metal powder deposition. Both analytical and numerical models were developed to calculate the transient temperature profiles, dimension of the fusion zone, etc., of thin-wall parts. XI et al[13] numerically simulated the transient temperature field in the real process of the metal thin-wall part fabricated by laser direct deposition. Soon afterwards, XI and YU[14] established a numerical model based on ANSYS software to calculate the 3D transient temperature field of the continuous moving laser molten pool.
However, all those simulations were based on simplified model by assuming that the laser was an even heat source. Some of them even set the temperatures of those nodes in molten pool as fixed values. Meanwhile, most of those models were thin-wall and could not show the actual characteristics of the thermal behavior during fabrication processing. To further reveal the thermal behavior during LMDS processing, according to the ��element birth and death��[15] technique, a three- dimensional multi-track and multi-layer finite element model was developed with APDL. The distribution regularities of temperature, temperature gradient, Von Mise��s effective stress, X-directional, Y-directional and Z-directional thermal stresses were researched in details. Under the same conditions as those in simulation, LMDS experiments were conducted.
2 Computational formulation and geometry configuration
2.1 Element birth and death technique
��Element birth and death�� technique is usually used to simulate welding and cutting. It does not actually remove ��killed�� elements from model. Instead, it deactivates them by multiplying their stiffness or conductivity by a severe reduction factor. This factor is set to 1.0��10-6 by default, and it can be set to other values. Element loads associated with deactivated elements are zero out of the load vector, but they still appear in element-load lists. The mass, damping and specific heat of deactivated elements are all set to zero likewise.
Similarly, when elements are ��born��, they are not actually added to the model but simply reactivated. So, we must create all elements in preprocessor, including those to be born in later stages of the analysis. When an element is reactivated, its stiffness, mass and element loads, etc., return to their full original values, but there is no record of strain history (or heat storage, etc.) for it.
2.2 Geometry configure
To reflect the characteristics of LMDS processing accurately, some assumptions have been made from the above analyses and are listed as follows.
1) The X-directional, Y-directional and Z-directional displacement of the two Y-directional end faces of substrate are all restricted to zero.
2) For the thermo-physical properties of powdered material like Ni60A under different temperatures are very difficult to obtain. In this work, all thermo-physical properties of deposition material and substrate material are considered to be temperature-independent.
3) Only heat conduction in specimen and substrate is considered during LMDS processing. The interface thermal conduction between deposition material and substrate is considered by setting equivalent thermal conductivity.
4) The heat flux to system is put in by a highly focused area on the molten pool and it is assumed that the heat flux, q(r), follows Gauss distribution in the radial direction, and has the following form:
![]() (1)
(1)
where R is the laser spot radius; Q is the total input laser energy.
But in practical loading process, Eqn.(1) is very difficult to be applied. The mean thermal flux density, q(r)m, is often used as the load within the area of the laser beam:
![]() (2)
(2)
5) Phase change phenomena, including meltdown and solidification, exist during LMDS processing. For the crystal materials like metal, the latent heat of phase change can��t be neglected. Phase change problems are usually solved by finite difference or finite element theory, and the most commonly used method is the enthalpy method by an artificial increase in the liquid specific heat. The relationship of the enthalpy(H), density(��) and specific heat(c) is
![]() (3)
(3)
According to the former theories and the ��element birth and death�� analysis technique, the three-dimensional multi-track and multi-layer FEM model is developed by APDL. In the model, long-edge reciprocating scanning method is introduced to the model.
Fig.1 shows the FEM model of LMDS. The dimensions of sample and substrate are demonstrated in the figure. To reduce computational time and maintain reasonable accuracy, a fine map mesh was used in specimen, while a coarse tetrahedron mesh was adopted in substrate. The specimen is divided into four tracks and five layers. The height of each layer and the width of each track are equal to the diameter of laser spot (1 mm).
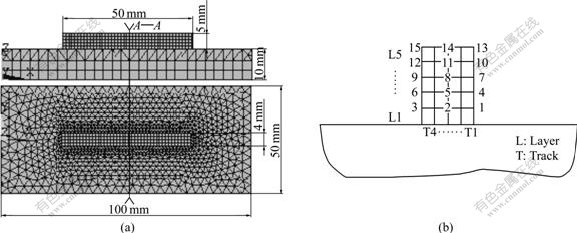
Fig.1 Simulation model of LMDS: (a) Front and planform views of FEM model; (b) Locations of nodes on longitudinal section A��A
Fig.2 shows the schematic diagram of long edge parallel reciprocating scanning method. As demonstrated in this figure, after one layer in XY plane is finished, the laser firstly moves from the end of current layer to the start, and then lifts a little distance equal to the height of single layer along Z direction. That is, a new layer is to be fabricated.
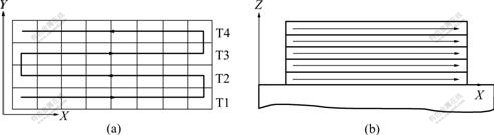
Fig.2 Schematic diagram of long edge parallel reciprocating scanning method in simulation: (a) XY plane; (b) XZ plane
3 Results and analysis
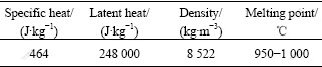
In simulation, laser power is 800 W; laser spot diameter is 1 mm; scanning velocity is 5 mm/s; and room temperature is 20 ��. The metal powder used in simulation is Ni60A, whose chemical compositions are listed in Table 1, and its partial thermo-physical properties are listed in Table 2. The material of substrate is 45# steel whose material properties are taken from Ref.[16]. The entire simulation lasts 200 s.
Table 1 Chemical composition of powder Ni60A (mass fraction, %)
![]()
Table 2 Partial thermo-physical parameters of Ni60A
3.1 Analysis of temperature and temperature gradient
Fig.3 displays the temperature variations of different nodes on the longitudinal section A��A. As shown in Fig.3(a), the temperature��time curves of nodes 1, 2 and 3 are compared. The temperature of node 1 is 20 �� before the 5th second, just the room temperature we set, and it rises to 638 �� quickly at the 5th second. This is because node 1 is under ��death�� condition before the 5th second, and there is no temperature variation record for it. But at the 5th second, laser beam just moves to the upside of the element to which node 1 belongs, and at the same time, node 1 is reactivated. Once node 1 is reactivated, its temperature rises quickly. In the same way, node 2 is under ��death�� condition and its temperature is 20 �� before the 15th second. At the 15th second, laser beam just moves to the upside of the element to which node 2 belongs. Node 2 is reactivated, and its temperature rises from room temperature to 1 168 �� quickly. Meanwhile, for the short distance between node 1 and node 2, the temperature of node1 is affected by conduct heat synchronously. The temperature variation of node 3 is similar to the variations of nodes 1 and 2. In the following simulation, nodes 1, 2 and 3 are rapidly heated up and cooled down again and again. This is because when the follow-up layer shaping moves to the upside of nodes 1, 2 and 3, they will be heated by the energy conducted from molten pool and neighboring areas above them, but their temperature variations become smaller and smaller with the increment of layers. By comparing the temperature variations of the other nodes as shown in Figs.3(b), (c) and (d), it can be found that their temperature variation regularities are similar to those of nodes 1, 2 and 3, except for the reactivated time.
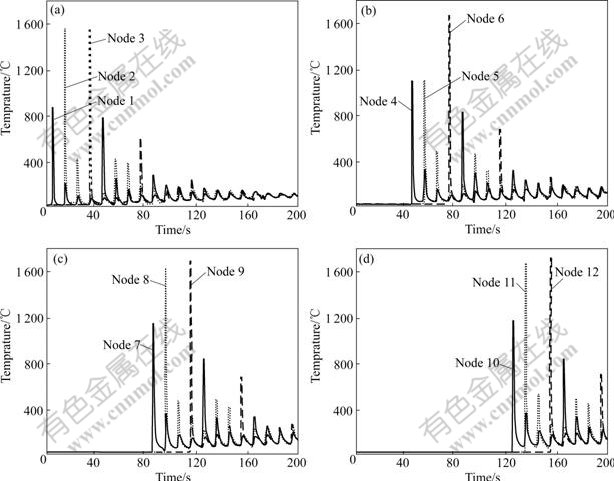
Fig.3 Temperature variations of different nodes on longitudinal section A��A
Fig.4 shows the temperature gradient vector diagrams of different time. From the figure, several features can be gained and listed as follows: 1) The distribution of temperature gradient in specimen is non-uniform. It is strong and concentrated in the district, which is subjected to the laser energy influence; while it is small and dispersive in the district which is far away from the laser energy influence. The temperature gradients in molten pool and its nearby district are quite large; 2) The temperature gradient in specimen is mainly along the Z direction, the perpendicular way of substrate, and it is small along other directions; 3) The distribution of temperature gradient on substrate is non-uniform. It is strong and concentrated in the district near the specimen; while it is small and dispersive in the district far away from the specimen; 4) The temperature gradient in substrate is mainly along the direction parallel to the substrate plane.
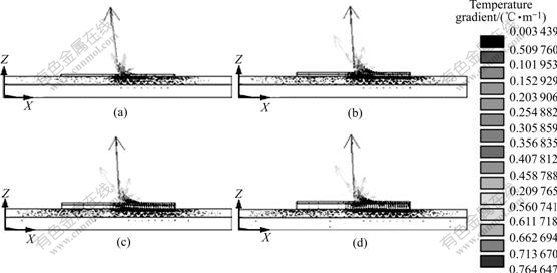
Fig.4 Temperature gradient vector diagrams of different time during LMDS processing: (a) 15th second; (b) 55th second; (c) 95th second; (d) 135th second
3.2 Analysis of thermal stress
In LMDS, the plastic deformation of material is assumed to obey the Von Mise��s yield criterion and the associated flow rule. The equation of Von Mise��s effective stress can be simplified and expressed as[16]
 (4)
(4)
where �͡� is the effective Poisson ratio.
Fig.5 displays the Von Mise��s effective stress variation curves of different nodes. As shown in Fig.5(a), the Von Mise��s effective stress value of node 1 equals 0 before the 5th second and it rises quickly after the 5th second. The reason is that node 1 is under ��death�� condition and doesn��t take effect before the 5th second, so, there is no strain or stress record for it. But at the 5th second, the laser beam just moves to the upside of the element to which node 1 belongs, so node 1 is reactivated and its stress rises quickly at the same time. Similarly, node 2 and node 3 are under ��death�� condition and their Von Mise��s effective stresses equal 0 before the 15th second and the 35th second, respectively. After they are reactivated, their Von Mise��s effective stresses rise quickly. By comparing the curves in Figs.5(b), (c) and (d), it is revealed that the Von Mise��s effective stress variation regularities of these nodes are similar to those of nodes 1, 2 and 3, except for the reactivated time.
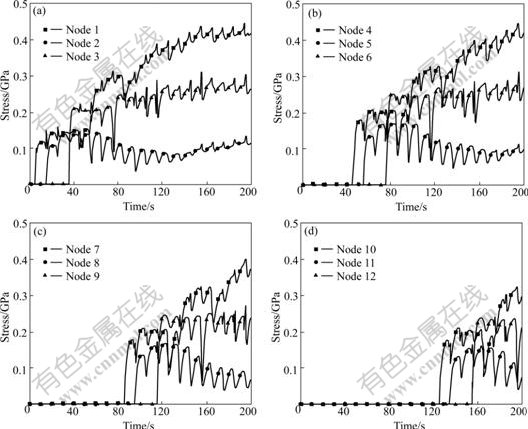
Fig.5 Von Mise��s effective stress variation curves of different nodes on longitudinal section A��A
In order to further reveal the distribution regularities of thermal stress in X, Y and Z direction, the following analyses are conducted.
The X-directional thermal stress variation curves of different nodes are displayed in Fig.6. As displayed in Fig.6(a), the X-directional thermal stress of node 1 is compressive stress firstly and it turns into tensile stress gradually; the X-directional thermal stress of node 2 is compressive stress in most of time; the X-directional thermal stress of node 3 is compressive stress all the time. Among nodes 1, 2 and 3, the X-directional thermal stress of node 1 is the lowest, while the X-directional thermal stress of node 3 is the highest, which reaches 0.242 GPa. By comparing with the curves in Figs.6(b), (c) and (d), it can be found that although those nodes are reactivated later than nodes 1, 2 and 3, their X-directional thermal stress variation regularities are similar to those of nodes 1, 2 and 3.
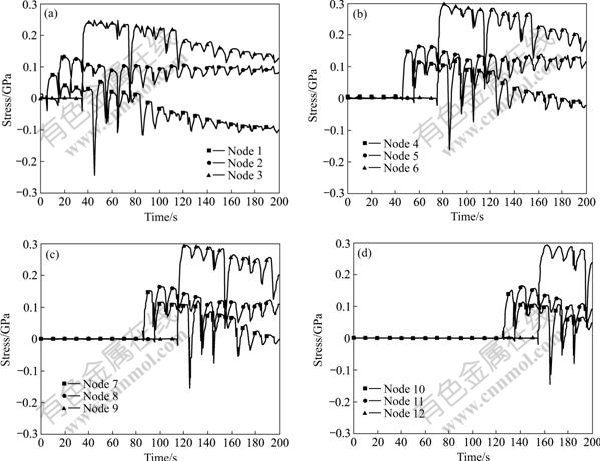
Fig.6 X-directional thermal stress variation curves of different nodes on longitudinal section A��A
The Y-directional thermal stress variation curves of those nodes in different layers are displayed in Fig.7. As shown in Fig.7, the Y-directional thermal stresses of nodes 1 and node 3 are almost compressive stresses and they are tensile stresses only occasionally; the Y-directional thermal stress of node 2 is compressive stress firstly and soon becomes tensile stress, but it turns into compressive stress finally with the proceeding of simulation. The Y-directional thermal stress variation regularities of the other nodes are similar to those of nodes 1, 2 and 3, except for the reactivated time. Simultaneously, it can be found that the Y-directional thermal stresses of these nodes are much less than their X-directional thermal stresses and the highest value of them is not more than 150 MPa.
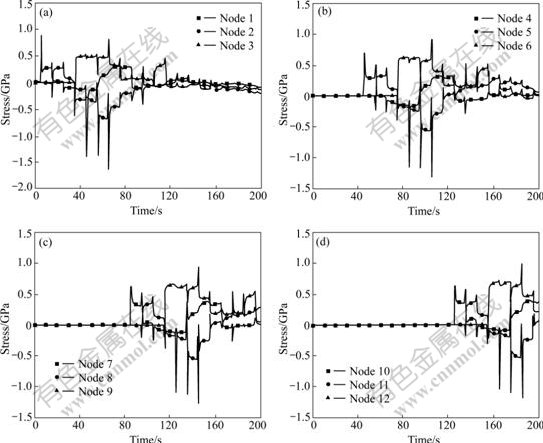
Fig.7 Y-directional thermal stress variation curves of different nodes on longitudinal section A��A
Fig.8 displays the Z-directional thermal stress variations of those nodes in different layers. As shown in Fig.8(a), the Z-directional thermal stress of node 1 is tensile stress, and its value is the largest among the three nodes. The Z-directional thermal stress of node 2 is compressive stress, and its value is the smallest. The Z-directional thermal stress of node 3 is compressive stress firstly but turns into tensile stress finally. This phenomenon can be explained through their different heating and cooling processes. As seen from Fig.1(b), Fig.2, Fig.3 and Fig.4, node 1 locates in the first track of the first layer, while node 3 locates in the last track of the same layer. The iterative heating and cooling processes that node 1 has experienced are much earlier than those node 3 has experienced. Because of the strong cooling effect of substrate, the long heating and cooling processes of node 1 produce high Z-directional temperature gradient, which causes the non-uniform thermal expansion and contraction of material along Z direction, and thus results in high Z-directional thermal stress. The preheating effect of fabricated tracks lowers the Z-directional temperature gradient of node 3, so its Z-directional thermal stress is less than that of node 1. As for node 2 that locates in the inner of specimen, owing to the heating effect of neighbor area, its Z-directional temperature gradient is far smaller than node 1 and node 3, so its Z-directional thermal stress is also far smaller than node 1 and node 3. The Z-directional thermal stress variation regularities of the other nodes are also similar to those of the nodes 1, 2 and 3, except for the reactivated time.
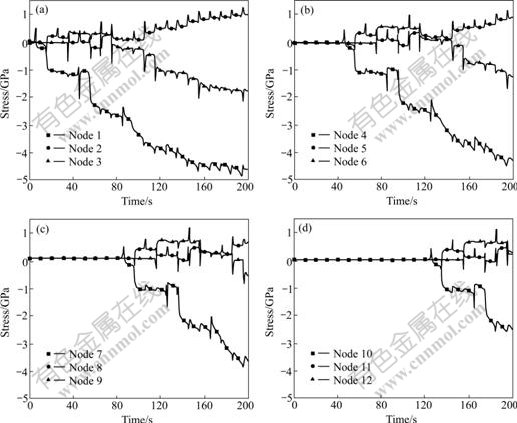
Fig.8 Z-directional thermal stress variation curves of different nodes on longitudinal section A��A
By comparing the Von Mise��s, X-directional, Y-directional and Z-directional thermal stress variations of those nodes located in different tracks and different layers, the following conclusions can be made: 1) The Von Mise��s, X-directional, Y-directional and Z-directional thermal stress variation regularities of the nodes in the same track but in different layers are analogical; 2) According to Eqn.(4), among all those force components of Von Mise��s effective stress, the X-directional and Z-directional thermal stress are much larger than the Y-directional thermal stress, so the X-directional and Z-directional thermal stress are the main reasons for the fracture of specimens.
3.3 LMDS experiment and analysis
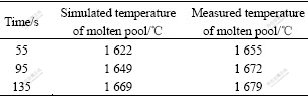
With 800 W of laser power, 1 mm of spot diameter, 5 mm/s of scanning velocity, 4 g/min of powder feeding rate, 20�� of room temperature, through the LMDS system which has been developed successfully by Shenyang Institute of Automation, Chinese Academy of Sciences, LMDS experiments have been conducted. In order to measure the temperature of molten pool, the self-developed CCD colorimeter temperature measurement system has been used[11]. Its structure diagram is shown in Fig.9. The measured and simulated temperatures of molten pool at different time are listed in Table 3.
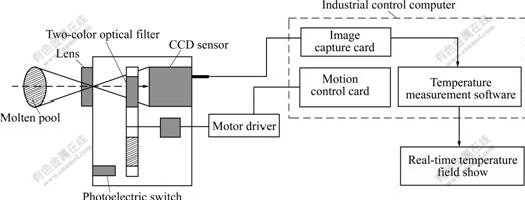
Fig.9 Structure diagram of CCD colorimeter system
Table 3 Measured and simulated temperature of molten pool at different time
Some nickel-based superalloy components are fabricated and shown in Fig.10. For the real-time measurement of the thermal stress during LMDS processing is very difficult, in this work, the engendering and developing regularities of fractures are used to verify the simulations. Among those parts, the first and the second ones are two fractured specimen of aerofoil (Fig.10(a) and Fig.10(b)); the third one is a fractured thin-wall part (Fig.10(c)). As displayed in the figure, the region at which specimen and substrate connect is the frequent area of fracture. Furthermore, the fracture always takes place along the X direction and grows along the Z direction, the vertical direction of substrate (see the area marked by circles in Fig.10). This is because the dominating portions of thermal stresses are X-directional and Z-directional thermal stresses, which is in accord with the former thermal stress analysis.
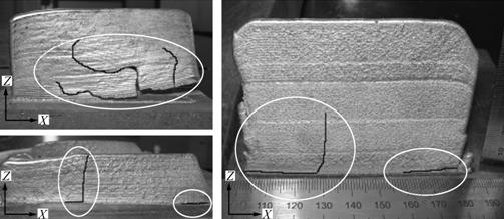
Fig.10 Nickel-based superalloy components fabricated using LMDS system
4 Conclusions
1) Although the nodes, which locate in the different layers of the same longitudinal section, have different activated time, they have similar temperature and thermal stress variation regularities. The temperature gradients in specimen are mainly along Z direction, and the temperature gradients in substrate are mainly parallel to the substrate. The upper surface and the side of specimen as well as the surface where specimen and substrate connect are high stress regions. Among all those force components of Von Mise��s effective stress, the X-directional and Z-directional thermal stress is much larger than the Y-directional thermal stress, so the Von Mise��s effective stress mainly takes on X-directional and Z-directional thermal stress.
2) Some nickel-based LMDS experiments are conducted to verify the numerical results values. In those experiments, the measured temperatures of molten pool are in good agreement with the simulated values, and the engendering and developing regularities of fractures show good agreement with the simulation predictions, too.
3) In the different layers of the specimen, the Von Mise��s effective and Z-directional thermal stress values of those nodes situated in the first track are almost twice the values of those nodes situated in the last track, so, the start point of each layer has an enormous effect on the distribution and intensity of thermal stress.
References
[1] PHAM D T, GAULT R S. A comparison of rapid prototyping technologies [J]. International Journal of Machine Tools and Manufacture, 1998, 38(10): 1257-1287.
[2] SCHLIENGER E, DIMOS D, GRIFFITH M, MICHAEL J, OLIVER M, ROMERO T, SMUGERESKY J. Near net shape production of metal components using LENS [C]// Proceedings of the Third Pacific Rim International Conference on Advanced Materials and Processing, Honolulu, Hawail, 1998: 1581-1586.
[3] ATWOOD C L, GRIFFITH M L, HARWELL L D, GREENE D L, RECKAWAY D E, ENSZ M T, KEICHER D M, SCHLIENGER M D, ROMERO J A, OLIVER M S, JEANTETTE F P. Laser spray fabrication for net-shape rapid product realization LDRD [R]. SAND99-0739, California: Sandia National Laboratories, 1999.
[4] GRIFFITH M L, SCHLIENGER M E, HARWELL L D, et al. Understanding thermal behavior in the LENS process [J]. Materials and Design, 1999, 20(2/3): 107-113.
[5] YE Ri-qing, SMUGERESKY J E, ZHENG Bao-long, ZHOU Yi-zhang, LAVERNIA E J. Numerical modelling of the thermal behavior during the LENS? process [J]. Materials Science and Engineering A, 2006, 428(1/2): 47-53.
[6] KOBRYN P A, MOORE E H, SEMIATIN S L. The effect of laser power and traverse speed on microstructure, porosity, and build height in laser deposited Ti-6Al-4V [J]. Scripta Materialia, 2000, 43(4): 299-305.
[7] ZHANG Kai, LIU Wei-jun, SHANG Xiao-feng. Research on the processing experiments of laser metal deposition shaping [J]. Optics & Laser Technology, 2007, 39(3): 549-557.
[8] LI Yan-min, YANG Hai-ou, LIN Xin, HUANG Wei-dong, LI Jian-guo, ZHOU Yao-he. The influences of processing parameters on forming characterizations during laser rapid forming [J]. Materials Science and Engineering A, 2003, 360(1/2): 18-25.
[9] ZHANG Xiao-hong, ZHAO Hai-yan, CAI Zhi-peng, WU Su. FEM analysis and a correction on plasticity effect at the hole edge when using the centre hole method for measuring residual stress [J]. Chinese Journal of Mechanical Engineering, 2005, 41(3): 193-200. (in Chinese)
[10] ZHANG Hua, PAN Ji-luan, LIAO Bao-jian. Study on real-time measurement for temperature field by images colorimetric method [J]. Chinese Journal of Mechanical Engineering, 1998, 34(2): 1-7. (in Chinese)
[11] XING Fei, LIU Wei-jun, WANG Tian-ran. On-line, small-eyeshot, large-measurement-range, and high performance thermographic system [J]. Chinese Journal of Scientific Instrument. 2006, 27(6): 465-467. (in Chinese)
[12] LABUDOVIC M, HU D, KOVACEVIC R. A three dimensional model for direct laser metal powder deposition and rapid prototyping [J]. Journal of Materials Science, 2003, 38(1): 35-49.
[13] XI Ming-zhe, ZHANG Yong-zhong, SHI Li-kai. Numerical simulation of 3D transient temperature field in thin-wall metal parts fabricated by laser direct deposition [J]. The Chinese Journal of Nonferrous Metals, 2003, 13(4): 887-892. (in Chinese)
[14] XI Ming-zhe, YU Gang. Numerical simulation for the transient temperature of 3D moving laser molten pool [J]. Chinese Journal of Lasers, 2004, 31(12): 1527-1532. (in Chinese)
[15] ANYSY Inc.. ANSYS theory manual [M]. Release 8.0. USA: ANSYS Inc., 2003.
[16] Chinese Iron-Steel Research Institute. Complex alloy steel manual: Lower volume [M]. Beijing: Metallurgical Industry Press, 1992: 3-45. (in Chinese)
Foundation item: Project(2002AA420060) supported by the Hi-tech Research and Development Program of China
Corresponding author: LONG Ri-sheng; Tel: +86-24-23815396; E-mail: longrisheng@sina.com
(Edited by LI Xiang-qun)
