
Trans. Nonferrous Met. Soc. China 24(2014) 2642-2649
Numerical and experimental studies of flow field in hydrocyclone with air core
Bao-yu CUI1, De-zhou WEI1, Shu-ling GAO1, Wen-gang LIU1, Yu-qing FENG2
1. College of Resources & Civil Engineering, Northeastern University, Shenyang 110819, China;
2. CSIRO Computational Informatics, VIC 3169, Australia
Received 24 July 2013; accepted 26 December 2013
Abstract:
For the flow field in a d50 mm hydrocyclone, numerical studies based on computational fluid dynamics (CFD) simulation and experimental studies based on particle image velocimetry (PIV) measurement were carried out respectively. The results of two methods show that air core generally forms after 0.7 s, the similar characteristics of air core can be observed. Vortexes and axial velocity distributions obtained by numerical and experimental methods are also in good agreement. Studies of different parameters based on CFD simulation show that tangential velocity distribution inside the hydrocyclone can be regarded as a combined vortex. Axial and tangential velocities increase as the feed rate increases. The enlargement of cone angle and overflow outlet diameter can speed up the overflow discharge rate. The change of underflow outlet diameter has no significant effect on axial and tangential velocities.
Key words:
hydrocyclone; computational fluid dynamics; particle image velocimetry; flow field; air core;
1 Introduction
Hydrocyclone has been widely used in many areas of separation due to the advantages of its low operating cost and maintenance, high throughput, low floor space requirement etc [1,2]. Multiple investigations on hydrocyclones have been carried out by several researchers since the 1950s [3]. Now, a commonly accepted wisdom is that the separation characteristics of the hydrocyclone including classification efficiency and cut size depend on the flow field, which has been a hot area of hydrocyclone research in recent years [1-4].
The flow field in a hydrocyclone, which is characterized by a complex three dimensional swirling flow with an air core, is decided by various operational and structural parameters. Operational parameters mainly include feed rate and slurry concentration; whilst structural parameters are composed of feed inlet form, vortex finder form, overflow outlet diameter, underflow outlet diameter and cone angle, etc. The detailed velocity profiles in a hydrocyclone were measured first by KELSALL using a stroboscope [3]. With the development of laser and high-speed camera technologies, laser Doppler velocimetry (LDV) and particle image velocimetry (PIV) were utilized to investigate the flow field inside hydrocyclones [5,6]. DABIR and PETTY [7] measured the tangential and axial velocities in hydrocyclones using LDV as early as 1984, and the tangential and axial velocities were detected by RAJAMANI, FISHER, ELDIN et al individually using LDV or PIV [8-11]. CFD simulation becomes an important numerical method for the detailed study of the flow field of hydrocyclones due to the rapid development of computer technology and mathematical models [12,13]. The first successful CFD predicting work on hydrocyclones was reported by RODES et al in 1987 [14]. Nowadays, the CFD modeling software packages, including ANSYS/Fluent, have shown sufficient accuracy in modeling the flow field in a hydrocyclone, and the simulation results have been compared with the LDV or PIV experimental measurement with good agreement [12-15].
However, most of the related numerical and experimental studies were about the flow velocities of the hydrocyclone with constant structural parameters. The air core, as an inevitable phenomenon of the flow field inside hydrocyclones, was involved rarely in similar literatures. Additionally, there are no general rules that can be used to quantitatively predict the performance for a specific hydrocyclone. Numerical simulation and validation experiment are still required to assess the relative performance of a new designed hydrocyclone. In this work, a d50 mm hydrocyclone was studied. Numerical studies on the flow field with an air core inside the hydrocyclone were carried out by the use of ANSYS/Fluent with the Reynolds stress model (RSM) for the turbulence calculation and the volume of fluid (VOF) model for capturing the air-liquid interface. PIV measurements were conducted at the same condition to validate the simulation results. Numerical simulation results were compared with the experiments in terms of the forming process and characteristics of the air core, the flow velocities characteristics. Following model validation, the numerical method was extended to study the effect of different operational and structural parameters on flow field inside the hydrocyclone.
2 Model description
2.1 Hydrocyclone geometry
The geometry of the hydrocyclone used for numerical and experimental models in this study is presented in Fig. 1, which is a typical hydrocyclone type with the specific dimensions for separating mineral particles.
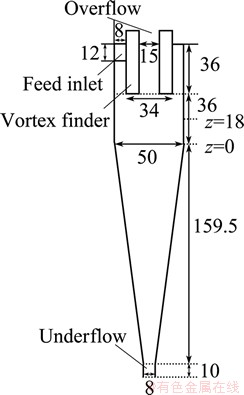
Fig. 1 Geometry of hydrocyclone of base case (unit: mm)
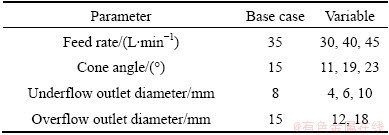
Table 1 lists the parameters investigated in this study, of which air core investigation and flow structures are conducted based on base case; the variable parameters, including the feed rate, cone angle, underflow outlet diameter and overflow outlet diameter, are investigated to study the influence of different parameters on flow field inside the hydrocyclone. For experimental model, due to the cost to change the structural parameters, the investigation was focused on one set of structural parameter, referred as base case. For model validation purpose and for convenience of measurement, the study was conducted using an air-water system. As an initial phase of study, no particles are injected. Influence of particles on the flow field will be discussed in the other paper.
Table 1 Parameters investigated in this study
2.2 Numerical model
Simulation of complex hydrodynamics in a hydrocyclone requires accounting for the irregular interface between air core and surrounding liquid, as well as the turbulence induced by the strong swirling flow. This has been a challenging task in the numerical modeling of multiphase flow over the past few decades.
In this study, details of the modeling approach are well documented in literature and recently widely used in the study of hydrocyclones [12-14,16]. Here, only the key governing equations are briefly provided.
For incompressible fluid, the equations for mass (or continuity) and the momentum in a general form are as follows [16]:
 (1)
(1)

 (2)
(2)
The RSM model uses the following transport equation for the Reynolds stress:

 (3)
(3)
For VOF model, the governing equation for the phase i can be written as
 (4)
(4)
Mass flow inlet is set and assumed to be constant with a specified feed rate. The volume fraction of water fed from inlet is 1. Pressure outlets are set for overflow and underflow and assumed to be at atmospheric or zero gauge pressure. No-slip boundary conditions are applied to all walls. Initially, the whole fluid domain is assumed to be filled with air representing a startup condition of an actual operation.
ANSYS Meshing is used for meshing the geometries into hexahedral meshes. Grid dependency studies are carried out with mesh quantities: 300000, 350000, 400000 and 450000. It is observed that the 400000 cells are optimal for a compromised consideration of simulation accuracy and computing time. The mesh for the numerical simulation is shown in Fig. 2.

Fig. 2 Mesh structure of hydrocyclone for numerical simulation
2.3 Experimental model
Physical experiments were constructed using the base case structural parameters. Figure 3(a) shows a photo of the experimental model setup. Transparent plexiglass was used as the wall materials. In order to reduce errors caused by laser scattering, a couple of orthogonal planes were processed in the outside of the transparent model. Two measurement technologies were applied: CCD camera to record the air core forming process and PIV measurement to obtain the detailed flow field over a vertical plane crossing the hydrocyclone center. Figure 3(b) shows the PIV measurement system, which consists of a fluid circulation system and a PIV system.
Polystyrene powder (5-10 ��m, 1050 kg/m3) was used as tracer particle in the tests. The phenomenon was captured by CCD camera from the beginning to investigate the forming process and characteristics of the air core. After the air core was fully developed, PIV measurement was carried out to obtain the flow velocities over a vertical plane passing the hydrocyclone centre axis. A total of 200 transient velocity frames were recorded to obtain a time averaged value.
3 Results and discussion
3.1 Air core investigation
Figure 4 shows the air core forming process from both CFD simulation (upper) and physical experiment (lower). As liquid water is introduced into the initially empty hydrocyclone, the hydrocyclone cavity is filled with a gradual development of a liquid layer due to the centrifugal forces and solid walls, and then air continues to be extruded. The interface between the air core and the surrounding liquid is very unstable at the beginning. The air core is generally formed at about 0.7 s, the flow field reaches a pseudo-steady state after about 1.7 s in which the air outside of the air core is eliminated completely. Note that both simulation and experiment are plotted at the same time. In general, the numerical simulation results are in good agreement with those of the physical experiment conducted at the same condition.
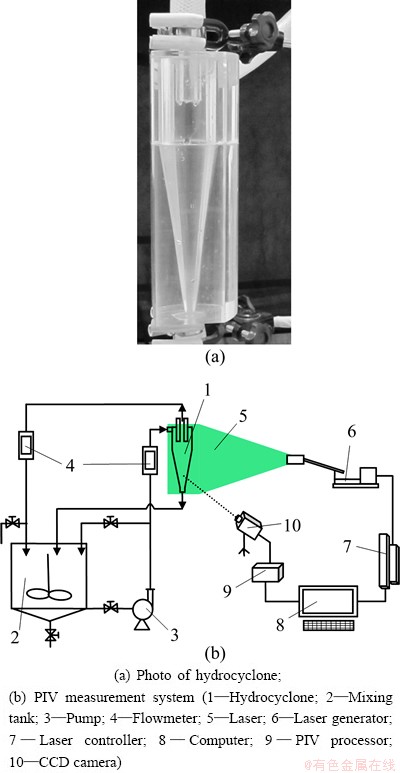
Fig. 3 Experimental model setup
Figure 5 shows the axial velocity on centerline at different times obtained by CFD simulation. It can be found that in the initial stages (before 0.3 s) the axial velocity on centerline is fully upward, in other words, the air is extruded through overflow outlet. Then, air backflow occurs at overflow outlet because of the negative pressure caused by high speed rotating flow. The fully developed air core is like a twisted rope, the air enters the hydrocyclone from underflow outlet and exhausts through overflow outlet, but there is downward air backflow in the center of overflow tube. Two obvious characteristics are the largest swing on the top of underflow tube and the protuberance resembling the Adam��s apple at the bottom of the vortex finder. Both the swing and the protuberance can be seen clearly from Fig. 4 at 1.7 s. The reasons for the two characteristics of the air core can be seen easily from Fig. 5. The swing is caused by the derivative vortex of forced vortex and free vortex, the axial velocity here begins to decline (between sections (a) and (b) in Fig. 5. The reason for the protuberance is the collision of the primary air from underflow outlet and the backflow air from overflow outlet, the axial velocity translates into radial velocity, and the former reduces to proximate zero (between sections (c) and (d) in Fig. 5).
The locus of zero axial velocity (LZVV) is one of the important characteristics of the flow field inside hydrocyclones. Solid particles with diameters equal to the cut size of d50 exist in the surrounding of LZVV, and these particles have a 50% chance of exiting the hydrocyclone either through the overflow or underflow outlets. The white line in Fig. 4 at 1.7 s represents the LZVV, which is consistent with theoretical prediction.

Fig. 4 Forming process and characteristics of air core
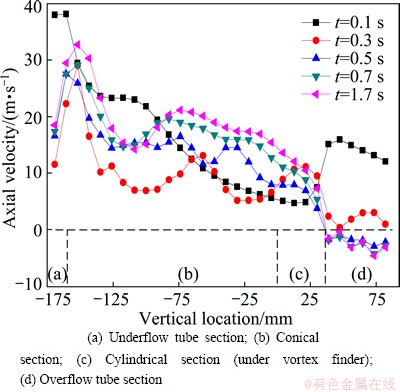
Fig. 5 Axial velocity on centerline at different times obtained by CFD simulation
3.2 Flow structures
The solid separation characters are closely related to the flow structures. Figure 6 shows the flow structures in terms of streamlines and pressure distribution, which may indicate the separation process. As shown in Fig. 6(a), started from the inlet, the liquid mainly flows helically downward at the region close to the outside walls. Some liquids change their direction at the region close to the air core and move upward. Figure 6(b) plots the pressure distribution over a vertical plane crossing the vertical axis. The strong swirling flow leads to higher pressure gradient along the radius direction. Negative pressure occurs in the air core region. Particles with different size and/or density will have different response to the flow velocity and pressure gradient, which achieves particles�� separation. In general, the separation mechanisms can be reasonably explained based on the flow dynamics. As this study is based on liquid flow only, the detailed solid separation is not investigated. Further work with the consideration of solid flow, as reported in Ref. [17], is required to quantitatively assess the separation characteristics, which represents our ongoing research.

Fig. 6 Flow hydrodynamics simulation at pseudo-steady state
Figure 7 shows the velocity vector field of middle region over a vertical plane crossing the vertical axis in the hydrocyclone. Figure 7(a) is obtained from CFD simulation, and Fig. 7(b) is obtained from PIV measurement. It can be seen that the flow direction of external flow is downward and that of internal flow is opposite. The comparison of the two plots shows that the vortexes are captured almost at the same position.

Fig. 7 Velocity vector field obtained from CFD simulation (a) and PIV measurement (b)
Axial velocity distributions over a diameter line in z=0 and z=18 mm planes are also compared respectively, and the results are shown in Fig. 8. It can be found that the axial velocity distributions obtained by the both methods are in very good agreement.
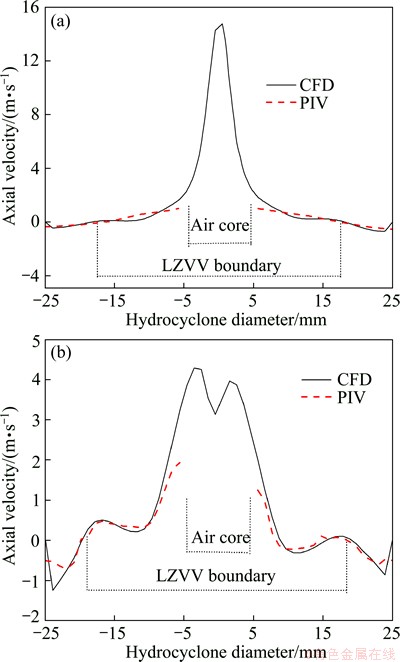
Fig. 8 Comparison of axial velocity distribution over diameter lines in z=0 (a) and z=18 mm (b) planes
The good agreement between the experimental measurement and CFD simulation demonstrates the validity of using the numerical method to study the likely effect of different parameters on the hydrocylone hydrodynamics.
3.3 Influence of operational and structural parameters
Following model validation, the numerical method is extended to study the likely effect of different parameters, the feed rate as operational parameter, cone angle, underflow outlet diameter and overflow outlet diameter as structural parameters. The distributions of tangential and axial velocities over a diameter line in z=0 mm plane are investigated under different parameters. Influence of parameters on flow field can be learnt by analyzing the distributions of these flow velocities.
For the three-dimensional flow inside the hydrocyclone, tangential velocity is the most important velocity component, which decides the magnitude of centrifugal force, hence controls the particle separation characteristics. Figure 9 shows the distributions of tangential velocities under different investigated parameters. Two vertical lines are plotted to identify the boundary of forced vortex of the base case. As can be seen from Fig. 9, for all the simulated cases, the maximum tangential velocities occur near the boundary of forced vortex. Inside the forced vortex, the tangential velocity, ut, is proportional to hydrocyclone radius, r, i.e., ut=rC, where C is a constant. Outside the forced vortex, the tangential velocity, ut, is approximately inversely proportional to the radius, r, i.e., utr0.52-0.63=C. Therefore, the relationship between ut and r can be written as utrn=C, where n is an exponent and is an important parameter of hydrocyclone. Inside the forced vortex, n=-1. Outside the forced vortex, n=0.52-0.63, indicating a quasi-free vortex motion. In Fig. 9(a), the tangential velocities increase with the increase of feed rate, but the exponent n and the positions of peak values are almost the same, which means that the feed rate only impacts the tangential velocities magnitude. In Fig. 9(b), the tangential velocities increase with the increase of the cone angle, and the exponent n has the same trend, and changes from 0.52 to 0.63 when the cone angle of the hydrocyclone changes from 11�� to 23��. Figure 9(c) shows that the underflow outlet diameter has little effect on the tangential velocities at the selected location. Possibly the investigated location is far away from the underflow outlet. Further investigation will be conducted to check its effect on the regions close to the outlet. Figure 9(d) shows the effect of overflow outlet diameter. It is interesting to see that the maximum effect occurs in the region near the interface between the forced vortex and quasi-free vortex, while there is little effect on the quasi-free vortex region close to the walls.
Figure 10 shows the axial velocity distribution over a horizontal line at the same location as selected in Fig 9. The zero velocity indicates the boundaries of LZVV, a horizontal line is plotted to help identifying the LZVV point. Two vertical lines are plotted as well to identify the boundary of forced vortex of the base case. The axial velocities in quasi-free vortex are useful for particle separation. It can be seen from Fig. 10(a) that, the axial velocities rise with the increase of feed rate because of the increase of feed velocity. In Fig. 10(b), with the increase of cone angle, the downward velocities of external flow decrease, and the upward velocities of internal flow increase. The reason is that the counterforce against the fluid by the hydrocyclone walls increases.

Fig. 9 Distributions of tangential velocities under different parameters obtained from numerical method

Fig. 10 Distributions of axial velocities under different parameters obtained from numerical method
Figure 10(d) shows that bigger overflow outlet diameter can strengthen the upward velocities clearly. Axial velocities inside forced vortex in Fig. 10 show that the feed rate has no obvious effect on air core, and too small underflow and overflow outlet diameters will prevent the forming of air core. Similar to the effect on the tangential velocity (Fig. 9(c)), the underflow outlet diameter has little effect on the axial velocity in this region either.
Different flow fields are needed for different purposes or different mineral particles. But appropriate flow field can be estimated according to Figs. 9 and 10.
4 Conclusions
1) Both CFD simulation and physical experiment show that the air core forms after 0.7 s. The air of the air core enters the hydrocyclone from the underflow outlet and exhausts through the overflow outlet. The largest swing of the air core occurs in the region close to the underflow tube, and a protuberance resembling the Adam��s apple appears when the air core enters the overflow tube.
2) The vortexes are captured almost at the same position by the two methods. Axial velocity distributions over diameter lines in z=0 and z=18 mm obtained by the both methods are also in very good agreement.
3) Tangential velocity distribution can be regarded as a combined vortex, i.e., utr=C. Inside air core, n=-1, indicating a forced vortex motion. While outside air core, n=0.52-0.63, demonstrating a quasi-free vortex motion. For the important parameter ��n�� of the hydrocyclone, numerical simulation is a feasible method.
4) Both axial and tangential velocities rise with the increase of feed rate. The enlargement of cone angle can also increase the upward axial and tangential velocities, but reduce the downward axial velocity. The change of underflow outlet diameter has no significant effect on axial and tangential velocities. Axial velocity rises with the increase of overflow outlet diameter, but there is no significant change in tangential velocity.
References
[1] XU Ji-run. Study on forced vortex and internal losses in hydrocyclone [D]. Shenyang: Northeastern University, 1989: 21-45. (in Chinese)
[2] PANG Xue-shi. Technology and application of hydrocyclone [M]. Beijing: China Petrochemical Press, 2011: 18-45. (in Chinese)
[3] KELSALL D F. A study of the motion of solid particles in a hydrocyclone [J]. Transactions of the Institution of Chemical Engineering, 1952, 30: 87-104.
[4] CHU Liang-yin. Energy consumption mechanism and energy saving principles in hydrocyclones [D]. Chengdu: Sichuan University, 1997: 35-56. (in Chinese)
[5] MARINS L P M, DUARTE D G, LOUREIRO J B R, MORAES C A C, FREIRE A P S. LDA and PIV characterization of the flow in a hydrocyclone without an air-ore [J]. Journal of Petroleum Science and Engineering, 2010, 70(3-4): 168-176.
[6] JONAS B, HANNES V. Velocity measurements in a cylindrical hydrocyclone operated with an opaque fiber suspension [J]. Minerals Engineering, 2004, 17(5): 599-604.
[7] DABIR B, PETTY C A. Laser Doppler anemometry measurements of tangential and axial velocities in a hydrocyclone operation without an air core [C]//Proceedings of the Second International Conference on Hydrocyclone. Bedford: The Fluid Engineering Centre, 1984: 15-26.
[8] DEVULAPALLI B, RAJAMANI R K. Application of LDV to the modeling of particle size classification in industrial hydrocyclones [J]. Advances and Applications, 1994, 191: 41-48.
[9] LIM E W C, CHEN Y R, WANG C H, WU R M. Experimental and computational studies of multiphase hydrodynamics in a hydrocyclone separator system [J]. Chemical Engineering Science, 2010, 65(24): 6415-6424.
[10] BAI Zhi-shan, WANG Hua-lin, TU Shan-tung. Experimental study of flow patterns in deoiling hydrocyclone [J]. Minerals Engineering, 2009, 22(4): 319-323.
[11] BRENNAN M S, FRY M, NARASIMHA M, HOLTHAM P N. Water velocity measurements inside a hydrocyclone using an Aeroprobe & comparison with CFD predictions [C]//Proceedings of the 16th Australasian Fluid Mechanics Conference. Gold Coast: The University of Queensland, 2007: 1131-1136.
[12] DELGADILLO J A, RAJAMANI R K. A comparative study of three turbulence-closure models for the hydrocyclone problem [J]. International Journal of Mineral Processing, 2005, 77(4): 217-230.
[13] HWANG K J, WU W H, QIAN S X, NAGASE Y C. CFD study on the effect of hydrocyclone structure on the separation efficiency of fine particles [J]. Separation Science and Technology, 2008, 43(15): 3777-3797.
[14] RODES N, PERICLEOUS K A, DRAKE S N. The prediction of hydrocyclone performance with a mathematical model [C]//3rd International Conference on Hydrocyclone. Oxford: Elsevier, 1987: 113-117.
[15] GAO Shu-ling, WEI De-zhou, LIU Wen-gang, MA Long-qiu, LU Tao, ZHANG Rui-yang. CFD numerical simulation of flow velocity characteristics of hydrocyclone [J]. Transactions of Nonferrous Metals Society of China, 2011, 21(12): 2783-2789.
[16] BRENNAN M. CFD simulations of hydrocyclones with an air core: Comparison between large eddy simulations and a second moment closure [J]. Chemical Engineering Research and Design, 2006, 84(6): 495-505.
[17] CHU K W, WANG B, YU A B, VINCE A. Particle scale modelling of the multiphase flow in a dense medium cyclone: effect of vortex finder outlet pressure [J]. Minerals Engineering, 2012, 31: 46-58.
��������������������������ֵ�������о�
�ޱ���1��κ����1��������1�����ĸ�1��Yu-qing FENG2
1. ������ѧ ��Դ����ľ����ѧԺ������ 110819��
2. CSIRO Computational Informatics, VIC 3169, Australia
ժ Ҫ�����d50 mmˮ�����������������ֱ�����˻���CFDģ�����ֵ�о��ͻ���PIV�������Ե������о������ַ����Կ��������о��������������������0.7 s���Ҵ��³��Σ��Ҷ������ÿ������������Ƶ������������ٶ������о������ʾ��������ʸ��ͼ�У������������о�����������ͬһλ�ò�����CFDģ���PIV�������������ٶȷֲ����Ҳ�߶�һ�¡���CFD��ֵ�о��ķ������첻ͬ���������������ٶȺ������ٶȵ�Ӱ�����������������������ٶȷֲ�����������������������������ʹ�������������ǻ���������ֱ������ӿ��������ų��ٶȣ�����ɰ�ڵı仯�����ٵ�Ӱ�����С��
�ؼ��ʣ�ˮ����������CFDģ�⣻PIV��������������
(Edited by Hua YANG)
Foundation item: Projects (50974033, 51104035) supported by the National Natural Science Foundation of China
Corresponding author: Bao-yu CUI; Tel/Fax: +86-24-83692711; E-mail: cuibaoyu@mail.neu.edu.cn
DOI: 10.1016/S1003-6326(14)63394-X
Abstract: For the flow field in a d50 mm hydrocyclone, numerical studies based on computational fluid dynamics (CFD) simulation and experimental studies based on particle image velocimetry (PIV) measurement were carried out respectively. The results of two methods show that air core generally forms after 0.7 s, the similar characteristics of air core can be observed. Vortexes and axial velocity distributions obtained by numerical and experimental methods are also in good agreement. Studies of different parameters based on CFD simulation show that tangential velocity distribution inside the hydrocyclone can be regarded as a combined vortex. Axial and tangential velocities increase as the feed rate increases. The enlargement of cone angle and overflow outlet diameter can speed up the overflow discharge rate. The change of underflow outlet diameter has no significant effect on axial and tangential velocities.
