
J. Cent. South Univ. Technol. (2008) 15(s1): 374-380
DOI: 10.1007/s11771-008-383-2
![]()
Rheological characteristics of soft rock structural surface
CHEN Yuan-jiang(���佭)1, 2, WU Chao(�� ��)1, FU Yi-ming(������)2
(1. School of Resources and Safety Engineering, Central South University, Changsha 410083, China;
2. Post doctor Station of Mechanics, Hunan University, Changsha 410082, China)
Abstract:
There are two mechanisms of the coarse surface asperity resistance effect and rubbing resistance effect in the course of the soft rock structural surface creep, of which the former plays a dominant role in hindering the deformation in the starting creep phase, so that the structural surface creep usually displays the strong surface roughness effect, and so does the latter when the asperities in the coarse surface were fractured by shearing. Under the low stress condition, there are only two phases of the decelerating creep and the constant creep for the soft rock structural surface, and as the stress increases and overcomes the rubbing resistance, the accelerating creep failure of the structural surface will happen suddenly. Therefore, a multiple rheological model, which combines the nonlinear NEWTON body (NN) of a certain mass and the empirical plastic body (EM) with the classical SAINT VENANT body, NEWTON body, KELVIN body and HOOKE body, could be used to comprehensively describe the creep characteristics of the soft rock structural surface. Its mechanical parameter values will vary owing to the different surface roughness of the structural surface. The parameters of GH, GK and ��L are positively linearly correlative to the surface roughness. The surface roughness and m are negative exponential function correlation. The long-term strength ��S is positively correlative to the surface roughness.
Key words:
soft rock; structural surface; rheological characteristic; rheological model��
1 Introduction
Rheology of soft rock owns the strong structure effect. The rheology of structural surface is usually the main factor that induces the deformation and destroy of the surrounding rock mass in the soft rock engineering[1]. Therefore, it is significant for the engineer to study the rheological mechanical characters of the structural surface in the soft rock engineering. But so for the study about the rheological characteristic of the structural surface is still primitive so that it couldn��t effectively reflect the real constitutive mechanical characteristics in the course of nonlinear rheological destroy of structural surface[1-3]. So in this paper the rheological characteristics of the structural surface of soft rock were deeply probed into by the multi-step incremental cycling loading and unloading shear creep test and a new nonlinear multiple rheological model was gained. The surface roughness effect of the structural surface rheology was also studied.
2 Rheological constitutive mechanical characteristics of structural surface in soft rock
In order to study the rheological constitutive mechanical characteristics of the structural surface in soft rock, some structural surface samples of the sand shale rock from the roof of No.5 coal seam in certain coal mine were cut into the standard samples and two half walls of the structural surface were made respectively into the upper and the lower shear mold in a specified steel mould box with 20 cm��35 cm surface. Then the creep compression-shear tests were performed by the compression-shear creep instrument. In the course of the creep test the creep shear stress was parallel to the long side of the sample and the shear deformation was reflected directly by the shear displacement measured. In these tests the influence of the normal stress on the creep characteristics of the structural surface would not be considered and the normal displacement induced by the shear would also be neglected because the normal stress of the compression-shear test was set to be a constant for all the structural surfaces based on their surface area. The creep shear tests were done in the multi-step incremental cycling loading and unloading mode with 4 or 5 shear stress levels. Its test results were shown as the symbol ��?�� in Fig.1. Some conclusions were drawn directly from Fig.2 as follows:
1) The creep deformation of the structural surfaces under all the stress levels in the tests consisted of the instantaneous elasticity, instantaneous plasticity, visco-elasticity and visco-plasticity deformation, in which the instantaneous deformation value would be far larger than the viscous deformation one when the shear creep destroy of the structural surface did not happen.
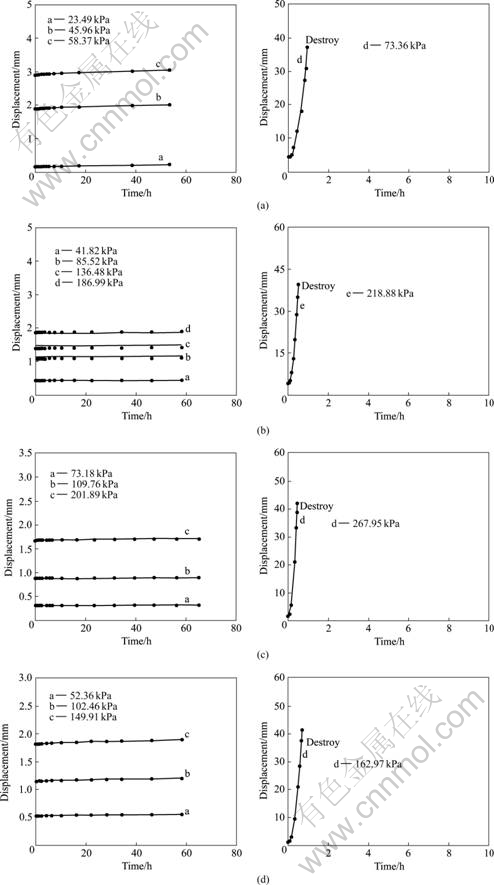
Fig.1 Actual measured data points and theoretical computing curves of all structural faces: (a) No.2 structural face; (b) No.3 structural face; (c) No.4 structural face; (d) No.5 structural face
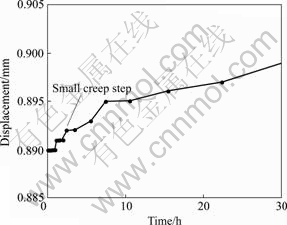
Fig.2 Creep step phenomena of No.3 structural face
2) If the shear stress level was not very high(referring to the left figure in Fig.1), the creep deformation of the structural surface would only be composed of two creep phases of the decelerating and constant phase. Moreover, the constant creep phase would last for a very long time because its deformation speed was very low. During the whole creep test under no high stress level, the phase still continued and did not develop into the accelerated creep phase.
3) When the shear stress level increased to a certain degree and went beyond certain specified value (referring to the right figure in Fig.1), the creep deformation of the structural surface would rapidly develop into destroy, which did not show the usual characteristic of three creep phases of the decelerating, constant and accelerated phase. So the specified shear stress value would be regarded as the creep long-term strength of the structural surface which was only used as a valve value right now to indicate whether the accelerated creep destroy would appear.
4) During the initial stage of the structural surface creep under the constant shear stress there appeared the clear ��step�� phenomena which were shown in Fig.2 by the creep curve of No.3 structural surface. The phenomena were related to the intermittent destroy of the small asperities on the rough surface of the structural surface.
It could be inferred from the creep deformation characteristics as above that there were two action mechanisms in the creep course of the structural surface of the soft rock, which were the friction dragging action and the asperity resistance action on the surface of the structural face. The asperity resistance action would play an important role in the initial stage of the creep deformation, and then when the small asperities were sheared into destroy, the friction dragging action would take action. While the external shear stress increased so that it could surmount the friction dragging action, the accelerated creep destroy would suddenly happen. All the characteristics were different not only from the ��climbing slope�� phenomena in the slope-climbing course of the hard rock[3] but also from the whole creep process of the soft rock block[4]. There were different values of the instantaneous elasticity, instantaneous plasticity, visco-elasticity and visco-plasticity deformation as the different structural surfaces crept, which was not only related to the constant creep shear stress level, but also possibly related to the surface geometric pattern of the structural face to a great degree.
Based on the constitutive mechanical characteristics of the creep deformation of the structural surface, a new multiple rheological component model was put forward to describe the complicated nonlinear creep of the structure face, shown in as Fig.3.
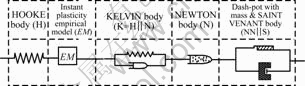
Fig.3 Multiple rheological mechanical model of structural face
In Fig.3, HOKE body (H) and KELVIN body (K) were used to respectively describe the instantaneous elasticity and visco-elasticity deformation of the structural surface creep, and the linear NEWTON body (N) was used to describe the visco-plasticity deformation when the structural surface creep couldn��t develop into destroy because the creep shear stress was below the long-term strength. Without the prepared model component to describe the instantaneous plasticity deformation of the structural surface creep, an empirical model (EM) would be used for the deformation, whose constitutive law could be gained from the real creep deformation data by the nonlinear regressive analysis method. In addition, a dash-pot with a certain mass (NN) that was in parallel connection with SAINT VENANT body (S) was employed for describing the rapid creep and destroy of the structural face. Therefore, the creep constitutive equations of the multiple models were as follows:
1) When �ӣ���S, the creep deformation of the dash-pot with a certain mass did not happen, and ![]() (1)
(1)
At this moment, the accelerated creep phase did not appear and the creep deformation would develop infinitely. Considering the limited using time of the soft rock engineering, the creep should belong to the stable one if the creep displacement was within the range of the permitted displacement of the engineering surrounding rock.
2) When �ӡݦ�S, the creep deformation of the dash-pot happened, and
![]() (2)
(2)
At this moment the accelerated creep phase appeared in the course of the structural face creep and the creep destroy would occur in a very short time only after the creep shear stress was exerted so the creep of the structural face was unstable. In the formulas as above, u is the shear creep deformation, ��c is the creep shear stress, t is the creep time, EM(��c) is the empirical instantaneous plasticity deformation, GH is the elasticity parameter of H body, GK is the elasticity parameter of K body, ��K is the viscosity parameter of K body, ��L is the viscosity parameter of N body, m is the mass of NN body, ��S is the parameter of S body which was also the long-term strength of the structural face. On the basis of the testing results in Fig.1 and by the nonlinear regressive method[4], the specific values of all parameters of the multiple mechanical model were shown in Table 1, where the nonlinear empirical regressive equations (all their regressive relative coefficients were above 0.95) of the instantaneous plasticity strains of all the structural faces were also shown as the creep constitutive equations of the empirical model component EM. Based on the parameter values in Table 1, the theoretical creep curves of all the structural faces under different load levels were shown by the solid lines in Fig.1. It was obvious that the theoretical results were corresponded with the testing results well and the new multiple model could be used for effectively describing the complicated nonlinear creep of the structure face.
3 Surface roughness effect of structural surface rheology
It is shown in Fig.1 and Table 1 that for different structural surfaces, there are the different values of the instantaneous elasticity, instantaneous plasticity, visco-elasticity and visco-plasticity deformation, and then the values of the parameters of the creep constitutive model are also different, which is related to the surface topography characteristics of the structural face[6]. Because the surface topography mainly characterized the surface roughness, the profile curves of the rough surface of 4 structural faces in Fig.1 gained along the creep shear direction by DU��s method[7] are shown in Fig.4 so as to probe into the influence of the surface roughness on the rheological characteristics of the structure face. In Fig.4 U(h) is the average rough angle of the structural face (see DU et al[7] about its computing method), a comprehensive parameter to reflect the roughness characteristics of the structural face. The larger its value was, the rougher the structural face was. It is evident in Fig.4 that the average rough angle of 4 structural faces are U2(h), U5(h), U3(h) and U4(h) respectively, in turn from small to large value. Based on Table 1 and Fig.4, the relative curves between the average rough angle and the mechanical parameter values of the multiple model about each structural face were gained in Fig.5, where the regressive equations between them were also shown. Some important conclusions were drawn as follows.
1) Parameter GH value increased as U value rose and there existed the stronger linear relationship between them. The regressive equation between them was built as below:
GH = 467.51U-49.875 1 (3)
Its regressive relative coefficient r was 0.959 8. Because parameter GH reflected the capacity of the shear elastic deformation of the material, the larger the average rough angle of the structural face, the rougher the surface of the structural face, the smaller the instantaneous elastic deformation produced in the course of the structural face creep. The relationship between them was easy to understand if a little asperity in the rough surface of the structural face would be regarded as a micro-spring and then many little asperities scattering on the rough surface would take action as many micro-springs in parallel connection.
Table 1 Mechanical parameters of multiple models of all structural faces
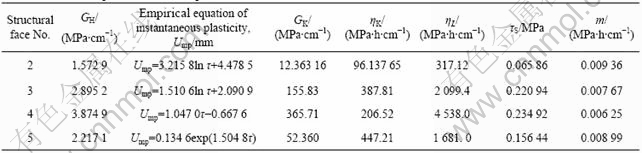
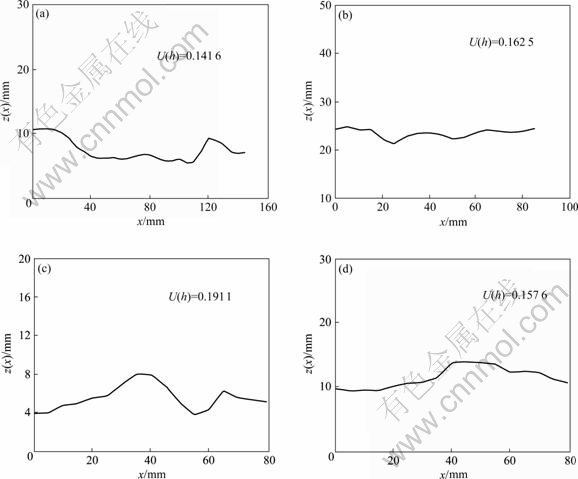
Fig.4 Roughness profile curves of all structural faces gained by actual measurement: (a) No.2 structural face; (b) No.3 structural face; (c) No.4 structural face; (d) No.5 structural face
2) Parameter GK value increased as U value rose and they were basically linearly related. The regressive equation between them was built as follows:
GK = 7.467 0��104U-1.072 1��104 (4)
Its regressive relative coefficient r was 0.949 3. For parameter GK, it had something to do with the ultimate stable value of the visco-elastic deformation of the structural face, and under the same shear stress, the larger the GK value, the smaller the ultimate stable value of the visco-elastic deformation. It was obvious that as the average rough angle U of the structural face increased, the ultimate stable value of the visco-elastic deformation would decrease when the structural face crept, namely the visco-elastic deformation capacity would become weak. In addition parameter ��K would not be discussed here because its variation principle along with the variation of U value is not evident. Because the visco-elastic deformation of the structural face resulted in reality from the common force-bearing deformation of many little asperities on the structural face, the surface of the structural face was rougher and more uneven; there were more little asperities on the structural face so that its visco-elastic deformation capacity became weak.
3) Parameter ��L value also increased as U value rose and there existed a stronger linear relationship between them. The regressive equation between them was built as follows:
��L=8.527 3��105U-1.175 8��105 (5)
Its regressive relative coefficient r was 0.999 9. Because parameter ��L reflected the capacity of the visco-plasticity deformation of the structural face, the larger the value was, the smaller the visco-plasticity deformation of the structural face was under the same shear creep stress. So it was obvious that the increase of the roughness of the structural face would lower its visco-plasticity creep deformation capacity. Because the visco-plasticity creep deformation was resulted from the shear destroy of some little asperities or the slope-climbing displacement along the little bumps on the structural face, the rougher the surface was and the more the little asperities were on the
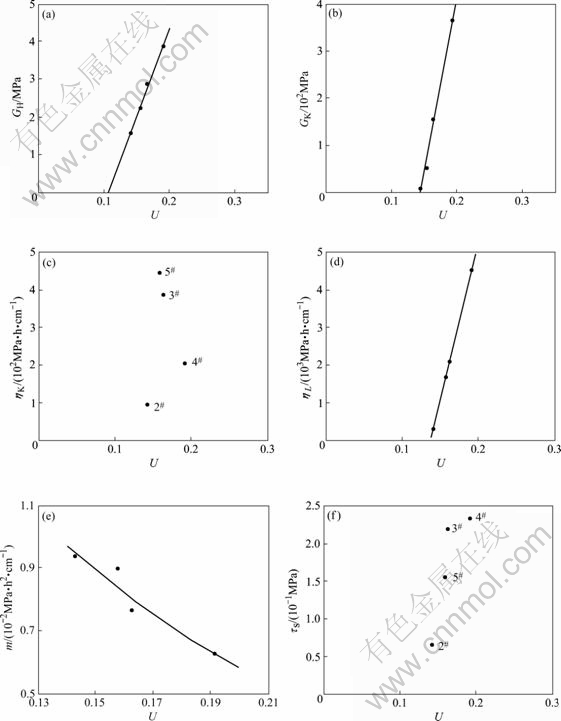
Fig.5 Relationships between average rough angle U and parameter values of multiple model of all structural faces: (a) Parameter GH of H body; (b) Parameter GK of K body; (c) Parameter ��K of K body; (d) Parameter ��L of N body; (e) Parameter m of NN body; (f) Parameter ��S of S body
4) Parameter m value decreased as U value rose and there existed the exponential function relationship between them. The regressive equation between them was built as follows:
m=0.321 1 exp(-8.538 8U) (6)
Its regressive relative coefficient r was 0.922 5. Because parameter m reflected the accelerated increasing capacity of the visco-plasticity deformation when the shear creep stress exerted on the structural face went beyond its long-term strength so as to result in the accelerated creep, the smaller the value m was, the more quickly the accelerated creep deformation increased and the shorter the arriving time of the creep destroy was. It was thus clear that the rougher the structural surface was, the higher the creep speed increased during the accelerated creep was and the more quickly the creep destroy arrived. This would lead to a very high lashing strength. To further explaining, the rougher the structural surface was, the more the deformation energy saved by the little asperities on the surface before the creep destroy, and then the more strongly the deformation energy would release so that the speed of the creep deformation increased more quickly than ever once the little asperities were destroyed by shear.
5) Parameter ��S value increased as U value rose, but the correlating principle between them did not. The larger the long-term strength ��S of the structural face was, the larger the shear creep stress to bring about the destroy of the structural face would be. Obviously, the rougher and more uneven the surface of the structural face was, the larger the shear stress to induce the creep destroy of the structural face would be. This was easy to understand, considering that the more and larger the little asperities on the surface were, the more difficult the shear destroy of the little asperities and the occurring of the slope-climbing deformation would be.
4 Conclusions
1) The creep deformation of the structural face contains many components of the instantaneous elastic, instantaneous plastic, visco-elastic and visco-plastic deformation. The instantaneous deformation will be far larger than the viscous deformation under no too high shear stress level. At this time the creep deformation of the structural surface will only be composed of two creep phases, the decelerating creep and constant creep, which will last for a very long time owing to its very low deformation speed. When the shear stress rises to go beyond certain specified valve value, the creep deformation of the structural surface will rapidly develop into destroy, which does not show the usual characteristic of three creep phases. The specified valve value will be regarded as the creep long-term strength of the structural surface that is only used to indicate whether the accelerated creep destroy will appear. These constitutive mechanical characteristics of the structure face creep can be described by the new multiple rheological component models put forward as above.
2) The values of the parameters of the creep constitutive model are different for different structural surfaces, which show the obvious surface roughness effect. Constitutive parameters of GH, GK and ��L are positively linearly correlative to the surface roughness. Parameter m is negative exponential function correlation with the surface roughness. And then the long-term strength ��S is positively correlative to the surface roughness. Considering the creep deformation mechanism the surface roughness effect can be explained by the creep deformation resulted from the shear deformation and destroy of the little asperities or bumps on the rough surface of the structural face or the slope-climbing movement along the little asperities.
3) Due to the low strength of the rock block on two sides of the structural face in soft rock, the small asperities on the rough surface of the structural surface can be destroyed by shear in the course of the pressure-shear creep so that during the initial stage of the structural surface creep there appear the clear ��step�� phenomena. Thus there are two action mechanisms in the creep course of the structural surface of the soft rock, which are the friction dragging action and the asperity resistance action. The asperity resistance action will play an important role in the initial stage of the creep deformation, and then when the small asperities are sheared into fracture, the friction dragging action will take main action. When the external shear stress increases to surmount the friction dragging action, the accelerated creep destroy will suddenly happen.
References
[1] LING Xian-chang, CAI De-suo. Rock mass mechanics [M]. Haerbing: Haerbing Technology University Press, 2002. (in Chinese)
[2] DING Xiu-li, LIU Jian, LIU Xiong-zhen. Experimental study on creep behaviors of hard structural plane in TGP��s permanent lock regions [J]. Journal of Yangtze River Scientific Research Institute, 2000, 17(4): 30-33. (in Chinese)
[3] SHEN Ming-rong, ZHU Gen-qiao. Testing study on creep characteristic of regularly dentate discontinuity [J]. Chinese Journal of Rock Mechanics and Engineering, 2004, 23(2): 223-226. (in Chinese)
[4] CHEN Yuan-jiang, PAN Chang-liang, CAO Ping, WANG Wen-xing. A new mechanical model for soft rock rheology [J]. Rock Soil Mechanics, 2003, 24(2): 209-214. (in Chinese)
[5] DENG Rong-ming, LU Hao-liang, SUN Jun. Nolinear rheology analysis in soft soil engineering [J]. Chinese Jounal of Geotechnical Engineering, 1996, 18(5): 1-13. (in Chinese)
[6] DU Shi-gui. Engineering characteristics of the structural face in rock mass [M]. Beijing: Earthquake Press, 1999. (in Chinese)
[7] DU Shou-ji, SUN Jun, TETSURO E, JIANG Yu-jing. Relation of surfaces roughness and shear strength of rock joints [J]. Journal of Tongji University, 1999, 27(4): 379-383. (in Chinese)
[8] CHEN Yuan-jiang. Study on the rheological constitutive model of rock and its intelligent identification [D]. Changsha: Central South University, 2003. (in Chinese)
[9] MARANIMI E. Creep behavior of a weak rock: Experimental characterization [J]. Int J Rock Mech & Min Sci, 1999, 36(3): 127-138.
[10] YANG Z Y, CHEN J M, HUANG T H. Effect of joint sets on the strength and deformation of rock mass models [J]. Int J Rock Mech & Min Sci, 1998, 35(1): 75-84.
Foundation item: Projects(50774093, 50490274) supported by the National Natural Science Foundation of China
Received date: 2008-06-25; Accepted date: 2008-08-05
Corresponding author: CHEN Yuan-jiang, Associate Professor, PhD; Tel: +86-731-8879612; E-mail: yuanjiang_chen@126.com
