

J. Cent. South Univ. (2020) 27: 1572-1586
DOI: https://doi.org/10.1007/s11771-020-4391-1

Temperature field evolution and heat transfer during continual local induction cladding
LIU Si-yu(��˼��)1, 2, QIN Xun-peng(��ѵ��)1, 2, ZHANG Jin-peng(�Ž���)1, 2, ZHAN Jun(ղ��)3
1. Hubei Key Laboratory of Advanced Technology for Automotive Components, Wuhan University of Technology, Wuhan 430070, China;
2. Hubei Collaborative Innovation Center for Automotive Components Technology, Wuhan 430070, China;
3. Hubei Sanhuan Intelligent Technology Co., Ltd., Wuhan 430074, China
 Central South University Press and Springer-Verlag GmbH Germany, part of Springer Nature 2020
Abstract:
The evolution of temperature field of the continual motion induction cladding and the depth of heat affected zone are studied in this study. A three-dimensional finite element model for the point type continual induction cladding is established to investigate temperature distributions of fixed and motion induction cladding modes. The novel inductor is designed for cladding of curved surfaces. The modeling reliability is verified by the temperature measurements. The influence of process parameters on the maximum temperature and the generation and transfer of heat are studied. Quantitative calculation is performed to its melting rate to verify the temperature distribution and microstructures. The results show that a good metallurgical bond can be formed between the cladding layer and substrate. The melting rate gradually falls from the top of the cladding layer to the substrate, and the grain size in the substrate gradually rises. The heat affected zone is relatively small compared to integral heating.
Key words:
profile repair; induction cladding; continual motion; temperature field evolution; heat transfer��
Cite this article as:
LIU Si-yu, QIN Xun-peng, ZHANG Jin-peng, ZHAN Jun. Temperature field evolution and heat transfer during continual local induction cladding [J]. Journal of Central South University, 2020, 27(5): 1572-1586.
DOI:https://dx.doi.org/https://doi.org/10.1007/s11771-020-4391-11 Introduction
High-frequency induction cladding is a process to heat alloy powder in the prefabricated layers with different compositions, magnetic permeabilities by means of the electromagnetic induction eddy current so that the melted alloy powder and surface of the workpiece substrate may be metallurgically bonded and a cladding layer with better performances shall be obtained [1]. The three- dimensional point type continual induction cladding, which is different from the traditional induction cladding processes for only performance of heating plane or cylindrical substrates, may be utilized to perform local continual cladding of three- dimensional complex space faces, and it is a new process for local repairing of curved parts [2]. The current methods for preparing composite coatings primarily include oxyacetylene flame cladding, arc spraying, induction cladding, laser cladding, laser induction composite cladding and plasma cladding [3-5]. Moreover, the induction cladding technology takes advantages of internal heat source heating, fast heating rate, high efficiency, refined grain structure under the electromagnetic stirring effects,low equipment costs, easy recovery and modification of sizes of single-piece small batch workpieces [6] .
The induction cladding process is involved in complicatedly changing temperature and electromagnetic fields. The microstructure of cladding layer is greatly related to its temperature distribution. Unfortunately, the molten pool has too short service life and the temperature distribution of the molten pool cannot be measured in real time during the induction cladding process. Thus, it is necessary to use a numerical simulation method to study the continual induction cladding temperature distribution and heat transfer.
By now, numerous studies have been conducted to calculate the temperature field in induction cladding or induction hardening and to investigate the mechanical behaviors of coatings and microstructure. LI et al [7] presented a numerical model of induction heating process for the shaft work-piece of 45 steel. The reliability of the model was validated and a set of modeling method was proposed. GAO et al [8] investigated the effect of the magnetizer geometry on temperature uniformity, heating rate and obtained the best shape of magnetizer by simulation of induction heating process. ZHU et al [9] designed two different spot inductors in order to contrast the temperature uniformity and heating rate. And they found that the heating performance of vertically aligned spot inductor is better than that of horizontally aligned spot inductor. CHEN et al [10] obtained NiCrBSi alloy coatings through three- dimensional continual local induction cladding. The microstructure, microhardness, cladding temperature and wear resistance of the coatings were characterized and the phenomenon of preferred orientation was studied. SANTHANAKRISHNAN et al [11] built an experimentally based on the thermokinetic hardening model. The cooling rate, temperature gradient and rate of solidification were calculated to predict temperature history and microstructure. HOMBERG et al [12] built a model for induction hardening of gears and studied the initial boundary value problem by means of a Schauder fixed point argument. However, some problems should be pointed out for study on temperature field simulation of induction cladding processing. Firstly, the structure of the conventional inductor used in induction cladding was simple, which could only be used to clad on cylindrical or plane surface. The novel inductor was made of twisted coils that was suitable for complicated surface local cladding, which also increases the complexity of temperature field simulation models. Secondly, the inductor was usually fixed in the conventional study on temperature field simulation of induction cladding. The temperature distribution and the requirements of inductor heating performance was completely different during continual induction cladding.
The temperature distribution significantly affects the microstructure and it is of great significance to the efficiency and quality of cladding. An inductor based on local continual motion induction cladding was designed and a three-dimensional continual local induction cladding (3D-CLIC) finite element model was established to study the temperature distribution and heat transfer, and to compare temperature distributions between fixed and continual induction claddings. Moreover, effects of process parameters on the maximum temperature were studied and the heat generation and transfer mode of this new process was discussed. The simulation results were verified by actual temperature measurement and microstructure observation. The experimental devices were utilized to locally repair space complex surfaces such as failure complex surfaces of large car body moulds and so on. It has more clear engineering application values.
2 Establishment of finite element model
2.1 Design of new inductor
A CLIC inductor in Figure 1 is designed to improve the heating temperature and the heating rate, which is made up of 8 mm��8 mm square copper tubes in the parallel arrangement for higher temperature. The cooling water flows in copper pipes. The magnetizer is primarily designed to reduce the magnetic reluctance and create a notch effect for concentration and guidance of magnetic fluxes. While a large alternating current is applied to the inductor, the eddy current may be induced into the workpiece to generate heat and achieve induction cladding. The maximum temperature of the inductor may be up to 1600 ��C to achieve cladding for coatings reinforced by means of addition of WC and other hardening constituents. Moreover, sizes of the inductor are small for performance of CLIC of complex curved surfaces and locally repairing space complex surfaces such as failure complex surfaces of large car body moulds and so on.
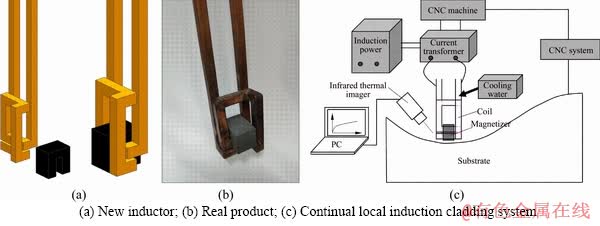
Figure 1 Geometric model of:
2.2 Description of eddy current field model
The heat of melting of the induction cladding comes from the Joule heat due to current induction and analysis of the induced eddy current of substrate is a major part for analysis of any induction cladding process. First, the Maxwell��s equations of the classical electromagnetic theory were introduced.
Gauss��law:
V��D=��1 (1)
Gauss��magnetic law:
V��B=0 (2)
Faraday��s law of electromagnetic induction:
 (3)
(3)
Ampere��s circuital law:
 (4)
(4)
where D is the electric displacement vector, C/m2; B is the magnetic flux density, N/(A��m); E is the electric field intensity, N/C; H is the magnetic field intensity, A/m; J is the electric current density, A/m2; ��1 is the electric charge density, C/m2.
In the above formula, displacement current density  D/t is not the main cause of joule heat, and electric current density J is far greater than the displacement current density. Therefore, D/t can be negligible in the equations. Maxwell��s equations are converted to the following equations:
 (5)
(5)
 (6)
(6)
 (7)
(7)
In this process, the auxiliary coordination equations are as follows:
 (8)
(8)
 (9)
(9)
where �� is magnetic permeability; �� is electrical conductivity.
The magnetic vector potential A and electric scalar potential �� are introduced, and the following equations can be obtained:
 (10)
(10)
 (11)
(11)
Eqs. (10) and (11) can make both Eqs. (5) and (6) ture, so combined with Eqs. (7)-(11), the governing equation of eddy current field in continual induction cladding process can be obtained as follows:
 (12)
(12)
2.3 Description of temperature field model
The heating transfer mode for the substrate is the non-linear transient heat conduction. The following equation is obtained in accordance with the Fourier law for the classical heat conduction:
 (13)
(13)
where ��2 is material density, kg/m3; C is specific heat capacity, J/(kg����C); k is the thermal conductivity coefficient, W/(m����C); Q is internal heat due to the induction eddy current, J.
The boundary condition of the workpiece temperature can be described as normal derivative. According to the first law of thermodynamics, the thermal convection and radiation governing equation between workpiece surfaces and the air can be described as follows:
 (14)
(14)
where n is the outward normal vector on the boundary; Tair is the temperature of ambient air, expressed as Tair(x, y, z); h is the heat-convection coefficient, and h=50 W/(m2��K); ��emi is the material emissivity, and ��emi=0.68; ��b is the Stefan- Boltzmann constant, W/(m2��K4).
2.4 Geometrical model and mesh generation
The induction cladding geometric model shown in Figure 2 is made up of a substrate, a cladding coating, an air layer, induction coils and a magnetizer. The inductor moves under the traction of the machine tool to continually move the induction cladding. As for analysis of this model in ANSYS, the meshing results are shown in Figure 3. Figure 3(a) presents meshing of the inductor and substrate with the air layer removed, where the induction coil and the magnetizer are meshed with 1 mm triangular meshes. Because the substrate surface is heated significantly due to the skin effect of high-frequency induction heating, the substrate surface temperature is much higher than its internal temperature, and its surface temperature difference is large, so the heat exchange shall be more intensive. Thus, the progressively downwards thinned non-uniform rectangular meshes are applied to divide the substrate unit. In contrast, finer uniform meshes are applied to the surface coatings. Meshing of the outer air layer is shown in Figure 3(b), where the closer it is to the coating, the more intensive the heat exchange between air and the coating is. Thus, the progressively downwards thinned non-uniform meshes are utilized to divide the air layer.
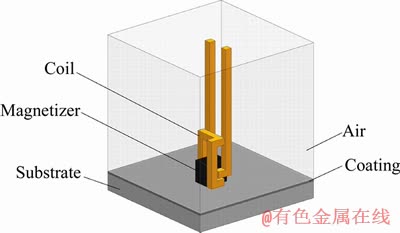
Figure 2 Geometric model of point type continual induction cladding
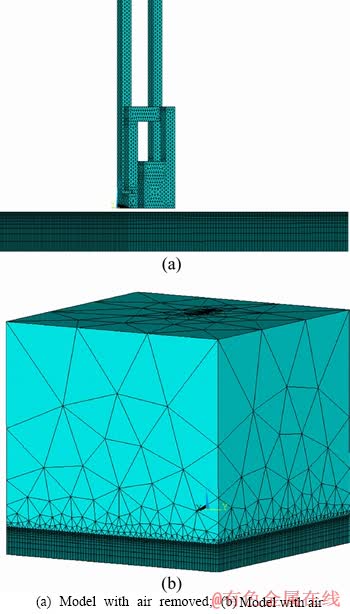
Figure 3 Finite element model of point type continual induction cladding:
In the geometric model, the substrate is made of #45 steel. The thermodynamic and electromagnetic properties for simulation calculation are shown in Figure 4 [13]. The coatings are Ni60A alloy powder, whose Curie point temperature of demagnetization is 200 ��C and which are heated up rapidly due to the skin effect of current during the induction cladding period, so the Curie point may be easily achieved to perform demagnetization. Thus, the heat conduction of Ni60A is only taken into account during the heating process of induction cladding in the simulation calculation. Figure 5 presents the thermal conductivity and specific heat capacity required for heat conduction [14].
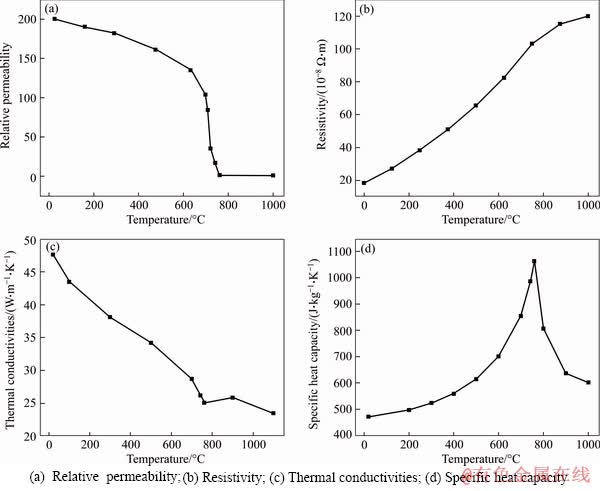
Figure 4 Thermal and electromagnetic property curves with temperature of 45 steel:
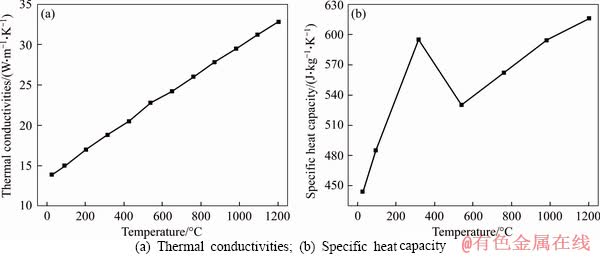
Figure 5 Thermal property curves with temperature of Ni60A alloy:
3 Experimental validation
The experimental devices in Figure 6 are utilized to verify the accuracy of the simulation calculation, which includes an induction power supply, current transformer, a spot inductor, substrate, an infrared temperature measurement system and a machine tool control system. The super-audio series induction heating device (the rated power is 50 kW and oscillation frequency is 10-40 kHz) is equipped. WC particle hardening constituent is added into the Ni60A alloy powder in accordance with the mass ratio of 15% and the PVA powder with the mass ratio of 2% is added as the binder. The chemical composition of the Ni60A is listed in Table 1. Water is added to stir and grind uniformly. The substrate is polished and cleaned with alcohol. Then, the prepared alloy powder is coated on its groove so the pre-formed layer and the substrate shall be flushed. It is coated again after being dried in a drying box at 70 ��C for 30 min. Then, it is dried in the drying box at 200 ��C for 2 h. The gap between the substrate and the inductor is adjusted to be 1 mm. The speed (V) of the testing machine is set as a constant to move 50 mm.
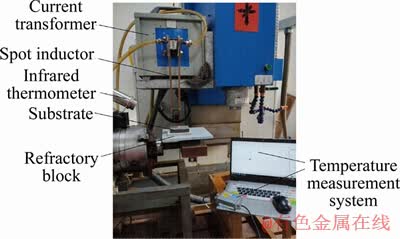
Figure 6 Experimental setup of point type induction cladding
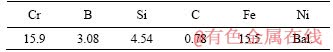
Table 1 Nominal chemical composition of Ni60A (wt%)
4 Results and discussion
4.1 Temperature evolution and model validation of fixed induction cladding
The simulation results of heating effects of the new inductor are shown in Figure 7 where the projected inductor is made up of the magnetizer and coils and five detection points are evenly distributed along the positive direction of the Y-axis from the highest temperature point P1. Point B in the corner where the infrared thermometer which is not blocked by the inductor is selected for the purpose of verifying the temperature. The temperature distribution cloud picture is the results of the fixed induction cladding at the time of 10 s when the temperature of the center point P1 may be up to 1600 ��C. Because Ni60A alloy powder may be melted among 960-1040 ��C, the region where the temperature is greater than 1000 ��C is called the effective cladding region. The middle region of the overlapped projected magnetizer and coils in Figure 7 is defined as high temperature region which is an effective cladding region. Figure 8 shows the time-varying temperatures of uniformly distributed points P1-P5, where the temperature rising rate and the highest temperature rises along with the spacing closer to the heating center and the temperature rises gently due to the effect of Curie point while the temperature rises rapidly to a constant position. It is verified that faster heating may be achieved by the inductor, and the temperature requirements may be satisfied. In addition, the heating performance is good.
The position of point B in Figure 7 is easy to find, and point B is not covered by the inductor. The infrared thermometer can record the temperature data of the whole cladding process. The point covered by the inductor can only record the temperature when the inductor is lifted after the cladding is completed. Therefore, point B is selected for temperature verification, and the result is shown in Figure 9. Comparison of simulated and measured temperatures of point B is presented in Figure 9 which indicates that the measured temperatures are lower during the initial stage of heating (0-4 s) primarily due to a necessary process for generation of eddy current in the substrate from the induction power supply. The range of our infrared thermometer is 385-1600 ��C. On the other hand, the final current is a direct input for simulation so its measurements of heating rate should be lower. The measured and simulated results of the middle stage of heating (4-7 s) are in good agreement (minimum error: 0.12%), which proves the reliability of the experimental model. The measured results in the late heating stage (7- 10 s) are lower than the simulated ones, whose maximum error is 6.1%, mainly because the heat conduction dominates the heat transfer in the simulation. Radiation and heat convection actually contribute to the heat transfer. Besides, the substrate may be regarded as infinite space so the eddy current loss and heat dissipation should be larger. Thus, the measured temperatures are lower. In summary, the average measurement error is 2.4%, and the reliability of the simulation model is verified, which is also reflected from the microstructure of the samples.
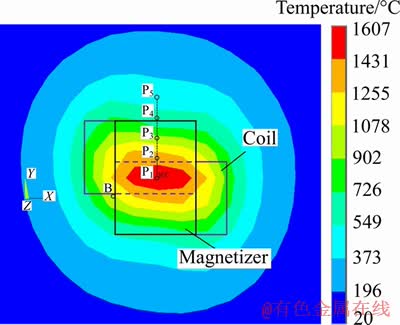
Figure 7 Temperature distribution with fixed induction cladding for 10 s
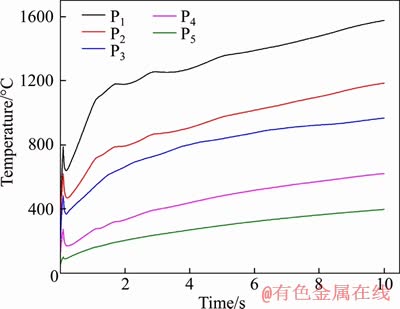
Figure 8 Temperature of a specified point vs. time with fixed induction cladding for 10 s
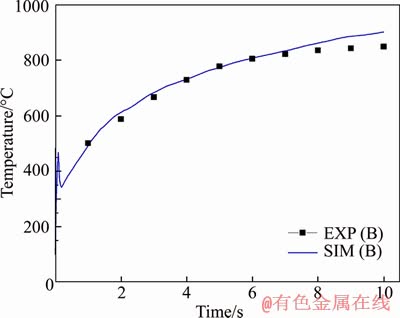
Figure 9 Comparison of simulated and measured temperatures of point B
4.2 Temperature distribution of continual motion induction cladding
Figure 10 is a temperature distribution evolution diagram of continual motion induction cladding. The inductor moves at 1 mm/s and the applied current is 1200 A. The cladding coating gradually forms as the inductor moves forward. It can be seen from Figure 10 that the maximum temperature can reach 1000 ��C when being heated to 1 s. The maximum temperature finally reaches 1373 ��C at 20 s. The requirements of induction cladding of nickel-based alloy powder can be met while the inductor moves continuously. On the other hand, in comparison with the maximum temperature of the fixed induction cladding in Figure 7, the maximum temperature of the motion induction cladding is lower. Thus, there should be a maximum speed of the inductor to ensure that alloy powder can be melted during the induction cladding period. The temperature distribution area gradually becomes larger along with extension of heating, and eventually reach the edge of the substrate and enlarge the heat affected region. This is also a disadvantage of induction cladding compared with laser cladding.
In Figure 10(a), the temperature field has just been established, and the maximum temperature is nearly 900 ��C, indicating that induction heating has the characteristics of heating up rapidly. The high temperature region is in the center and decreases outward. The affected heat region is large. The temperature nephogram shows a saddle shape due to the special structure of the inductor. In Figure 10(b), the maximum temperature is further increased, and the saddle shape evolves into the feature of big at both ends and small in the middle due to the additional heating at both ends. In Figures 10(c) and (d), the temperature nephogram shows cocoon-shaped. The cladding layer begins to melt in large area with the highest temperature above 1100 ��C. As the heating time goes on, the temperature nephograms of Figures 10(e) and (f) extend to the edge of the substrate. The high temperature region that can be used for cladding is larger, so the cladding layer will be wider with the movement of the inductor.
Figure 11 shows the projection of the inductor in the substrate and Figures 10 reflects that the inductor moves from the solid projection position to the dotted position through 20 s. The high temperature region of the overlapped projections of the magnetizer and coils is called as Region 1, whose center point A1 moves to A5 after 20 s. A1 to A5 points are evenly distributed. The time-varying temperature curves are shown in Figure 12, which indicates the temperature evolution trends to rise to the peak at first and then fall. The points that are further away from the starting point have lower temperature rising rate, but the higher temperature rising rate the maximum temperature can be achieved. Because these points can be preheated longer before the inductor moves to these points. This is different from the temperature change of the fixed induction cladding.
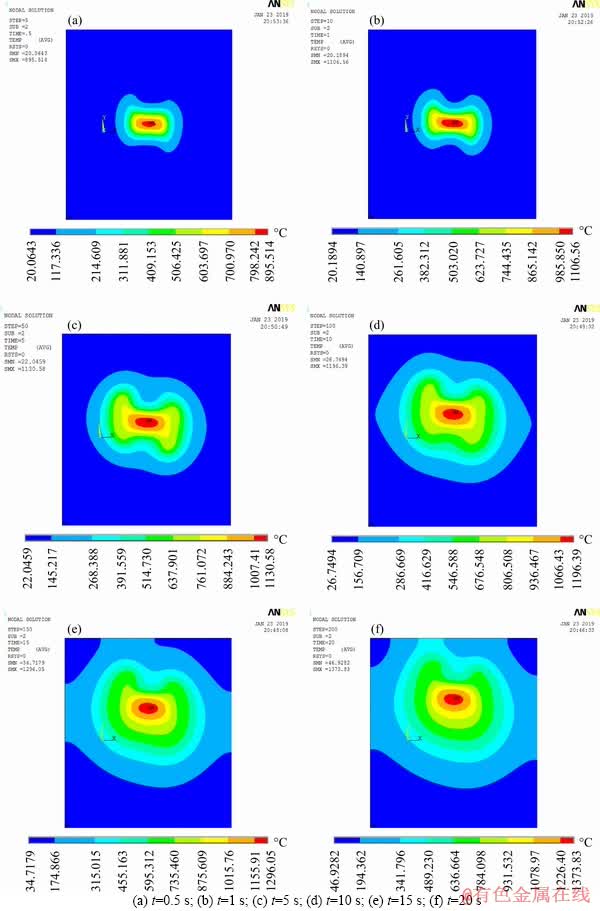
Figure 10 Temperature field evolution of continual motion induction cladding for moving speed of 1 mm/s with time:
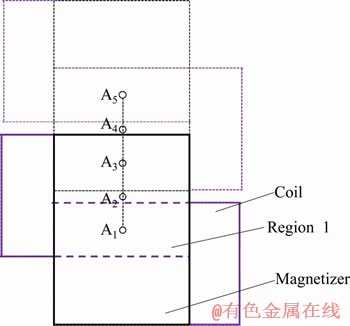
Figure 11 Path of inductor moving on substrate for 20 s
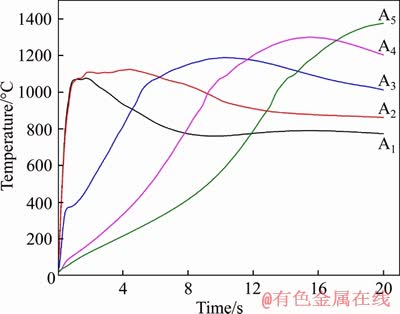
Figure 12 Temperature of each point vs. time in motion direction of inductor
4.3 Effects of main process parameters on the maximum temperature
For verifying effects of various process parameters on the maximum temperature, a FE model with different parameters was established to simulate evolution of the temperature field. The primary process parameters include the applied current, frequency and moving speed of the inductor.
Figure 13 shows the maximum temperature evolution of the molten pool while the applied current and the moving speed of the inductor change. The moving speed of inductor is 0.5 mm/s in Figure 13(a). It can be seen from Figure 13(a) that the temperature rises sharply within 1 s and then grows gently. As for each time point, the larger the applied current is, the higher the temperature is. Figure 13(b) presents similar rules which reflect that the effects of the applied current on the maximum temperature of the cladding coating shall be remarkable. And the higher the applied current is, the more significantly the maximum temperature is affected. Figure 14 shows the maximum temperature of the coating for the continual induction cladding within 8 s under various eddy current frequencies while the moving speed of the inductor remains 2 mm/s, which indicates that the higher the eddy current frequency is, the more the temperature is. And the rules are similar while the current changes. The evolution of the maximum temperature of a fixed point in the substrate after induction cladding for 8 s while the moving speed of the inductor changes is shown in Figure 15 which indicates that the smaller the moving speed of the inductor is, the higher the temperature of the selected point is and the difference shall be more intensive while the applied current grows.
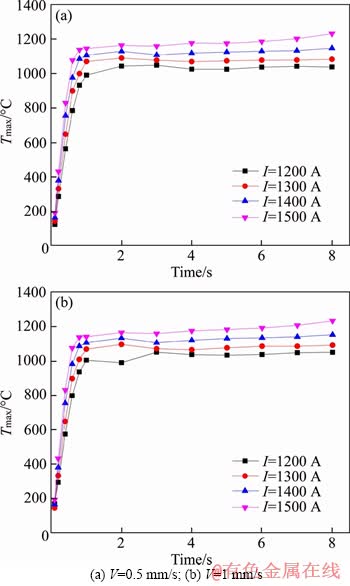
Figure 13 Performance of heating time vs. applied current at scanning speed:
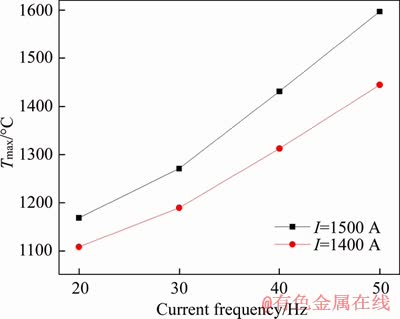
Figure 14 The maximum temperature of coating vs. frequency of induction cladding
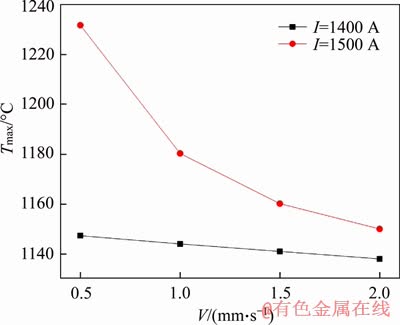
Figure 15 The maximum temperature of fixed point in substrate vs. induction cladding rate
4.4 Induction cladding heat generation and transfer pathways
Figure 16 shows the evolution of the temperature distribution of the highest temperature cross section of the substrate along with extension of the heating period, which indicates that the symmetry of the flat temperature distribution at the beginning of heating. Afterwards, the interior of the substrate is heated gradually. The high temperature region (red) becomes rounded from the flat shape and heat is initially generated on the surface of the substrate and transferred to the coating. Heat is transferred partially from the high temperature region into the coating after being heated for 1 s and then completely transferred to the coating. The relative permeability of the coating material decreases sharply at the beginning stage while the heating temperature is more than the Curie point [14]. Therefore, the eddy current and Joule heat is mainly generated on the surface of the substrate and transferred to the coating in the form of heat conduction. Such case indicates that the substrate is heated internally while the coating is molten externally. This phenomenon is unique to induction cladding so that it can be used to preheat before laser cladding [15]. The electromagnetic stirring during induction cladding can refine the grain.
4.5 Verification of microstructures and temperature distribution based on melting rate
Melting rate refers to the depth of melting layer per unit time in the process of induction cladding, which is determined by the heating performance of inductor and the material properties of cladding layer. The melting rate directly affects the moving speed of the inductor along the cladding to ensure that the cladding layer reaches the designed depth.
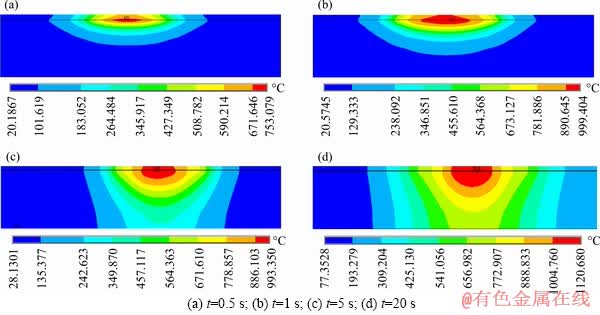
Figure 16 Temperature evolution of substrate section with time:
Inversion temperatures AC1 and AC3 are of great significance, which represent the initial and final temperatures of austenitization while a kind of material is heated, respectively. For quantitatively calculating the temperature gradient G, heating rate ��, and melting rate M at each point of the cross section in Figure 16, the following equation is defined [16]:
 (15)
(15)
 (16)
(16)
 (17)
(17)
where Tmax represents the maximum temperature of the point; AC1 represents the initial temperature of austenitization, which is 733 ��C; D represents the distance from the surface; DA represents the spacing between the point where the temperature is AC1 and the surface; t represents the necessary time for performance of heating; and tA represents the necessary time for achievement of AC1.
Figure 17 is the schematic diagram illustrating the above formula. The distance D in Figure 17(a) is obtained by measuring the spacing of grid nodes in the temperature simulation diagram. The maximum temperature of each point can be found in the extracted temperature data, and the corresponding node with the maximum temperature of AC1 can be found. DA is obtained by measuring the grid spacing between the node and the top of the cladding layer. Figure 17(b) shows the temperature curve of measured point obtained by simulation. The time tA corresponding to AC1 and the time t corresponding to Tmax can be found from the temperature data, so as to calculate G and ��.
Figure 18 shows the temperature distribution on the cross section compared to that for the sample. Those series of points in the left cloud are the reference ones the extraction temperature. On the other hand, those series of points in the right sample are the reference points for the observed microstructure. The calculations based on the above equation are presented in Figure 19. It presents the distribution of the highest temperature at each point on the cross-section which may be divided into a cladding zone A, a dilution zone B and a heat affected zone C [17]. Moreover, Figure 19(a) indicates that the temperature rises while the cladding zone A approaches the substrate and the coating, and heat is indeed generated in the interface. Coating powder and the molten substrate are fused in the dilution zone B, where the temperature can be crucial to whether the metallurgical bonding may be formed by the induction cladding process. The width of the heat affected zone C is the largest and the entire substrate is penetrated. Natural air cooling after heating is equivalent to local normalization of workpieces so that their surface whose original performances are better may be adversely affected. Figures 19(b) and (c) presents the calculated temperature gradient and heating rate, respectively, which indicate that the temperature gradient is parabolic and maximum at the interface. The heating rate of the cladding layer A is remarkably higher than that of any other zone and remains more stable. Figure 19(d) shows the calculations which indicates that the solidification rate gradually decreases from the coating surface to the substrate.
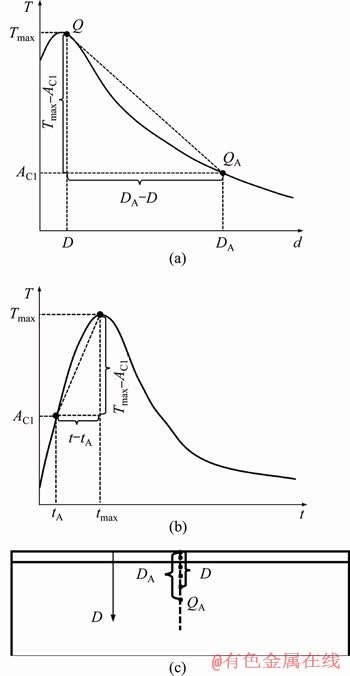
Figure 17 Schematic figure of temperature gradient G calculation (a), heating rate �� calculation (b), and temperature measured locations (c)
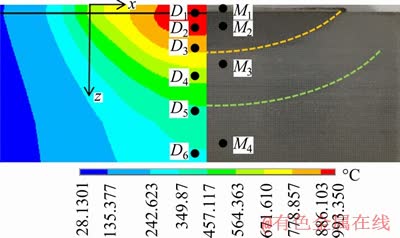
Figure 18 Comparison of temperature distribution along cross-section and experimental results
For investigation of effects of different heating rates and melting rates on the microstructures of the cladding layer and the substrate, Figure 20 shows the relationship between the microstructure and the location in the section of the moving induction cladding sample. The sample moves by 1 mm/s in the inductor whose input power is 50 kW. It can be seen from Figure 19(d) that the melting rate decreases successively from the upper part of the cladding layer to the lower part, and there is a sudden change at the interface, which sharply reduces in the substrate. Corresponding to Figure 20, the grains in the metallographic structure tend to be coarser from top to bottom part.Figure 20(a) presents the microstructure of the cladding layer under the electron microscope (amplification factor: 200) after it has been eroded with aqua regia for 10 s. Point M1 represents the junction point between the coating and the substrate, where the temperature gradient and the heating rate are the maximum, ensuring that the coated alloy powder can be melted. Moreover, the clear white band in the joint is due to the mutual diffusion of the Ni60A alloy powder and the substrate microstructure. It indicates that the induction cladding forms a substantial metallurgy bonding. The block microstructures are WC particles coated with melted Ni60A alloy powder, which can enhance the hardness and wear resistance of the cladding layer [18]. There are higher heating rate and melting rate in the cladding layer. Figure 20(a) is mainly composed of the fine dendrite structure mixed with cellular strengthening phase structure. Figure 20(b) shows the substrate microstructures close to the cladding layer. Figure 18 indicates that there are 3 well marked regions in the sample substrate after erosion with alcohol solution (concentration of nitric acid: 4%) due to their heating rates and temperatures are different. The temperature and melting rate are higher in a region closer to the cladding layer due to the heating effect; In contrast, the surface color is darkened and the corrosion stability goes bad. The melting rate in the substrate decreases sharply from top to bottom, indicating that it is less affected by induction heating. Figure 20(b) shows that the effect of induction heating is larger, and there is element diffusion in the upper and cladding layers so that the upper and lower metallographic structures are different. The growth of the melting rate may result in microstructures with finer grains while a lower melting rate may lead to coarser microstructures. As shown in Figures 20(b)-(d), the melting rate is getting smaller but the grain size rises gradually along with development towards the inside of the substrate. Figure 20(d) shows the microstructures at the lowermost part of the substrate under the electron microscope (amplification factor: 200), where grains are the largest in comparison with those of various points in the upper part. Moreover, the light white and gray-black microstructures are ferrite and pearlite, respectively. The original microstructures close to #45 steel are affected by heat but the substrate microstructures do not change significantly.
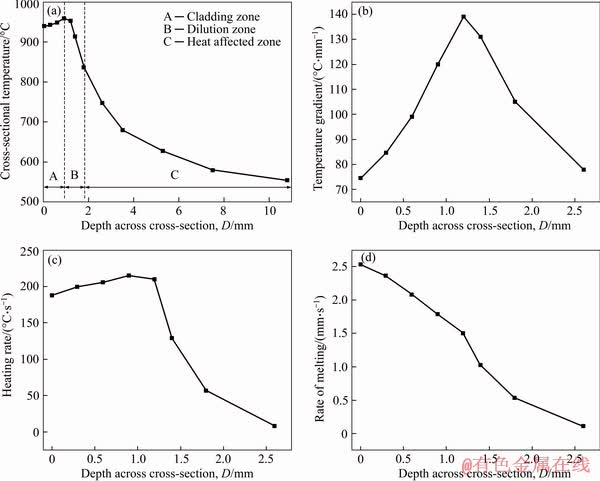
Figure 19 (a) Maximum temperature; (b) Temperature gradient; (c) Heating rate; (d) Melting rate of section vs. its depth
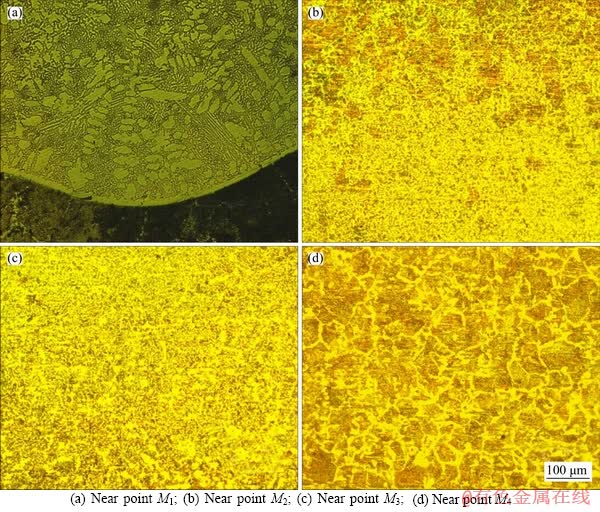
Figure 20 Microstructure of cladding layer and substrate:
5 Conclusions
An appropriate inductor for plane point induction cladding was designed in this study. Moreover, three-dimensional models for fixed induction cladding and continually moving local induction cladding were established to study temperature distributions of the cladding layer and the substrate, and effects of various process parameters on the maximum temperature. Numerical simulation and experimental measurements of temperatures and microstructures can lead to the following conclusions:
1) There is a well-marked white band between the cladding layer and substrate of the sample processed based on induction cladding by utilizing the inductor so that a strong metallurgical bond can be formed. A numerical model was established in this study to simulate the evolution of temperature by integrating the experimental verification.
2) Based on simulation comparison, the temperature of the fixed induction cladding peaks up to 1600 ��C after 10 s. In contrast, the maximum temperature of the induction cladding (speed:1 mm/s) is up to 1200 ��C after 10 s. Thus, the fixed induction cladding can reach the higher temperature and heating rate, and its heat distribution is more concentrated.
3) The penetration type heating method for the substrate ensures that the depth of heat penetration could be greater than the thickness of the substrate and the entire substrate can be affected by heat. The temperature gradient increases first and then decreases while the melting rate gradually falls from the top of the cladding layer to the substrate. Moreover, the size of grains in the substrate gradually grows. The interface between the cladding layer and the substrate has the highest temperature and heating rate.
References
[1] NAAR R, BAY F. Numerical optimisation for induction heat treatment processes [J]. Applied Mathematical Modelling, 2013, 37(4): 2074-2085. DOI: 10.1016/j.apm. 2012.04.058.
[2] GAO Kai, WANG Zhou, QIN Xun-peng, ZHU Sheng-xiao. Numerical analysis of 3D spot continual induction hardening on curved surface of AISI 1045 steel [J]. Journal of Central South University, 2016, 23(5): 1152-1162. DOI: 10.1007/ s11771-016-0365-8.
[3] FANG Jian-jun, LI Zhu-xin, SHI Yao-wu. Microstructure and properties of TiB2-containing coatings prepared by arc spraying [J]. Applied Surface Science, 2008, 254(13): 3849-3858. DOI: 10.1016/j.apsusc.2007.12.034.
[4] HAO Ming-zhong, SUN Yu-wen. A FEM model for simulating temperature field in coaxial laser cladding of TI6AL4V alloy using an inverse modeling approach [J]. International Journal of Heat and Mass Transfer, 2013, 64: 352-360. DOI: 10.1016/j.ijheatmasstransfer.2013.04.050.
[5] ZHOU Sheng-feng, ZHANG Tian-you, XIONG Zheng, DAI Xiao-qin, WU Chao, SHAO Zhi-shong. Investigation of Cu�CFe-based coating produced on copper alloy substrate by laser induction hybrid rapid cladding [J]. Optics & Laser Technology, 2014, 59: 131-136. DOI: 10.1016/j.optlastec. 2013.12.013.
[6] HAN Yi, WEN Huai-yu, YU En-lin. Study on electromagnetic heating process of heavy-duty sprockets with circular coils and profile coils [J]. Applied Thermal Engineering, 2016, 100: 861-868. DOI: 10.1016/ j.applthermaleng.2016.01.161.
[7] LI Cheng-kai, LIU Yan-cong, SHI Yong-jun, YI Peng, XIE Jiang-hao, MA Xiao-li, CUI Lan-fang. Modeling of high-frequency induction heating surface cladding process: numerical simulation, experimental measurement and validation [C]// Proceedings of the 6th International Asia Conference on Industrial Engineering and Management Innovation. Paris: Atlantis Press, 2016. DOI: 10.2991/978- 94-6239-148-2_74.
[8] GAO Kai, QIN Xun-peng, WANG Zhou, ZHU Sheng-xiao, GAN Zhong-ming. Effect of magnetizer geometry on the spot induction heating processc [J]. Journal of Materials Processing Technology, 2016, 231: 125-136. DOI: 10.1016/ j.jmatprotec.2015.12.028.
[9] ZHU Zhen-hua, QIN Xun-peng, GAO Kai, CHEN Xu-liang. Design and research on the spot inductor for obtaining local high temperature rapidly [J]. International Communications in Heat and Mass Transfer, 2018, 96: 122-129. DOI: 10.1016/j.icheatmasstransfer.2018.06.002.
[10] CHEN Xu-liang, QIN Xun-peng, ZHU Zhen-hua, GAO Kai. Microstructural evolution and wear properties of the continual local induction cladding NiCrBSi coatings [J]. Journal of Materials Processing Technology, 2018, 262: 257-268. DOI: 10.1016/j.jmatprotec.2018.05.034.
[11] SANTHANAKRISHNAN S, KONG F, KOVACEVIC R. An experimentally based thermo-kinetic hardening model for high power direct diode laser cladding [J]. Journal of Materials Processing Technology, 2011, 211(7): 1247-1259. DOI: 10.1016/j.jmatprotec.2011.02.006.
[12] HOMBERG D, PETZOLD T, ROCCA E. Analysis and simulations of multifrequency induction hardening [J]. Nonlinear Analysis: Real World Applications, 2015, 22: 84-97. DOI: 10.10 16/j.nonrwa.2014.07.007.
[13] MAO Yu-lian, LI Cheng-kai. Modeling and optimization of multi-dimension induction cladding model [J]. Modern Manufacturing Technology and Equipment, 2015(3): 1-4. DOI: 10.16107/ j.cnki.mmte.2015.0081. (in Chinese)
[14] SUN Rui, SHI Yong-jun, PEI Zheng-fu, LI Qi, WANG Rui-hai. Heat transfer and temperature distribution during high-frequency induction cladding of 45 steel plate [J]. Applied Thermal Engineering, 2018, 139: 1-10. DOI: 10.1016/j.ap plthermaleng.2018.04.100.
[15] BIDRON G, DOGHRI A, MALOT T, FOURNIER F. Reduction of the hot cracking sensitivity of CM-247LC superalloy processed by laser cladding using induction preheating [J]. Journal of Materials Processing Tech, 2020, 277: 116461. DOI: 10.1016/j.jmatprotec.2019.116461.
[16] LIU Hua-ming, LI Ming-bo, QIN Xun-peng, HUANG Song, HONG Feng. Numerical simulation and experimental analysis of wide-beam laser cladding [J]. The International Journal of Advanced Manufacturing Technology, 2019, 100(1-4): 237-249. DOI: 10.1007/s00170-018-2740-0.
[17] YU Jing, SONG Bo. Effects of heating time on the microstructure and properties of an induction cladding coating [J]. Results in Physics, 2018, 11: 212-218. DOI: 10.1016/j.rinp.2018.09.010.
[18] YU Jing, SONG Bo. Friction and wear behavior of a Ni-based alloy coating fabricated using a multistep induction cladding technique [J]. Results in Physics, 2018, 11: 105-111. DOI: 10.1016/j.rinp.2018.08. 049.
(Edited by ZHENG Yu-tong)
���ĵ���
�����ƶ��ֲ���Ӧ�۸������е��¶ȳ��ݱ����������
ժҪ�������о��������˶���Ӧ�۸�����¶ȳ��ݱ����Ӱ��������ȣ������˵�ʽ�����ƶ���Ӧ�۸�����ά����Ԫģ�����о��̶����ƶ���Ӧ�۸�ģ�͵��¶ȷֲ��������һ�������������۸����¸�Ӧ����ͨ���¶Ȳ�����֤��ģ�͵Ŀɿ��ԡ��о��˹��ղ���������¶ȵ�Ӱ��������IJ����봫�ݡ����ۻ����ʽ����˶�����������֤�¶ȵķֲ�������֯�Ĺ�ϵ������������۸��������֮����γ����õ�ұ���ϣ����۸��㶥���������ۻ��������ͣ������еľ����ߴ������������������ȣ������ƶ��ֲ���Ӧ�۸���Ӱ������Խ�С��
�ؼ��ʣ��������������ƶ���Ӧ�۸����¶ȳ��ݱ䣻��������
Foundation item: Project(51575415) supported by the National Natural Science Foundation of China; Project(2016CFA077) supported by the Natural Science Foundation of Hubei Province of China; Project(2018-YS-026) supported by the Excellent Dissertation Cultivation Funds of Wuhan University of Technology, China
Received date: 2019-08-05; Accepted date: 2020-02-25
Corresponding author: QIN Xun-peng, PhD, Professor; Tel: +86-13995509555; E-mail: qxp915@hotmail.com; ORCID: 0000-0001- 7656-3748
Abstract: The evolution of temperature field of the continual motion induction cladding and the depth of heat affected zone are studied in this study. A three-dimensional finite element model for the point type continual induction cladding is established to investigate temperature distributions of fixed and motion induction cladding modes. The novel inductor is designed for cladding of curved surfaces. The modeling reliability is verified by the temperature measurements. The influence of process parameters on the maximum temperature and the generation and transfer of heat are studied. Quantitative calculation is performed to its melting rate to verify the temperature distribution and microstructures. The results show that a good metallurgical bond can be formed between the cladding layer and substrate. The melting rate gradually falls from the top of the cladding layer to the substrate, and the grain size in the substrate gradually rises. The heat affected zone is relatively small compared to integral heating.
