
J. Cent. South Univ. (2012) 19: 1302-1310
DOI: 10.1007/s11771-012-1142-y![]()
Lifetime prediction for tantalum capacitors with multiple degradation measures and particle swarm optimization based grey model
HUANG Jiao-ying(���Ӣ), GAO Cheng(�߳�), CUI Wei(����), MEI Liang(÷��)
School of Reliability and System Engineering, Beihang University, Beijing 100191, China
? Central South University Press and Springer-Verlag Berlin Heidelberg 2012
Abstract:
A lifetime prediction method for high-reliability tantalum (Ta) capacitors was proposed, based on multiple degradation measures and grey model (GM). For analyzing performance degradation data, a two-parameter model based on GM was developed. In order to improve the prediction accuracy of the two-parameter model, parameter selection based on particle swarm optimization (PSO) was used. Then, the new PSO-GM(1, 2, w) optimization model was constructed, which was validated experimentally by conducting an accelerated testing on the Ta capacitors. The experiments were conducted at three different stress levels of 85, 120, and 145 ��. The results of two experiments were used in estimating the parameters. And the reliability of the Ta capacitors was estimated at the same stress conditions of the third experiment. The results indicate that the proposed method is valid and accurate.
Key words:
1 Introduction
High stability and reliability bring tantalum (Ta) capacitors many special applications, such as military, aerospace, and medical. They are typically used for decoupling and filtering in power supply lines of electronic circuits [1]. Ta capacitors manufactured according to military specifications are established as reliability components, thus positioning these parts among electronic components with the highest reliability characteristics. Still, failures of Ta capacitors do happen and when it occurs it might have catastrophic consequences for the system. In this regard, Ta capacitors can be considered as low failure rate parts with a high risk of application. To reduce this risk, a reliability prediction for Ta capacitors is necessary. The accuracy of any reliability prediction depends upon both the prediction methodology used and accurate knowledge of the product, generally including the structural architecture, material properties, fabrication process and product life cycle conditions [2-3].
For military-grade Ta capacitors, it is difficult to assess the reliability by using the traditional time-to- failure analysis method [4]. The performance of Ta capacitors deteriorates continuously over time (gradual degradation). The primary failure mode is soft degradation failure, and catastrophic failures rarely occur. In this situation, degradation analysis may be a more advisable alternative than traditional time-to-failure analysis.
Accelerated degradation testing (ADT) expedites product degradation by stressing the product beyond its normal use. To extrapolate the reliability of the product in use condition, the ADT requires a known functional link relating the harsh testing environment to the usual use environment. Practitioners are often faced with a great challenge to designate an explicit form of the stress-degradation relationship a priori in accelerated degradation models [5].
Degradation data may provide considerably more information about reliability than censored failure-time data (especially with few or no failures). And degradation analysis can also save time and cost in testing. In recent years, the studies of performance degradation have attracted many interests and efforts because the degradation measurements contain fairly credible, accurate and useful information about product reliability [4-8]. LU and MEEKER [3] considered general degradation path models. DREESEN et al [6] presented a new degradation model of n-type metal-oxide semiconductor field-effect transistors (nMOSFETs) for reliability prediction. MARCHAND et al [7] used a hot carrier degradation law to predict the lifetime of MOSFETs. LISTA et al [5] presented a degradation- based reliability estimating model for electronic components in submarine applications.
Leakage current (LC) and capacitance are two characteristics of tantalum capacitors that are the most sensitive to defects and processes in the dielectric, and variations of LC and capacitance with time might provide important information regarding physical mechanisms of degradation. Degradation of LC during life testing of solid Ta capacitors has been reported in several publications [9-10]. ZEDNICEK et al [11] presented data indicating a substantial increase in LC, up to 3 orders of magnitude, in one abnormal batch of capacitors during life testing at 125 ��. Analysis showed that field crystallization may not be the only or even the main driving process responsible for failures.
All previous researches have been focused on reliability prediction based on time-to-failure analysis method and degradation modeling at the component failure mechanism level. The Weibull distribution model is often adopted as a lifetime distribution for capacitors [12], but for high-reliability capacitors that do not normally fail in a reasonable time, it is difficult to assess reliability by the traditional time-to-failure analysis method. For Ta capacitors, many research efforts on degradation analysis were initiated by making assumptions about the degradation mechanism. In reality, it may have multiple degradation paths, so it is necessary to simultaneously consider multiple degradation measures. Also often there is very limited understanding about the degradation mechanism. When the observed degradation data are collected, it is often not known which degradation model is applicable.
In recent years, the methodologies of grey prediction based on grey theory have been successfully used in many fields. In terms of information availability degree, grey prediction walks out the shadow of large-sample statistics. Grey model (abbreviated as GM), which is based on Deng��s grey theory, has been established as a prediction model. The main peculiarities of grey theory are that there are no requirements for a prior probability distribution assumption for the observed data series and its capability of using as few as four data items to forecast the future data [13]. At present, GM plays an important role to make accurate prediction in various fields [14-16]. Because of the nonlinear traits between the weight factor and the prediction errors, they cannot be solved by general method. PSO is a stochastic optimization technique that draws inspiration from the behavior of a flock of birds or the collective intelligence of a group of social insects with limited individual capabilities. In order to improve the prediction accuracy of GM(1, 2), particle swarm optimization (PSO), which has the advantages of fast convergence and easy programming, was used in this work.
In this work, a lifetime prediction method for Ta capacitors was proposed, based on multiple degradation measures and an adaptive two-parameter model.
2 Review of Ta capacitors
Ta capacitors are characterized by four performance parameters: capacitance, dissipation factor (tan��), equivalent series resistance and leakage current (LC). If any of the above parameters goes out of specification (parametric failure), the circuit may still operate, albeit with degraded performance. Sudden breakdown failures of Ta capacitors undergoing test are followed by healing but result in highly increased leakage current, and these are called degradation failures. Others result in a short- circuit or an open-circuit, and these are called catastrophic failures.
Conventional Ta capacitors utilize solid manganese dioxide (MnO2) as the counter electrode and exhibit excellent steady state reliability because of its inherent self-healing behavior [17]. This self-healing process is an important factor in the steady state reliability characteristics of tantalum capacitors, which are referenced as having ��no wear out mechanism��. One self-healing reaction is based on thermally inducing oxidization of the conductive MnO2 counter-electrode and converting into Mn2O3, a higher resistivity form of manganese oxide. The complete reaction is
![]() (1)
(1)
If there is an area on the tantalum anode��s dielectric surface that has thinner dielectric than the surrounding area, then the larger proportion of the capacitor��s current (charging, leakage, etc) will flow through that site, causing localized heating. As the temperature at the fault site increases, the above reaction (1) takes place, converting conductive manganese dioxide (MnO2), which has a resistivity of 1-10 ��/cm2, to a less conductive form (Mn2O3) having a resistivity of 106-107 ��/cm2. Thus, the conduction site is effectively ��plugged�� or ��capped��, and the fault current occurs.
The oxygen produced is absorbed by any lower order tantalum oxides other than tantalum pentoxide (Ta2O5) presented in the dielectric layer, such as TaO2, or any MnO in the counter-electrode layer. The self-healing reaction (1) is applied to situations where current availability is limited. In the case of high surge currents in low impedance applications, the breakdown of the dielectric can progress faster than the healing mechanisms, and can result in a hard short and complete thermal breakdown. Figure 1 shows the micrographs of the failed Ta capacitor.
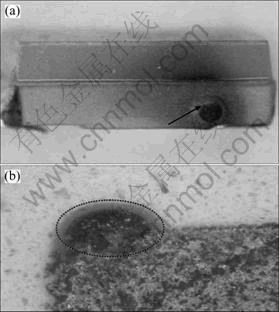
Fig. 1 Micrographs showing breakdown area of failed Ta capacitor: (a) Breakdown area; (b) Cross-section of burning point
3 Adaptive prediction model based on GM
3.1 GM (n, m)
The grey prediction is based on GM (n, m), where n is order of grey differential equation and m is number of variables. This describes grey system dynamic behavior in the form of a differential equation. It is assumed that the uncertain behavior of system can be represented by the grey process, denoted by![]() :
:
![]() (i =1, 2,��,m)
(i =1, 2,��,m)
They are original series of real numbers, with irregular distributions. Among them, ![]() is called as a mapping quantity of the system behavior and
is called as a mapping quantity of the system behavior and ![]() are behavioral series of relevant factors to be compared. Then, the r-AGO (accumulated generating operation) transformation series of
are behavioral series of relevant factors to be compared. Then, the r-AGO (accumulated generating operation) transformation series of![]() is given by
is given by
![]()
where j is the data number and r is the number of AGO transformation. The role of AGO is to partially eliminate the fluctuation in the original discrete data series as long as the original data are strictly positive. So far, in various researches on grey prediction, the most widely used number of AGO transformation is r=1.
3.2 Adaptive prediction mode GM (1, 2, w)
In this section, we consider the prediction model with two parameters. The model is described as follows:
First, the observation series for the selected sensitive parameters of Ta capacitors is assumed:
X(0)=![]() (i=1, 2; k=1, 2, 3,��)
(i=1, 2; k=1, 2, 3,��)
where i is the number of selected sensitive parameters, and k is the serial number.
X(1) is the accumulated generating series for the corresponding sensitive parameters, that is
![]() (2)
(2)
where ![]() .
.
If the original series of the selected sensitive parameters and their accumulated generating sequence are expressed as matrix, then the k line of the matrix can be expressed as
![]() (3)
(3)
First-order ordinary differential equations of the accumulated generating series can be obtained as
 (4)
(4)
Let ![]() , and
, and ![]() . Equation (4) can be written as
. Equation (4) can be written as
![]() (5)
(5)
Then, the general difference scheme of the proposed model can be obtained as
![]()
![]() (6)
(6)
where w is the weight factor, ![]() .
.
If ![]() (i=1, 2), ai can be obtained by the least squares method (LSM) as
(i=1, 2), ai can be obtained by the least squares method (LSM) as
![]() (7)
(7)
where
 (8)
(8)
Then, parameters A and B can be expressed as
 (9)
(9)
The l-th component of ![]() is
is ![]() , which is assumed as the initial condition. Then, continuous-time response for Eq.(5) can be obtained as
, which is assumed as the initial condition. Then, continuous-time response for Eq.(5) can be obtained as
![]() (10)
(10)
Where
![]()
Then, the double-parameter prediction model can be written as
![]() (11)
(11)
where ![]() ,
, ![]() . Then
. Then
![]() (12)
(12)
In order to keep the equal dimension of the series, after each prediction, the first datum of the original series was removed and the predicted data were put into the end of series. And the new background value of the proposed model was built, which was called as adaptive double-parameter predictive model.
In this work, the proposed model was used to predict the time when the selected sensitive parameters of Ta capacitors would first cross the pre-specified level.
3.3 Error analysis
Here, average residual was used to evaluate the proposed model. According, the average of the relative error is calculated to judge whether the proposed model is suitable.
1) Relative error
![]() (13)
(13)
2) Residuals mean
 (14)
(14)
where m is the dimension of degradation series; ![]() and
and ![]() are the original and prediction series, respectively.
are the original and prediction series, respectively.
Then, the accuracy for the adaptive double-parameter prediction model is determined by
![]() (15)
(15)
3) Poster checking ratio
![]() (16)
(16)
where s1 is the mean-square variance of the original series, and s2 is mean-square variance of the residual series ![]() . For parameter p, the bigger, the better. While for parameter d, the smaller, the better.
. For parameter p, the bigger, the better. While for parameter d, the smaller, the better.
4 Parameter selection based on PSO
Particle swarm optimization (PSO) is an adaptive algorithm based on a social-psychological metaphor, and a population of individuals (referred to as particles) adapt by returning stochastically toward previously successful regions [18-20]. During each generation, each particle is accelerated toward the particle��s previous best position and the global best position. At each iteration, a new velocity value for each particle is calculated based on its current velocity, the distance from its previous best position, and the distance from the global best position. Then, the new velocity value is used to calculate the next position of the particle in the search space. This process is then iterated a set number of times, or until a minimum error is achieved. Thus, the governing equations are as follows:
![]() (17)
(17)
where l is inertia weight; c1 and c2 are acceleration coefficients; r1 and r2 are random numbers between 0 and 1; pid is the best position of each particle and pgd is the global best particle.
Because of the nonlinear traits between the parameter w and the prediction errors, they cannot be solved by general method. Here, PSO is used to search the best solution of the parameter w according to the criterion of minimizing the absolute value of mean relative error, then new PSO-GM(1, 2, w) optimization model has been constructed.
In the practical lifetime prediction of components, the minimization of absolute value of mean relative error (MRE) is usually used to judge the prediction accuracy. And the implement of the PSO-GM(1, 2, w) model is described as: choose the min(abs(MRE) as fitness function, and search the best value of w. The procedure is summarized as follows.
Step 1: Initialization
Take M as particle size, create initial group![]() . Initialize inertia weight ��, acceleration coefficient c1 and c2, the maximal generation (GEN), the initial position and velocity of every particle.
. Initialize inertia weight ��, acceleration coefficient c1 and c2, the maximal generation (GEN), the initial position and velocity of every particle.
Step 2: Fitness function
Take min(abs(MRE)) as fitness function, viz:
![]()
Step 3: Operation
If ![]() , then
, then ![]() ;
;
If ![]() , then
, then ![]() .
.
Step 4: Updating
Calculate the new velocity and position of every particle according to Eq. (19).
Step 5: Stop rule
When a minimum error is achieved or iterative number attains GEN, stop searching and output searching result, otherwise return to Step 2 and go on searching.
The flowchart of PSO-GM(1, 2, w) is made up of the GM(1, 2) and PSO, as shown in Fig. 2.

Fig. 2 Flowchart of PSO-GM(1, 2, w) optimization model
5 Lifetime prediction based on degradation measures
ADT can provide the experimenter with more opportunities to draw quick inference on the lifetime distribution of highly reliable test items in use condition, provided there is a known functional link that relates the harsh testing environment to the usual use environment.
Even with little or no failures during the test period, failure-time of each item can be obtained by extrapolating the time when their degradation paths would first cross the pre-specified level. The failure-time can be expressed via pseudo failure-time for estimating the lifetime distribution of degradation data.
When any predicted value of the degradation parameters ![]() , the capacitor under testing can be regarded as failure under accelerated condition. And the according pseudo failure-time (T) relation can be expressed as
, the capacitor under testing can be regarded as failure under accelerated condition. And the according pseudo failure-time (T) relation can be expressed as
![]() (18)
(18)
where F and I are the failure threshold and the measurement interval of the observed value, respectively.
In order to estimate a lifetime distribution based on accelerated degradation data, it needs to choose a set of parameters that give the largest likelihood for a given lifetime distribution, and exploit estimates of individual lifetime from the degradation analysis. The procedure consists of two steps: degradation modeling and imputation steps. First, predictive intervals of individual lifetime are constructed by modeling the degradation paths. Then, a recursive algorithm is implemented to obtain estimates of the lifetime distribution such that the likelihood function is maximized [21].
Along with observed levels of degradation, some information on failures can be obtained during the accelerated degradation testing. In practice, because the degradation amount of a testing item is intermittently measured at certain points in time, we can only observe specific time intervals over which the item fails. The failure time, called interval-censored failure, may be combined with degradation observations to make inference on product lifetime [22].
In this work, pseudo-lifetime of each individual under different accelerated stress levels can be calculated by Eq. (18). Then, the average pseudo-lifetime under the accelerated stress levels can be estimated by lifetime distribution test and the maximum likelihood estimation. For the case where lifetime distributions are specified, specific relationships between the distribution parameters and stress variables are employed to estimate the lifetime distribution in use environment. At last, the lifetime in normal stress will be extrapolated with an accelerated model.
Here, Arrehenius model was used as the accelerating model, and it can be expressed as
![]() (19)
(19)
where A is the coefficient, E is the activation energy for the reaction (eV), k is the Boltzmann constant and k=0.861 7��10-4 eV/K.
Then Eq. (20) will be obtained by integrating Eq. (19):
![]() (20)
(20)
where a, b and c are the coefficients to be determined and ![]() ,
,![]() .
.
6 Practical applications and results
6.1 Accelerated degradation experiment and data
In this section, we will illustrate application of the approaches proposed to ADT data of Ta capacitors. The accelerated testing experiment was conducted in Reliability Laboratory of Electric Device, Beihang University, China. The purpose of this experiment is to study the effect of stress on Ta capacitors and to predict their lifetime under operating conditions. Leakage current and capacitance were considered as the sensitive degradation parameters.
The devices under test were military-grade Ta capacitors marked as CAK45 16V68uF. Failure of the device is defined as leakage current greater than 0.01CRUR or capacitance greater than 1.2CR, where CR is nominal capacitance and UR is rated voltage. Since the devices should be processed in the high temperature degradation test, the circuit board was composed with test circuit board and fixture circuit board. The two boards were connected with high-temperature line, as shown in Fig. 3.

Fig. 3 Photograph of circuit board and devices under accelerated life testing experiment
The experiment was conducted at three different stress levels: 85 ��, 120 ��, and 145 ��. Data obtained from stress levels of 85 �� and 120 �� were used to estimate the model. Data obtained from stress level of 145 �� were used to validate the model.
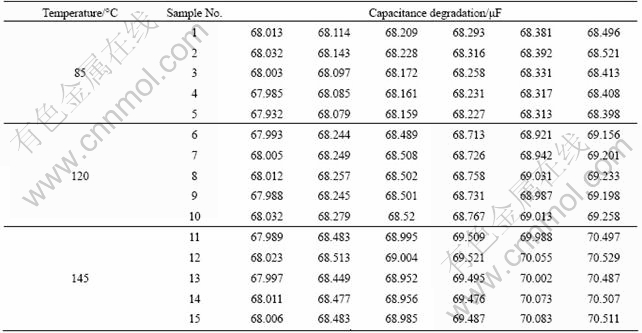
At each stress level, we conducted one accelerated life testing experiment with 5 samples for testing. In each test, a designed-circuit-board containing 10 randomly chosen Ta capacitors was placed in a temperature chamber where the temperature and voltage in the circuit were held constant. The leakage current and capacitance of the devices were measured at room temperature every 192 h and 72 h, respectively. Table 1 and Table 2 give the accelerated degradation testing data of leakage current and capacitance over time at each temperature stress level, respectively.
Table 1 Leakage current degradation data under ADT
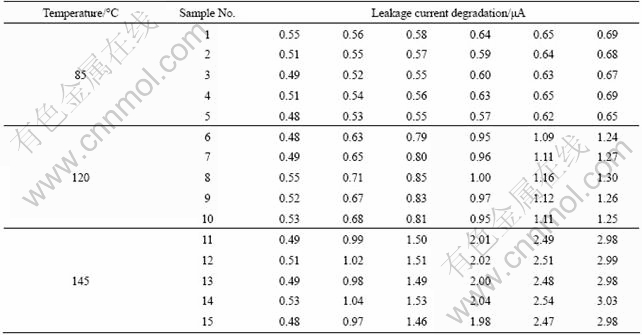
Table 2 Capacitance degradation data under ADT
6.2 Degradation path prediction based on GM (1, 2, w)
Figures 4 and 5 show leakage current and capacitance degradation prediction based on GM(1, 1) and GM(1, 2, w), respectively. It can be seen that predicting accuracy of the proposed GM (1, 2, w) model is better than that of GM(1, 1). In this work, GM(1, 2, w) model was used to obtain the degradation path.
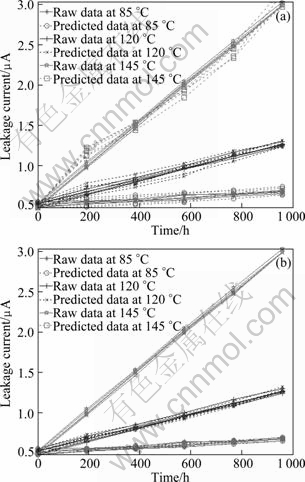
Fig. 4 Leakage current degradation prediction based on GM(1, 1) (a) and GM(1, 2, w) (b)
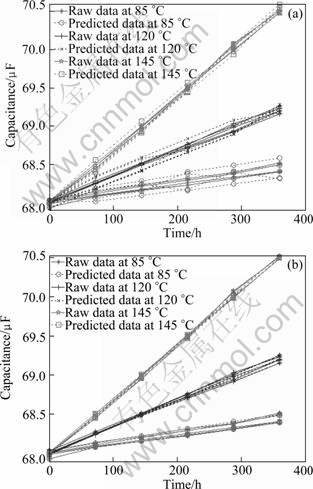
Fig. 5 Capacitance degradation prediction based on GM(1, 1) and GM(1, 2, w) (b)
By using Eqs. (17) and (18) and the raw data and predicted data in Figs. 4 and 5 , modeling precision p and poster checking ratio d of the proposed GM(1, 2, w) model was obtained. The prediction accuracy p of each sample��s leakage current is above 93.779%. The prediction accuracy p of each sample��s capacitance is as high as 99.983%. It can be considered that the proposed model is excellent. All the poster checking parameters d of each sample��s leakage current and capacitance are less than 0.211 and 0.246, respectively. And the level of GM(1, 2, w) model can be considered as good.
6.3 Lifetime prediction
For CAK45 16V68uF, the failure thresholds of leakage current and capacitance degradation are 10.88 ��A and 81.6 ��F, respectively.
Pseudo-life of each sample can be extrapolated via Eqs. (18) and (19). In order to determine the best fitting distribution, the weibull distribution, normal distribution and exponential distribution test were done for these three group samples with Kolmoglrov-Smirnov. With significance level ��=0.05, the probability for pseudo-life fitting these three distributions is listed in Table 3.
Table 3 Probability distribution for pseudo-life
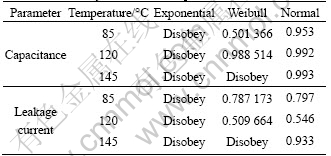
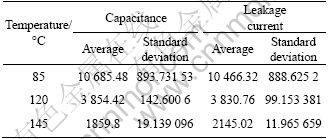
From Table 3, the pseudo-life fits normal distribution best. Estimated value for the unknown parameter of normal distribution, as shown in Table 4, can be obtained by maximum likelihood estimation method via average pseudo-failure data.
Table 4 Estimated value for parameters of normal distribution
If any predicted capacitance or LC reaches its own failure threshold, the according device can be considered as failure. Then, the smaller predicted lifetime is the pseudo-life of the device under the corresponding experimental temperature. Since voltage applied to the devices is held constant during ADT, Eq. (19) can be simplified as
![]() (21)
(21)
By using two groups of pseudo-life and temperature data, the coefficients a and b in Eq. (20) can be obtained as a=-2.887 2, b=4 349.5. When working temperature of the devices is 35 ��, the pseudo-life can be obtained as
![]()
That is, the predicted life of Ta capacitors marked as CAK45 16V68uF is approximately 8.73 a, which is corresponding to 8-10 a provided by manufacturer.
7 Conclusions
1) A lifetime prediction method and a PSO-GM(1, 2, w) optimization model are proposed for high-reliability Ta capacitors.
2) An adaptive two-parameter model based on GM is proposed to analyze performance degradation data obtained in accelerated operating conditions. In order to improve the prediction accuracy of the two-parameter model, parameter selection based on PSO is adopted.
3) The model is validated experimentally by conducting an accelerated testing on CAK45 16V68uF capacitors. The experiments are conducted at three different stress levels of 85, 120 and 145 ��.
4) By comparing the reliability estimates obtained by the proposed model with those obtained using the data from the third experiment, the proposed model is valid and accurate.
References
[1] FREEMAN Y, HAHN R, LESSNER P. Reliability and critical applications of tantalum capacitors [C]// CARTS Europe. Barcelona, Spain, 2007: 194-203.
[2] SOTIRIS V A, TSE P W, PECHT M G. Anomaly detection through a bayesian support vector machine [J]. IEEE Transactions on Reliability, 2010, 59(2): 277-286.
[3] PARK Jong-in, BAE Suk-joo. Direct prediction methods on lifetime distribution of organic light-emitting diodes from accelerated degradation tests [J]. IEEE Transactions on Reliability, 2010, 59(1): 74-90.
[4] LU C J, MEEKER W Q. Using degradation measures to estimate a time-to-failure distribution [J]. Techno Metrics, 1993, 35(2): 161-174.
[5] LISTA V, GARBOSSA P, TOMASI T. Degradation based long-term reliability assessment for electronic components in submarine applications [J]. Micro-electronics Reliability, 2002, 42: 1389-1392.
[6] DREESEN R, CROES K, MANCA J. A new degradation model and lifetime extrapolation technique for lightly doped drain nMOSFETs under hot-carrier degradation [J]. Microelectronics Reliability, 2001, 41: 437-443.
[7] MARCHAND B, GHIBAUDO G, BALESTRA F. A new hot carrier degradation law for MOSFET lifetime prediction [J]. Microelectronics Reliability, 1998, 38: 1103-1107.
[8] GONG Hai, WU Yun-xin, LIAO Kai. Prediction model of residual stress field in aluminum alloy plate [J]. Journal of Central South University of Technology, 2011, 18: 285-289.
[9] REED E K. Tantalum chip capacitor reliability in high surge and ripple current applications [C]// Proceedings of the 44th CARTS. Washington D C, USA, 1994: 861-868.
[10] ZEDNICEK S, HORACEK I, PETRZILEK J, JACISKO P, GREGOROVA P, ZEDNICEK T. High CV tantalum capacitors�Cchallenges and limitations [C]// CARTS Europe. Helsinki, Finland, 2008: 121-130.
[11] ZEDNICEK T, SIKULA J, LEIBOVITZ H. A study of field crystallization in tantalum capacitors and its effect on DCL and reliability [C]// Proceedings of the 29th CARTS. Jacksonville, FL, 2009. 5.3.1-11.
[12] LARSON D, MACDOUGALL F W, HARDY P. The impact of high energy density capacitors with metallized electrode in large capacitor banks for nuclear fusion application [C]// Proceedings of the 9th IEEE Pulsed Power Conference. Albuquerque, NM, 1993: 735-738.
[13] DENG J L. The primary methods of grey system theory [M]. Wuhan: Huazhong University of Science and Technology Press, 2005.
[14] Hsu Che-chiang, Chen Chia-yon. Applications of improved grey prediction model for power demand forecasting [J]. Energy Conversion and Management, 2003, 44(14): 2241-2249.
[15] Wu Wann-yih, Chen Shuo-pei. A prediction method using the grey model GMC (1, n) combined with the grey relational analysis: A case study on Internet access population forecast [J]. Applied Mathematics and Computation, 2005, 169(1): 198-217.
[16] LI Guo-dong, YAMAGUCHI D, MIZUTANI K. New proposal and accuracy evaluation of grey prediction GM [J]. IEICE Transactions on Undamentals, 2007, E90�CA(6): 1188-1197.
[17] ZEDNICEK T, GILL J. Voltage derating results for solid tantalum and niobium capacitors [C]// CTI CARTS. Stuttgart, Germany, 2003: 44-50.
[18] SHI X H, LIANG Y C, LEEB H P. An improved GA and a novel PSO-GA-based hybrid algorithm [J]. Information Processing Letters, 2005, 93(5): 255-261.
[19] JHA G K, THULASIRAMAN P, THULASIRAM R K. PSO based neural network for time series forecasting [C]// International Joint Conference on Neural Networks, 2009: 1142-1427.
[20] FENG Hsuan-ming. Self-generation RBFNs using evolutional PSO learning [J]. Neurocomputing, 2006, 70(1/2/3): 241-251.
[21] PADGETT W J, TOMLINSON M A. Inference from accelerated degradation and failure data based on Gaussian process models [J]. Lifetime Data Analysis, 2004, 10: 191-206.
[22] CHEN Z, ZHENG S. Lifetime distribution based degradation analysis [J]. IEEE Trans. Reliability, 2005, 54: 3-10.
(Edited by YANG Bing)
Foundation item: Project(Z132012) supported by the Second Five Technology-based Fund in Science and Industry Bureau of China; Project(1004GK0032) supported by General Armament Department for the Common Issues of Military Electronic Components, China
Received date: 2011-08-02; Accepted date: 2011-11-07
Corresponding author: HUANG Jiao-ying, PhD; Tel: +86-10-82314571; E-mail: huangjy@buaa.edu.cn
Abstract: A lifetime prediction method for high-reliability tantalum (Ta) capacitors was proposed, based on multiple degradation measures and grey model (GM). For analyzing performance degradation data, a two-parameter model based on GM was developed. In order to improve the prediction accuracy of the two-parameter model, parameter selection based on particle swarm optimization (PSO) was used. Then, the new PSO-GM(1, 2, w) optimization model was constructed, which was validated experimentally by conducting an accelerated testing on the Ta capacitors. The experiments were conducted at three different stress levels of 85, 120, and 145 ��. The results of two experiments were used in estimating the parameters. And the reliability of the Ta capacitors was estimated at the same stress conditions of the third experiment. The results indicate that the proposed method is valid and accurate.
