
Trans. Nonferrous Met. Soc. China 23(2013) 3748-3757
Analysis of high-power disk laser welding stability based on classification of plume and spatter characteristics
Xiang-dong GAO1, Qian WEN1, Seiji KATAYAMA2
1. School of Electromechanical Engineering, Guangdong University of Technology, Guangzhou 510006, China;
2. Joining and Welding Research Institute, Osaka University, 11-1 Mihogaoka, Ibaraki, Osaka 567-0047, Japan
Received 7 January 2013; accepted 20 March 2013
Abstract:
Classification of plume and spatter images was studied to evaluate the welding stability. A high-speed camera was used to capture the instantaneous images of plume and spatters during high power disk laser welding. Characteristic parameters such as the area and number of spatters, the average grayscale of a spatter image, the entropy of a spatter grayscale image, the coordinate ratio of the plume centroid and the welding point, the polar coordinates of the plume centroid were defined and extracted. Karhunen-Loeve transform method was used to change the seven characteristics into three primary characteristics to reduce the dimensions. Also, K-nearest neighbor method was used to classify the plume and spatter images into two categories such as good and poor welding quality. The results show that plume and spatter have a close relationship with the welding stability, and two categories could be recognized effectively using K-nearest neighbor method based on Karhunen-Loeve transform.
Key words:
high-power disk laser welding; plume; spatter; feature classification; stability;
1 Introduction
Disk laser welding is one of the most advanced laser welding technology with characteristics of high laser power, excellent beam quality, high aspect ratio and high utilization of laser. Plume and spatter are significant phenomena in high-power disk laser welding process, which contains lots of information that relates to the laser welding quality and has a close relationship with the welding stability and energy utilization [1,2]. Metal plume could absorb and refract the laser beam and incur the deviation of the laser focus position, which will seriously affect the laser welding quality [3]. Stable heat transfer and metal melting process is the key to ensure the weld quality. The amount of spatters can reflect the stability of welding process and the quality of welding joint [4]. KATAYAMA et al [5] compared the effects of spatter and plume on high-power CO2 laser, YAG laser and fiber laser welding. So, real-time monitoring of spatter and plume is very necessary for monitoring of weld quality in laser welding process.
Nowadays, many researches on enhancing welding quality are to study the behavior of plasma, the tracking and eruption of spatters [6-8]. With the development of pattern recognition technique, more and more pattern recognition methods were applied to the research of plasma and spatters. PARK et al [9] classified the factors that influence the weld quality into five categories according to the plasma and spatter captured by the UV sensor during laser welding, and used the fuzzy multi- feature pattern recognition algorithm for the real-time evaluation of welding quality. This research was based on the welding technological parameters and the measurement of heat. The extraction of image features is also an important method to monitor and analyze the welding process. GAO et al [10] calculated the number, area, and ejecting distance of spatters and the centroid height of spatter images as the characteristic parameters of spatters, and studied the correlation between the spatter characteristics and the quality and stability of welding. This work is to further study the evaluation of high power disk laser welding stability based on classification of plume and spatter characteristics.
The austenitic stainless steel 304 was used as the specimen for high-power disk laser welding experiments. A high-speed camera was used to capture the ultraviolet band and visible light band plume and spatter images during the laser welding. Image processing techniques such as median filtering, Wiener filtering, gray level threshold and gray level transform were applied to processing these images. The area and number of spatters, the average gray level of a spatter grayscale image, the entropy of a spatter grayscale image, the coordinate ratio of the centroid of metal vapor plume and the welding point, the polar coordinates of the centroid of metal vapor plume which were extracted from the processed metal vapor plume and spatter images were defined as the characteristic parameters. To obtain a set of characteristics that reflect the actual welding results more obviously and for a better classification, Karhunen- Loeve (K-L) transform method was used to get three primary new characteristic parameters. Then, K-nearest neighbor method was used to classify the plume and spatter images into two categories.
2 Experimental
2.1 Experimental setup
The experimental system consisted of a TruDisk-10003 disk laser welding equipment (laser power of 10 kW), a Motoman 6-axis robot and a welding experimental platform equipped with a camera, shielding gas (argon), motor servo and fixing devices. The diameter of laser spot was 480 mm, the wavelength of the laser was 1030 nm, and the welding speed was 4.5 and 3.0 m/min, respectively. Plume image recording was carried out at 2000 frame/s by a 512��512 pixel high- speed NAC camera. The wave band collected by the camera was in the scope of UV light and visible light. A bead-on-plate welding was carried out, in which the specimen was a stainless steel 304 plate with dimensional size of 150 mm��100 mm��20 mm. The schematic drawing of the whole experimental system is given in Fig. 1.
2.2 Image processing
Figure 2 shows the high-power disk laser welding image processing process. Figure 2(a) shows an original plume and spatter image. It was first turned into grayscale image, then Median filtering and Wiener filtering were used to eliminate the image noises (Fig. 2(b)). It was found that when the global threshold 183 was applied to the filtered image, the morphology of the plume was the most accurate and could be used to calculate the centroid of plume. The image after deleting the areas which were less than 240 pixels in a binary image is shown in Fig. 2(c). Otsu method was applied to the filtered image by which the lightness was increased to get a binary spatter image that the morphology of spatters was the most accurate, so it could be used to compute the area of spatters in a plume and spatter image. Figure 2(d) shows a binary spatter image in which the areas of less than 450 pixel2 were erased. The spatter grayscale image could be obtained by a method that the binary spatter image was multiplied by the filtered image (Fig. 2(e)).
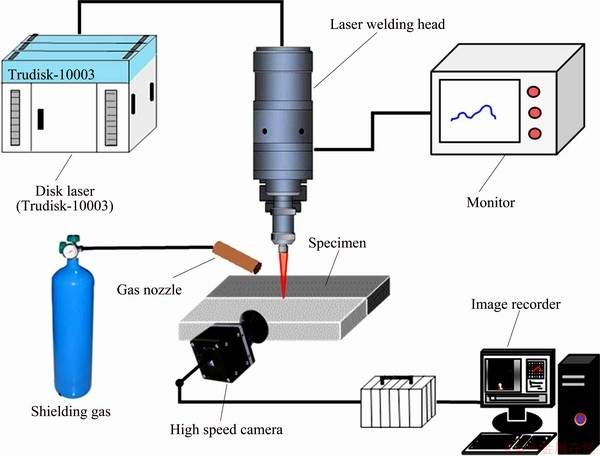
Fig. 1 Schematic of high-power disk laser welding experimental setup
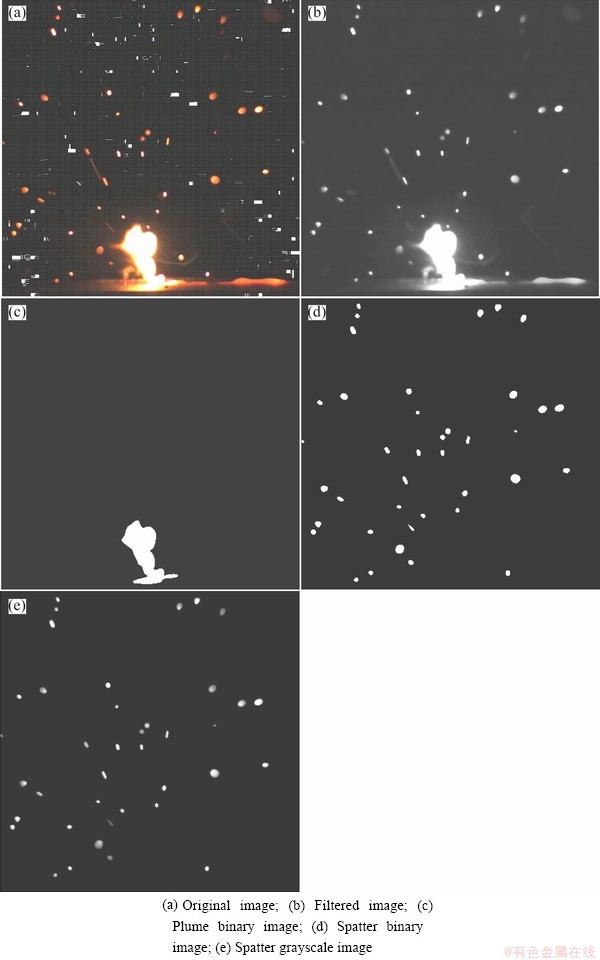
Fig. 2 Plume and spatter image processing of high-power disk laser welding
2.3 Extraction of plume and spatter characteristics
The success or failure of a pattern recognition system depends on whether the used characteristics could better reflect the classification problem [11-13]. Totally, seven characteristics of plume and spatters were extracted in this experiment. They are the number and area of spatters in an image (N and A), the coordinate ratio of the centroid of metal vapor plume and the welding point (Rcw), the average gray level of a spatter grayscale image  , the polar coordinates of the centroid (radius vector �� and polar angle ��) and the entropy of a spatter grayscale image (H). They all reflect the real welding results and they are irrelevant.
Calculating the number that the grayscale value is 1 in a spatter binary image could obtain the area of spatters in a plume and spatter image. A pixel with a connected region was considered to be a spatter. Calculating the number of connected regions in a spatter binary image could obtain the spatter number. The nature of the connected region is decided by the adjacent mode, for which the most common ways are 4-adjacent and 8-adjacent methods [14]. Here, 8-adjacent connection way was applied to searching for the connected region in the spatter binary images.
Figure 3 shows the definition of the origin coordinate of an image (0, 0), the centroid of plume (xc,yc) and the welding point (xo,yo). In the laser welding experiments, the welding point was fixed, where (x0,y0)=(255,485).
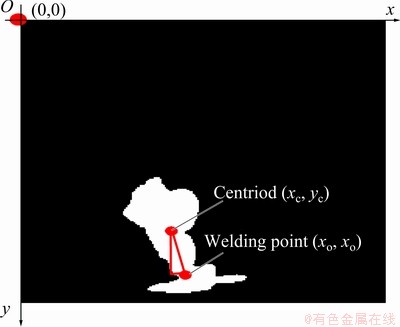
Fig. 3 Definition of relevant characteristic points
The calculation formulae of the centroid (xc,yc) and other four characteristics Rcw,  ��, and �� are shown as Eqs. (1) to (5).
 (1)
(1)
 (2)
(2)
 (3)
(3)
 (4)
(4)
 (5)
(5)
where i, j are the row and column numbers, respectively; n is the total number of rows; m is the total number of columns; g(i, j) stands for the gray level value of a pixel.
In the information theory, entropy is the appearance probability of a certain types of information, which is a quantitative measurement of information [15]. The entropy H of the spatter grayscale image is
 (6)
(6)
where g represents the gray level, s is the number of gray level and p(g) is the appearance probability of gray level x.
2.4 K-L transformation
Feature extraction is a key step in pattern recognition. There are many feature extraction methods [16,17]. Karhunen-Loeve transform (K-L transform) is an optimum orthogonal transform based on objective statistical characteristics. It is a commonly used feature extraction method in pattern recognition. It has some important properties. For example, the transformed new components are orthogonal and irrelevant in comparison with original vector, the mean square error of the new components is up to the minimum, the transformed new components are more identified and the energy is more concentrate [18]. Also, K-L transform method is a normal method of feature extraction and it has been widely used [19-21]. The transform formula of K-L transform is
 (7)
(7)
where D-dimensional original feature d-dimensional transformed new feature
  , W is the D��d dimensional transformation matrix. The key is to seek for an appropriate transformation matrix W. The steps of calculating the transformation matrix W are shown as follows [22].
Step 1: Calculate the total scatter matrix within class Sw (Eq. (8)). The calculation formula of covariance matrix S of each category is given by Eq. (9).
 (8)
(8)
 (9)
(9)
where P is the priori probability, E is the expectation, u is the mean value of each category and c is the total number of categories.
Step 2: Calculate the eigenvalue and eigenvector of Sw and selecting d eigenvectors which correspond to the first d-largest eigenvalue as the transformation matrix W.
2.5 K-nearest neighbor classification
K-nearest neighbor (KNN) classification is a simple and effective classifying method. It can classify the unknown sample directly from the training samples, and is still one of the most important methods in non-parametric pattern recognition. K-nearest neighbor method is a classifier which has piecewise-linear discriminate function. Because of its clear principle, excellent classification ability and simplification, it has a very wide range of applications [23-25].
Suppose that there are n known samples which belong to c categories wi (i=1, ��, c), the category of the new sample q is decided by studying its first k-nearest neighbor in the known samples. Assume there are ki which belong to category wi, the discriminant function of category wi is gi(q) =ki (i=1, ��, c). The decision rule is
If  , then
where wk means the category.
There are two types of images in this experiment. If k1 is greater than k2, the new sample belongs to type 1; otherwise, it belongs to type 2.
3 Results and discussion
The weldment with welded seam length of 91 mm is shown in Fig. 4(a). It can be seen that the weld bead width in area B was significantly smaller than that in area A or C. In fact, area B was the poor welding quality region, and areas A and C were the good welding quality regions. The weld bead width corresponding to each image is shown in Fig. 4(b).
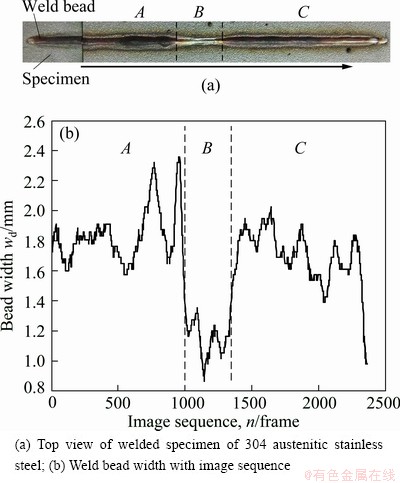
Fig. 4 Original information of high-power disk laser welding
The whole welding process lasted for 1.2 s, totally 2427 images were captured by the high-speed camera, and 2360 continuous images were analyzed in this experiment. All images could be divided into two categories, Images No.1-996 corresponding to area A and Images No.1348-2360 corresponding to area C were defined as type 1 and were represented by number 3. Images No.997-1347 corresponding to area B were defined as type 2 and were represented by number 0. Original feature x was a seven-dimensional vector which was composed of the seven extracted characteristics, x=[N, A, Rcw,  , ��, ��, H]. According to the proportion of each categories in the total number of images, the priori probability of each category was P1=0.85 (type 1), P2=0.15 (type 2). Images No.997-1099 and No.1301- 1347 were selected as the training samples of type 1. Images No.151-550 and No.1401-1550 were selected as the training samples of type 2. The seven-dimensional vector x was transformed into 3-dimensional vector xt= [x��, y��, z��] by using K-L transform method. The value of each characteristic with image sequence is shown in Fig. 5.
It can be concluded from Figs. 4 and 5 that the change of each characteristic parameter was consistent with the actual welding results, and all values performed a sudden change in the middle of the image sequence, which was corresponding to the area B in Fig.4 where was the poor welding quality region. These characteristic parameters can be used to describe the stability of high- power disk laser welding process. It took 1.154 s for MATLAB 7.11.0 to process a plume and spatter image and extract seven characteristic parameters at the computer environment of Inter+Pentium(R) CPU P6000 1.87 GHz, RAM 2 GB. The processing speed will promote 100-400 times using C program [26]. Figure 6 shows the value of three new characteristics with image sequence.
Table 1 shows the mean value of each characteristic in different areas before K-L transform. It can be seen from Table 1 that though the mean values of N, A, Rcw, , �� and H in area B were larger than those in area A or C, the differences of N, A, and H between area B and area C were not very obvious, and the difference of Rcw between areas A and B was not very obvious. It also can be seen that there was large difference between areas A and C in ��. The mean value of �� in area B was lower than that in area A or C, but the difference among these three areas was very small. So, there exists message that has no relationship with classification in those seven original characteristics, and the difference between the two categories is not very obvious.
Table 1 Mean values of each characteristic parameters in different areas before K-L transform
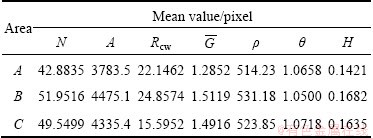
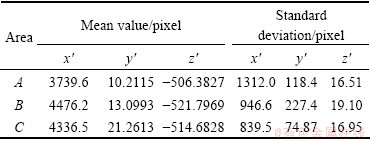
Table 2 shows the mean value and standard deviation of each transformed new characteristic in different areas. It can be seen from Table 2 that the mean values of x�� and z�� in area B were very different from the mean value in area A or C, also the difference between the values in areas A and C was more smaller than the difference between the values in areas A and B or areas C and B. This means the difference between the two categories was more obvious. But those features were not evident for y��. However, it can be seen from Table 2 that the standard deviation value of y�� in area B was more larger than that in areas A and C, and the difference between areas A and B or areas C and B was more larger than that in areas A and C. Standard deviation is a standard of measuring the dispersion degree of data distribution [27]. That means the gap in the data of area B was much larger than that in area A or C, and the welding process in area B was unstable. This is consistent with the actual welding results. So, it could conclude from Tables 1 and 2 that the transformed new data were the best compression of the original data. It reduced the information that has no relationship with classification in the original seven characteristics. By using K-L transform, the information of the seven characteristics was expressed by three new characteristics. The difference between the two categories was more apparent in the three transformed new characteristics and it contributed to classify the three new characteristics more easily.
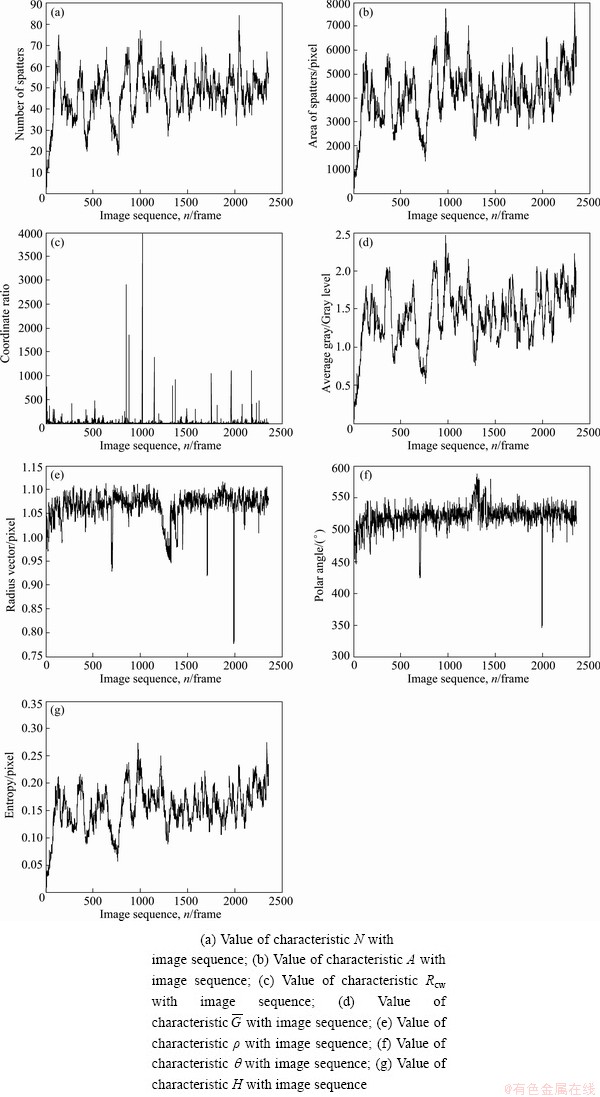
Fig. 5 Values of each characteristic parameter with image sequence
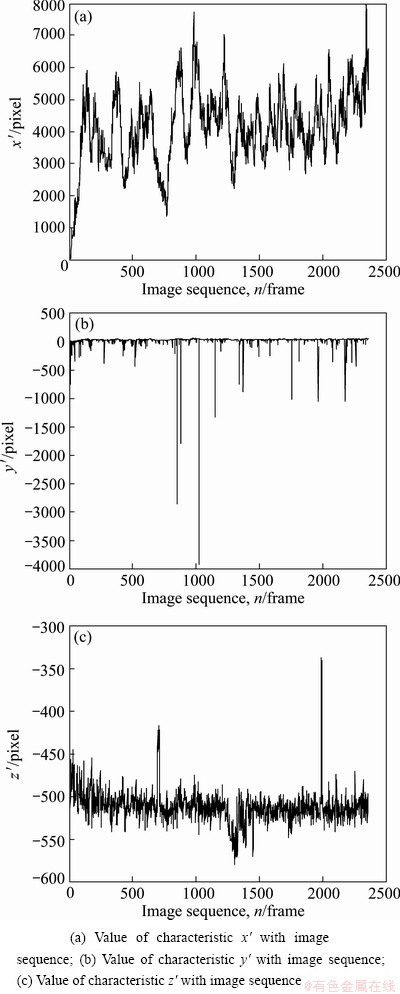
Fig. 6 Values of three transformed new characteristics with image sequence
Table 2 Mean values and standard deviation of each transformed new characteristic in different areas
In order to eliminate the dimensional effects and the effect of value difference among the characteristics itself and value difference between different characteristics, the deviation standardization method was used to standard the new data [28]. The standard formula is
 (10)
(10)
where xs is a variable. It is one of the three new characteristics in this experiment.
The three-dimensional figures of the three new characteristics before and after data standardization are shown in Figs. 7(a) and (b), respectively. A point stands for a three-dimensional vector xt(i) (i=1, 2, ��, 2360), and a vector means an image. Blue points belong to type 1 and red ones belong to type 2. The data after standardization was pure number without unit. After deviation standardization, the value of each characteristic was ranged from 0 to 1 and the samples of each category were more focused and the boundary between the two categories was more obvious than before.
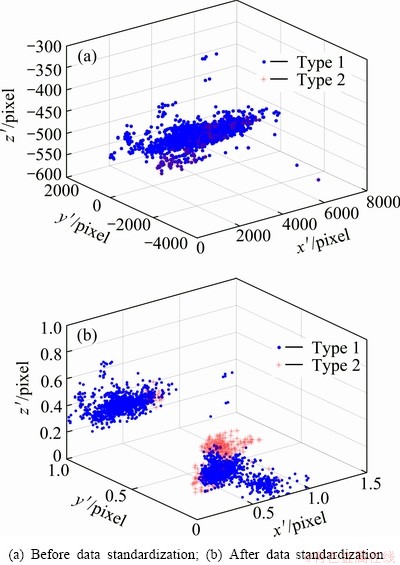
Fig. 7 3-dimensional figure of data standardization and classification
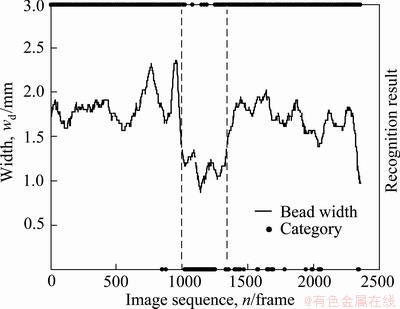
Fig. 8 Comparison of classification result and actual weld bead width
Based upon the previous experiments, KNN method was used to classify the 2360 images into two categories. The training samples were the same as the training samples of K-L transform. The rest were divided into three groups according to the areas A, B and C. The classification result was different with the change of k. It was found that when k=115, the recognition result was the best. The comparison of classification result and actual weld bead width is given in Fig. 8. The distance between the samples was European distance. The recognition rate of each area is shown in Table 3.
Table 3 Recognition rate of each area of weld bead
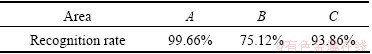
It can be concluded from Fig. 8 that there was a high wrong recognition rate during the transition stage of areas B and C, and this is the main factor of the relatively low recognition rate of area B. Welding is a complex, time-varying and nonlinear process. With the change of welding situation, the amount of spatters was fewer and fewer at the end of area B, and this phenomenon influenced the value of some characteristic parameters such as N, A, and H. The value difference between area B and area C was reduced gradually as shown in Figs. 5 and 6. This is different from the transition stage of area A and area B when the value increased suddenly. The characteristic parameters such as N, A,  and H were influenced by the amount of spatters, and this is the main reason of classification boundary blur between area B and area C and, and could result in the relatively low recognition rate of area B. However, the plume and spatter image could be recognized effectively by KNN method based on K-L transform and this will provide a theory basis for the realization of real time monitoring of welding process.
Another welding experiment at welding speed of 3 m/min was carried out to test the proposed model. Totally 3596 plume and spatter images were captured. The whole welding process was stable and the welding quality was good. The welded specimen is shown in Fig. 9. Because the number of testing samples increased, the value of k increased accordingly. It was found that the recognition rate was up to 98.80% when k=211. The classification result is shown in Fig. 10.
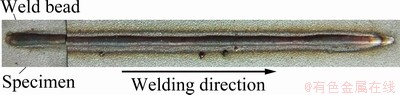
Fig. 9 Top view of welded specimen at welding speed of 3 m/min
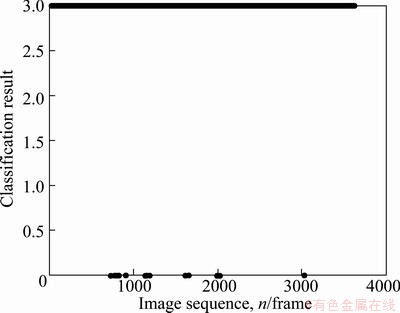
Fig. 10 Classification result at welding speed of of 3 m/min
4 Conclusions
1) Laser-induced metal vapor plume and spatters during high-power disk laser welding contain a lot of information associated with the welding quality. Image processing method such as median filtering, Wiener filtering, lightness transform and Canny edge detection can be applied to processing the plume and spatter images captured by a high-speed camera, and to obtaining the accurate information of the images for the extraction of characteristics.
2) The extracted characteristics such as the area and number of spatters, the average gray level of a spatter grayscale image, the entropy of a spatter grayscale image, the coordinate ratio of the centroid of metal vapor plume and the welding point, the polar coordinates of the centroid of metal vapor plume, have a close relationship with the actual welding quality.
3) K-L transform method can reduce the information that has no relationship with classification in the seven original characteristics, and distinguish the difference between the two categories. This will contribute to the classification of high-power disk laser welding images and monitoring of welding behaviors.
4) After deviation standardization, the data of each category are more concentrate and the boundary between the two categories is more obvious. Using K-nearest neighbor method to classify the metal vapor plume and spatter images of high power disk laser welding into two categories could obtain a good recognition rate. The proposed method provides a new method for the real-time monitoring of laser welding quality.
References
[1] KIM C, KIM J, LIM H, KIM J. Investigation of laser remote welding using disc laser [J]. Journal of Materials Processing Technology, 2008, 201: 521�C525.
[2] LI Guo-hua, CAI Yan, WU Yi-xiong. Stability information in plasma image of high-power CO2 laser welding [J]. Optics and Lasers in Engineering, 2009, 47(9): 990-994.
[3] GAO Xiang-dong, WANG Run-ling, YANG Yong-chen. Time- frequency characteristics clustering of metallic plume during high power disk laser welding [C]//AO S I, DOUGLAS C, GRUNDFEST W S, BURGSTONE J. WCECS 2012. Newswood Limited Publishing, 2012: 660-664.
[4] KAPLAN A F H, POWELL J. Spatter in laser welding [J]. Journal of Laser Applications, 2011, 23(3): 032005.
[5] KATAYAMA S, KAWAHITO Y, MIZUTANI M. Elucidation of laser welding phenomena and factors affecting weld penetration and welding defects [J]. Physics Procedia, 2010, 5(Part B): 9-17.
[6] CHEN Jian-chun, PAN Chun-xu. Welding of Ti-6Al-4V alloy using dynamically controlled plasma arc welding process [J]. Transactions of Nonferrous Metals Society of China, 2011, 21(7): 1506-1512.
[7] KIM C H, AHN Y N, KIM J H. CO2 laser-micro plasma arc hybrid welding for galvanized steel sheets [J]. Transactions of Nonferrous Metals Society of China, 2011, 21(S1): s47-s53.
[8] NICOLOSI L, ABT F, BLUG A, HEIDER A, TETZLAFF R, HOFLER H. A novel spatter detection algorithm based on typical cellular neural network operations for laser beam welding processes [J]. Meas Sci Technol, 2012, 23: 015401.
[9] PARK Y W, PAR H, RHEE S, KANG M. Real time estimation of CO2 laser weld quality for automotive industry [J]. Optics & Laser Technology, 2002, 34(2): 135-142.
[10] GAO Xiang-dong, LONG Guan-fu, WANG Run-lin, KATAYAMA S. Spatter characteristics analysis of high power disc laser welding [J]. Acta Phys Sin, 2012, 61(9): 490-496. (in Chinese)
[11] LI D C, LIU C W, SUSAN C H. A fuzzy-based data transformation for feature extraction to increase classification performance with small medical data sets [J]. Artificial Intelligence in Medicine, 2011, 52(1): 45-52.
[12] LIU Huan, YU Lei. Toward integrating feature selection algorithms for classification and clustering [J]. IEEE Transactions on Knowledge and Data Engineering, 2005, 17(4): 491-502.
[13] JAIN A, ZONGKER Z. Feature selection: Evaluation, application, and small sample performance [J]. IEEE Transactions on Pattern Analysis and Machine Intelligence, 1997, 19(2): 153-158.
[14] GONZALEZ R C, WOODS R E, EDDINS S L. Digital image processing [M]. RAN Qiu-qi. Beijing: Electronics Industry Press, 2008: 51-53. (in Chinese)
[15] CHANG C L, DU Y, WANG J, GUO S M. Survey and comparative analysis of entropy and relative entropy thresholding techniques [J]. IEE Proc -Vision, Image Signal Process, 2006, 153(6): 837-850.
[16] ZHANG Ping, GUO Xi. A cascade face recognition system using hybrid feature extraction [J]. Digital Signal Processing, 2012, 22(6): 987-993.
[17] ZHAO Yi-su, SHEN Xiao-jun, GEORGANAS N D, PETRIU E M. Part-based PCA for facial feature extraction and classification [C]// IEEE Int Workshop Haptic Audio Vis Environ Games, HAVE - Proc. IEEE Computer Society, 2009: 99-104.
[18] OBAIDAT M S. On the characterization of ultrasonic transducers using pattern recognition [J]. IEEE Transactions on Systems Man and Cybernetics, 1993, 23(5): 1443-1450.
[19] LU G M, ZHANG D, WANG K Q. Palmprint recognition using eigenpalms features [J]. Pattern Recognition Letters, 2003, 24(9-10): 1463-1467.
[20] WU Kun-qing, HUANG Lian-fen, LIN He-zhi. Face detection based on YCbCr Gaussian model and KL transform [C]//ISCCS 2011. Los Alamitos, CA, USA: IEEE Computer Society, 2011: 100-103.
[21] GANG Tie, SHEN Chun-long, GONG Run-li. Feature analysis and extraction of inner defects for spot weld nugget of aluminum alloy [J]. Transactions of Nonferrous Metals Society of China, 1998, 8(3): 485-489.
[22] ZHANG Xue-gong. Pattern recognition [M]. Beijing: Tsinghua University Press, 2010: 167-168. (in Chinese)
[23] HATTORI K, TAKAHASHI M. A new edited k-nearest neighbor rule in the pattern classification problem [J]. Pattern Recognition, 2002, 33(3): 521-528.
[24] BHATTACHARYA G, GHOSH K, CHOWDHURY A S. An affinity- based new local distance function and similarity measure for kNN algorithm [J]. Pattern Recognition Letters, 2012, 33(3): 356-363.
[25] BELIAKOW G, LI Gang. Improving the speed and stability of the k-nearest neighbor method [J]. Pattern Recognition Letters, 2012, 33(10): 1296-1301.
[26] WANG Z Z, ZHANG Y M. Brightness-based selection and edge detection-based enhancement separation algorithm for low-resolution metal transfer images [J]. IEEE Transactions on Automation Science and Engineering, 2009, 6(1): 181-187.
[27] STARK H, BRANKOV J G. Estimating the standard deviation from extreme Gaussian values [J]. IEEE Signal Processing Letters, 2004, 11(3): 320-322.
[28] WANG Hao-fang, ZHANG Jin-cun. Analysis of different data standardization forms for fuzzy clustering evaluation results influence [C]//3rd Int Conf Bioinformatics Biomed Eng. Piscataway, NJ, USA: IEEE Computer Society, 2009: 1-4.
���������ͷɽ�ͼ����������Ĵ������μ��⺸�ȶ��Է���
����1���� ��1, Seiji KATAYAMA2
1. �㶫��ҵ��ѧ ���繤��ѧԺ������ 510006��
2. �����ѧ �ӺϿ�ѧ�о��������� 567-0047���ձ�
ժ Ҫ�����öԽ�������ͼ���������з���ķ������������ӹ��̵��ȶ��ԡ�ʹ�ø��������ʵʱ��ȡ�������μ��⺸�ӹ����н��������ͷɽ�ͼ���岢��ȡ�ɽ�����������ɽ��Ҷ�ͼ��ƽ���ҶȺ��ء��������������뺸�ӵ��������Լ������������ĵļ�����(ʸ���ͼ���)��7�����������ͷɽ�������Ϊʵ�ֽ�ά��ʹ��Karhunen-Loeve�任����7ά��������ת��Ϊ3ά����������ͬʱʹ��K���ڷ���ͼ��ֳɺ��������Ϻ���ϲ����ࡣʵ���������������������ɽ��뺸���ȶ��������е���ϵ��ʹ��K���ڷ���Karhunen-Loeve�任���ͼ����з�����Ի�ýϺõ�Ч����ʵ�ֺ���״����������
�ؼ��ʣ��������μ��⺸�������������ɽ����������ࣻ�ȶ���
(Edited by Sai-qian YUAN)
Foundation item: Project (51175095) supported by the National Natural Science Foundation of China; Projects (10251009001000001, 9151009001000020) supported by the Natural Science Foundation of Guangdong Province, China; Project (20104420110001) supported by the Specialized Research Fund for the Doctoral Program of Higher Education of China
Corresponding author: Xiang-dong GAO; Tel: +86-13711457326; Fax: +86-20-85215998; E-mail: gaoxd666@126.com
DOI: 10.1016/S1003-6326(13)62925-8
Abstract: Classification of plume and spatter images was studied to evaluate the welding stability. A high-speed camera was used to capture the instantaneous images of plume and spatters during high power disk laser welding. Characteristic parameters such as the area and number of spatters, the average grayscale of a spatter image, the entropy of a spatter grayscale image, the coordinate ratio of the plume centroid and the welding point, the polar coordinates of the plume centroid were defined and extracted. Karhunen-Loeve transform method was used to change the seven characteristics into three primary characteristics to reduce the dimensions. Also, K-nearest neighbor method was used to classify the plume and spatter images into two categories such as good and poor welding quality. The results show that plume and spatter have a close relationship with the welding stability, and two categories could be recognized effectively using K-nearest neighbor method based on Karhunen-Loeve transform.
