

J. Cent. South Univ. (2020) 27: 2465-2478
DOI: https://doi.org/10.1007/s11771-020-4462-3

Experimental study on aerodynamic characteristics of a high-speed train on viaducts in turbulent crosswinds
HE Xu-hui(�����)1, 2, 3, ZUO Tai-hui(��̫��)1, ZOU Yun-feng(���Ʒ�)1, 2, 3,YAN Lei(����)1, 2, 3, TANG Lin-bo(���ֲ�)1
1. School of Civil Engineering, Central South University, Changsha 410075, China;
2. National Engineering Laboratory for High-speed Railway Construction, Changsha 410075, China;
3. Joint International Research Laboratory of Key Technology for Rail Traffic Safety, Changsha 410075, China
 Central South University Press and Springer-Verlag GmbH Germany, part of Springer Nature 2020
Abstract:
In this study, experiments were carried out to investigate aerodynamic characteristics of a high-speed train on viaducts in turbulent crosswinds using a 1:25 scaled sectional model wind-tunnel testing. Pressure measurements of two typical sections, one train-head section and one train-body section, at the windward and leeward tracks were conducted under the smooth and turbulence flows with wind attack angles between -6�� and 6��, and the corresponding aerodynamic force coefficients were also calculated using the integral method. The experimental results indicate that the track position affects the mean aerodynamic characteristics of the vehicle, especially for the train-body section. The fluctuating pressure coefficients at the leeward track are more significantly affected by the bridge interference compared to those at the windward track. The effect of turbulence on the train-head section is less than that on the train-body section. Additionally, the mean aerodynamic force coefficients are almost negatively correlated to wind attack angles, which is more prominent for vehicles at the leeward track. Moreover, the lateral force plays a critical role in determining the corresponding overturning moment, especially on the train-body section.
Key words:
Cite this article as:
HE Xu-hui, ZUO Tai-hui, ZOU Yun-feng, YAN Lei, TANG Lin-bo. Experimental study on aerodynamic characteristics of a high-speed train on viaducts in turbulent crosswinds [J]. Journal of Central South University, 2020, 27(8): 2465-2478.
DOI:https://dx.doi.org/https://doi.org/10.1007/s11771-020-4462-31 Introduction
A high-speed railway offers a fast, robust travel option that enhances the movement of people and serves as the main artery of the national economy as well as the significant national infrastructure system [1]. The total track mileage of the high-speed railway in service is currently over 35000 km in China. Around half of these track mileages are on bridges of different spans and types, in which the major part is comprised of standard simply-supported box girder bridges. Wind-induced accident for a high-speed train (HST) is not uncommon. Aerodynamic forces induced by crosswinds are important to the lateral equilibrium of the HST, in such a way that if the lateral wind speed becomes larger than a threshold value, an overturning of the HST can occur. The degree of danger with respect to overturning increases when the HST is on a viaduct. The reason for this is that the HST is submerged in the separated flow induced by the viaduct, which causes the aerodynamic forces to be complicated and quite different from those of the HST on the ground, leaving aside the fact that the wind velocity in the atmospheric boundary layer grows as the height increases [2].
The approaching flow under the atmospheric boundary layer is always in a turbulent state, and the smooth flow is usually not present in a full scale. Focusing on the aerodynamic characteristics of the HST, wind tunnel tests are normally performed on the stationary train model in the smooth flow, because they are more reliable and repeatable than experiments in the turbulent flow. However, atmospheric turbulence may worsen the aerodynamic performance of the train [3], and the use of mean force coefficient in the smooth flow together with characteristics of atmospheric turbulence is likely to give a conservative estimate of the peak moment that could be expected due to atmospheric turbulence [4].
In recent years, many wind tunnel tests with scaled models have been conducted on the effect of atmospheric turbulence on the aerodynamic characteristics of a train at different yaw angles. SCHROK et al [5] found that an increase in turbulence level goes along with a smaller dead wake area and vortices for the railway vehicle. BOCCIOLONE et al [6] reported that the aerodynamic coefficient of the railway vehicle on a viaduct (especially for the higher yaw angle) is significantly influenced by the turbulence characteristics, and the lateral force coefficient measured in the turbulent flow is lower than that measured in a smooth flow. CHELI et al [7] researched the influence of turbulence on the lightweight railway vehicle��s aerodynamic performance with a yaw angle of 30��-90��. NIU et al [3] found that the turbulence intensity has a significant influence on the train��s mean and fluctuating aerodynamic force and pressure coefficients at the zero yaw angle. MA et al [8] investigated the aerodynamic characteristics of a train on a steel-truss girder at the yaw angle of 90�� under two different turbulent flow fields. However, research on the influence of turbulence on aerodynamic characteristics of HST on viaducts at the yaw angle of 90�� is rarely conducted. Therefore, it is worthwhile to study the aerodynamic characteristics of HST on viaducts in turbulent crosswinds.
In this study, scaled wind tunnel tests were carried out to investigate the aerodynamic characteristics of the HST on a typical simply supported box girder viaduct in the smooth and two different turbulence flows. Pressure measurements of the two typical train-head and train-body sections at the windward and leeward tracks considering different wind attack angles were conducted. The mean and fluctuating aerodynamic pressures and forces on the HST under all test conditions were then examined.
2 Experimental setup
2.1 Measurement system
The sectional model tests were performed in the high-speed test section of a high-speed railway wind tunnel (CSU-1) at Central South University, China. The test section is 15.0 m long, 3.0 m wide, and 3.0 m high. The mean wind speed of the empty wind tunnel ranges from 5 to 94 m/s, and the corresponding turbulence intensity is less than 0.5% [2, 3].
The CRH2 HST, which is widely used in China, on a standard simply supported box girder bridge with a span of 32 m was selected as the object of study. In real operation, the HST on the bridge will experience different wind attack angles (the upward direction is positive), depending on the topography type where the train and bridge are located. It is recommended that the range of wind attack angles in scaled wind tunnel simulations for the train-bridge system should be taken into account between -3�� and 3�� for the flat topography (coastal areas or flat plains) and between -5�� and 5�� for typical mountainous areas [9]. Therefore, the wind attack angles between -6�� and 6�� were considered in this study, namely, -6��, -4��, -2��, 0��, 2��, 4�� and 6��.
In order to meet the requirement that the blockage ratio for the train-bridge model in the wind tunnel is less than 5% in all test conditions [4, 9], only the leading car model, including different cross-sections of train head and train body, instead of the traditional three-car model was considered in this experiment.
The sectional model of both the HST and the bridge, which was made of plastic, was constructed at a geometric scale of 1:25 as a compromise for the mentioned blockage ratio as well as the model manufacturing and measurement errors. The lengths of the HST model and the bridge model were 1.028 m and 1.5 m, respectively, so the spacing between the ends of the HST model and the bridge model was approximately 0.25 m (about 6.25 m in a full scale). The end of the bridge model may affect the aerodynamic pressure and force on the HST model due to unrealistic three-dimensional effects. Thus, two endplates were installed at both ends of the bridge model to minimize this effect. The maximum blocking ratio of the train-bridge system at the wind attack angle of 6�� in the wind tunnel test was 3.5% (less than 5%).
The arrangements of the HST model on the bridge model are shown in Figure 1.
The details of the measurement sections and the pressure holes of the HST are given in Figure 2. The HST height (h) and HST width (b) changed along with the vehicle, and two typical pressure measurement sections on the HST model were selected, which were classified and described as train-head and train-body sections. The distances of train-head and train-body sections apart from the train head nose were 0.1L and 0.53L, respectively (as shown in Figure 2(a)). The train-head section had 18 pressure holes with different spaces, and the height and width of the train-head section were 90 and 123.6 mm, respectively. The train-body section had corresponding 17 pressure holes with different spaces, and the height and width of the train-body section were 140 and 135.2 mm, respectively.
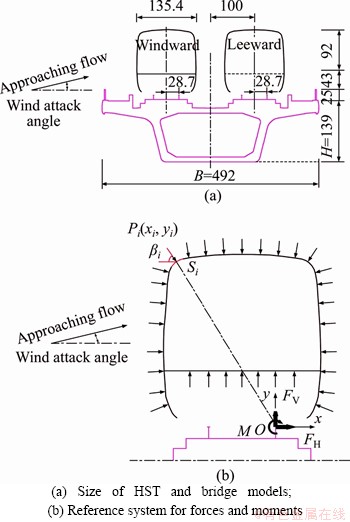
Figure 1 Arrangements of HST model on bridge model (unit: mm):
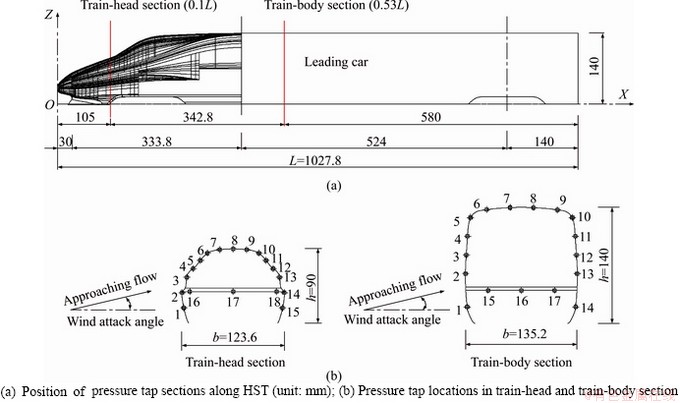
Figure 2 Position of pressure tap sections along HST and pressure holes of measurement section:
The surface pressure taps at the train-head and train-body sections were measured simultaneously using a multichannel pressure measurement system. The electronic pressure scanners (ESP-64HD, Pressure Systems Inc.) were mounted inside the HST model. Each scanner had 64 measuring ports, and the maximum measure pressure range was about �� 2500 Pa. The precision could reach �� 0.1% F.S. (about �� 2.5 Pa), and the scanning rate could be up to 20000 points/s. Each scanner was connected via a cable to the digital service module (DSM3400, Scanivalve Corp.). The volume of each pressure transducer was 45 mm3. The lengths of the tubes ranged from 200 to 500 mm, and the internal diameter of the tube was 1.2 mm in this study. The sampling frequency of the pressure was set to 312.5 Hz, and the data length of each measurement had a sampling time of 20000 samples per channel.
The wind speed was measured simultaneously with the pressure using one cobra probe (Series 100, Turbulence Flow Company), which was installed above the pressure measurement sections. The cobra probe was a four-hole pressure probe that provided dynamic, three-component velocity and local static pressure measurements in real-time, and it was capable of a linear frequency-response ranging from 0 Hz to more than 2 kHz. The cobra probe for the wind tunnel test was available for various ranges between 2 and 40 m/s, and it was able to measure flow angles in a ��45�� cone. The sampling frequency of the wind speed was set to 2500 Hz. Figure 3 shows a photo of the experimental setup.
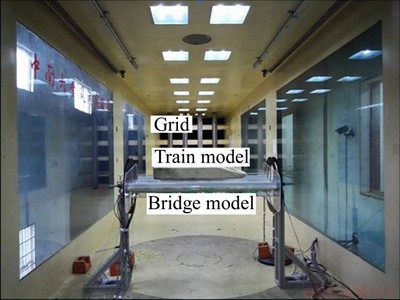
Figure 3 HST and bridge models in CSU-1 wind tunnel
2.2 Wind flow characteristic
Expect for the smooth flow (the longitudinal turbulence intensity is less than 0.5%), two types of grid-generated turbulent wind fields were also simulated in the tests, which were classified and described as low-turbulence and high-turbulence flows. The low-turbulence wind field was generated using every five rectangular grids in horizontal and vertical directions, and the height and width of the rectangular grid were 300 and 15 cm, respectively. The high-turbulence wind field was achieved using every three rectangular grids in horizontal and vertical directions, and the height and width of the rectangular grid were 300 and 25 cm, respectively. The grid-generated turbulent wind fields had a mean wind speed of 10 m/s.
The measured longitudinal turbulence intensities were, respectively, 13.5% and 23.3% in the low-turbulence and high-turbulence flows, while the measured longitudinal turbulence integral scales were 0.357 and 0.532 m, respectively. The power spectral density of grid-generated turbulence in a wind tunnel can be well fitted by the von Karman spectrum [10]. The longitudinal Simiu spectrum [11] is used when the turbulence spectrum with respect to the transportation field in China [9] is discussed. The von Karman spectrum and Simiu spectrum are respectively expressed as follows:
 (1)
(1)
 (2)
(2)
where fL=fLux/U is the non-dimensional frequency; Lux is the longitudinal turbulence integral scale; f is the engineering frequency; U is the mean wind speed; z is the fitting height parameter; ��u2 is taken to 6 according to the feature of Simiu spectrum.
Based on the HST height of 0.14 m and the approaching mean wind speed of 10 m/s, the Reynolds number was 9.5��104 (~105) for this experiment. However, it is perhaps worth noting that the Reynolds numbers of the experiments presented in this paper are lower than the corresponding full-scale values (~108) and slightly below the critical Reynolds number values of 2 to 2.5��105 recommended by the railway standards for stationary wind tunnel tests in the smooth flow [4, 12]. However, for Reynolds numbers such as those achieved in this test, previous work has found that small Reynolds number effect affects the coefficients of lift and lateral force in the presence of turbulent crosswinds [13], and there are no significant Reynolds number effects for the railway vehicle of the ETR 480 train in the range of 1��105< Re<2��105 [6]. In terms of Reynolds number approximation, the level of accuracy of the wind tunnel tests in smooth and turbulent flows reported here is not lower than that typically achieved in conventional wind tunnel tests [2, 12].
Figure 4 displays the longitudinal normalized wind spectra in the low-turbulence flow. The results depicted in Figure 4 suggest that the measured wind spectrum can be well approximated by the von Karman spectrum. The longitudinal wind spectrum also fit well with the Simiu spectrum. Therefore, the frequency content of the two grid-generated turbulence flows can meet the requirements of the wind tunnel tests and the specifications in the transportation field.
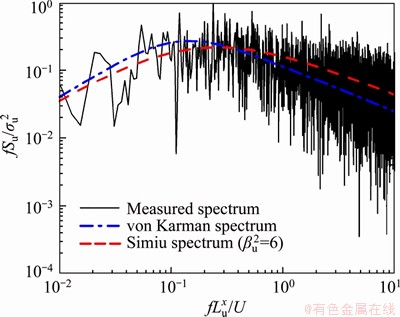
Figure 4 Longitudinal wind spectra in low-turbulence flow
3 Results and discussion
3.1 Wind pressure coefficient
The instantaneous wind pressure coefficient is defined as follows:
 (3)
(3)
where Pi (t) is the pressure measured by pressure tap i; P0 is the measured static pressure of the wind tunnel using the side holes of the Pitot tube; and �� is the air density, which is set to 1.225 kg/m3. The unsteady pressure coefficient can be characterized by the time-averaged pressure coefficient  and the standard deviation of the pressure coefficient
  .
.
According to summaries in Refs. [14, 15], corrections of measured wind pressures can be made using the theoretical equations of Bergh- Tijdeman. The amplitude and phase of the transfer functions with different lengths in the frequency domain are shown in Figures 5(a) and (b). The slope of phase versus the frequency is almost linear, and the amplitude error is found to be less than 5% at low frequencies (below 25 Hz). Thus, the effects of pressure tube on the magnitude of pressure were neglected in this study.
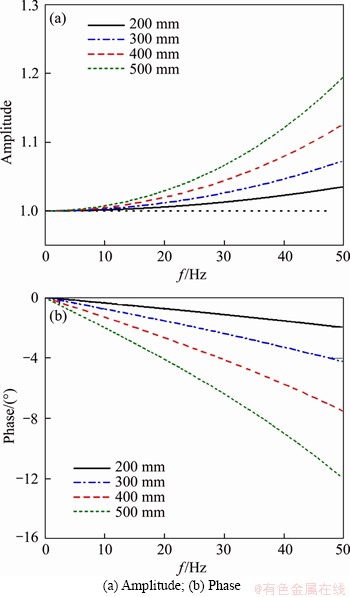
Figure 5 Transfer functions of pressure tube with different lengths:
3.2 Mean aerodynamic coefficient of vehicle section
The mean lateral force coefficient  vertical force coefficient
 and overturning moment coefficient
 in the body axis coordinate system (as shown in Figure 1(b)) are calculated as shown below:
 (4)
(4)
 (5)
(5)
 (6)
(6)
where Si is the integral length of the pressure tap i; ��i is the angle of the pressure tap i; (xi, yi) is the coordinates of pressure tap i in the body axis coordinate system.
3.3 Contribution of each part to mean aerodynamic force coefficient
The relative contribution of the upward, top, downward, and bottom parts of the HST section, to the overall  (F=H, V or M) is evaluated as follows:
 (7)
(7)
where  (W=upward, top, downward or bottom) indicates the mean aerodynamic force coefficients from the upward, top, downward, and bottom surfaces of the HST section, respectively.
4 Results and discussion
4.1 Mean pressure coefficient of HST
Figure 6 shows the mean pressure coefficients of the HST at the windward and leeward tracks at the zero wind attack angle under different conditions of train section shape and wind field flow. The mean pressure coefficient distributions on both train-head and train-body sections at the windward track are somewhat different, while those at the leeward track are similar. The maximum absolute negative mean pressure coefficient of the train-head section at the windward track (Point 6) is significantly greater than that of the train-body section (Point 5). In addition, the maximum positive mean pressure coefficient of the train-head section at the windward track is less than that of the train-body section, and the range of positive pressure on the upward surface of the train-head section (Points 1 and 2) is smaller than that of the train-body section (Points 1-4). It should also be noted that the taps of maximum absolute negative mean pressure coefficients of the train-head section at both windward and leeward tracks are numbered 6, while those of the train-body section are Point 5 and Point 6, respectively. One possible reason is that the train-head section is more streamlined compared to the train-body section.
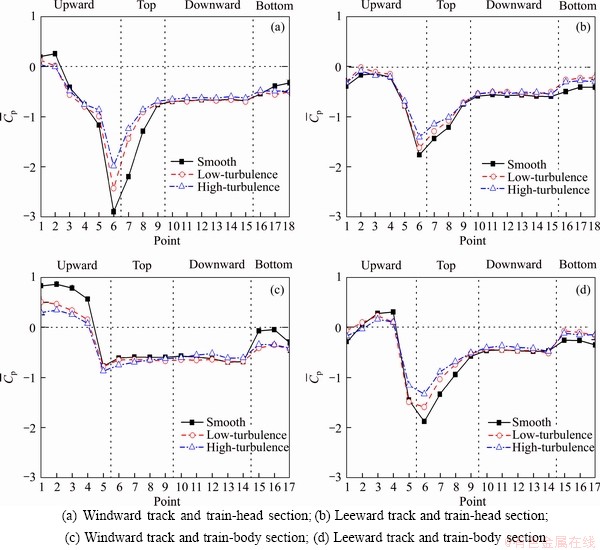
Figure 6 Mean pressure coefficients of HST at zero wind attack angle:
In general, the oncoming turbulence does not change the overall variation in mean pressure coefficients under various conditions. The oncoming turbulence has a more significant effect on the mean pressure coefficient at the windward track, especially the upward and top surfaces, but a less pronounced effect on that at the leeward track. The reason for this phenomenon is that the HST at the leeward track is immersed in the wake of the upstream bridge, and the bridge-induced turbulence is also considerable. It also can be seen from Figure 6(c) that the positive mean pressure coefficient on the upward surface at the windward track under the smooth flow is larger than that under the turbulence flow. It may be due to the fact that the spatial correlation of the smooth flow (the turbulence intensity is less than 0.5%) is larger than that of the turbulence flow. Besides, the maximum absolute negative mean pressure coefficient under the smooth flow is larger than that under the turbulence flow, and the absolute values increase with the decrease of turbulence. This phenomenon has also been observed in past studies [3, 5, 16]. The possible reason for this is that an increase in turbulence intensity leads to a significant increase in the boundary layer and in the turbulence kinetic energy, which enhances the ability of the flow around the adjacent zone of the upward and top surfaces to resist negative pressure.
4.2 Fluctuating pressure coefficient of HST
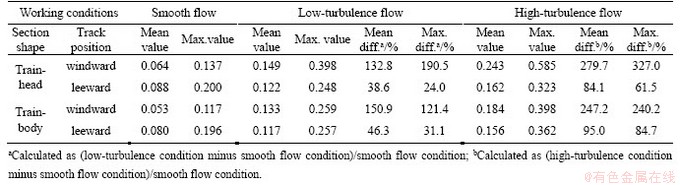
Figure 7 shows the standard deviations of pressure coefficients of the HST at the windward and leeward tracks at the zero wind attack angle under different conditions of train section shape and wind field flow. The mean and maximum standard deviations of pressure coefficients are also summarized in Table 1 for quantifying the influence of section shape and turbulence.
The highest fluctuation always occurs at the top corner of the upward surface (Point 6 for the train-head section and Point 5 for the train-body section), except the condition of smooth flow and windward track in which the taps of maximum standard deviations of pressure coefficient are numbered 7 for the train-head section and numbered 6 for the train-body section. The fluctuating pressure coefficient of the train-head section at the windward track under different flow conditions is overall greater than that of the train- body section, while the difference between train- head and train-body sections at the leeward track is not obvious.
The standard deviation of the pressure coefficient for almost points is the largest under the high-turbulence flow, followed by the low- turbulence flow and the smooth flow. Obviously, this is mainly due to the different oncoming turbulence intensities.
Compared with low standard deviations at most points at the windward track under the smooth flow, it is clear that the standard deviations at Points 6-8 for the train-head section and Points 5-7 for the train-body section, which are located within the adjacent zone of the upward and top surfaces, are slightly larger than those at their neighboring points. This phenomenon is attributed to the vortex shedding from the relevant corner.
The maximum standard deviations of pressure coefficients on both the train-head and train-body sections at the leeward track under the smooth flow are pronounced compared to those at the windward track. It indicates that the bridge interference is equivalent to bridge-induced turbulence for the leeward track, which enhances the local oncoming turbulence.
As can be observed from Table 1, the percentage difference between the smooth flow and turbulence flow at the windward track is higher than that at the leeward track. An example of this phenomenon is that the mean and maximum percentage differences of the train-head section at the windward track between smooth flow and low-turbulence flow are 132.8% and 190.5%, respectively, while the corresponding percentage differences at the leeward track are only 38.6% and 24%, respectively. Therefore, the effects of turbulence at the windward track are significantly different from those at the leeward track, mainly due to bridge-induced turbulence.
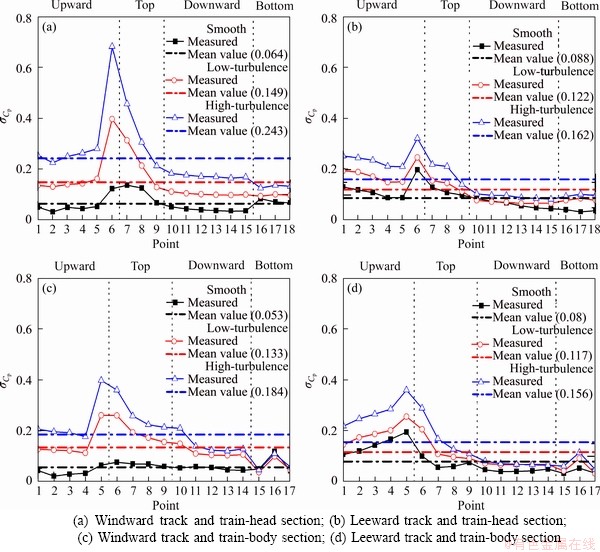
Figure 7 Standard deviations of pressure coefficients of HST at zero wind attack angle:
Table 1 Statistics of standard deviations of pressure coefficient
4.3 Mean aerodynamic force coefficient of HST
Figure 8 shows the mean aerodynamic force coefficients of the HST in the range of wind attack angles between -6�� and 6��. Wind attack angles affect mean aerodynamic force coefficients of the HST, which is more prominent for vehicles at the leeward track. In general, the mean aerodynamic force coefficients are almost negatively correlated to wind attack angles.The larger the wind attack angle, the lower the mean aerodynamic force coefficient. This is no doubt due to the fact that when the wind attack angle is positive, the HST is located with the separated region of the flow over the bridge, where the flow velocity is significantly smaller than the oncoming flow. At the same time, the train section shape and turbulence influence the mean aerodynamic force coefficients at the windward and leeward tracks, and partly alter the changing trend of these coefficients.
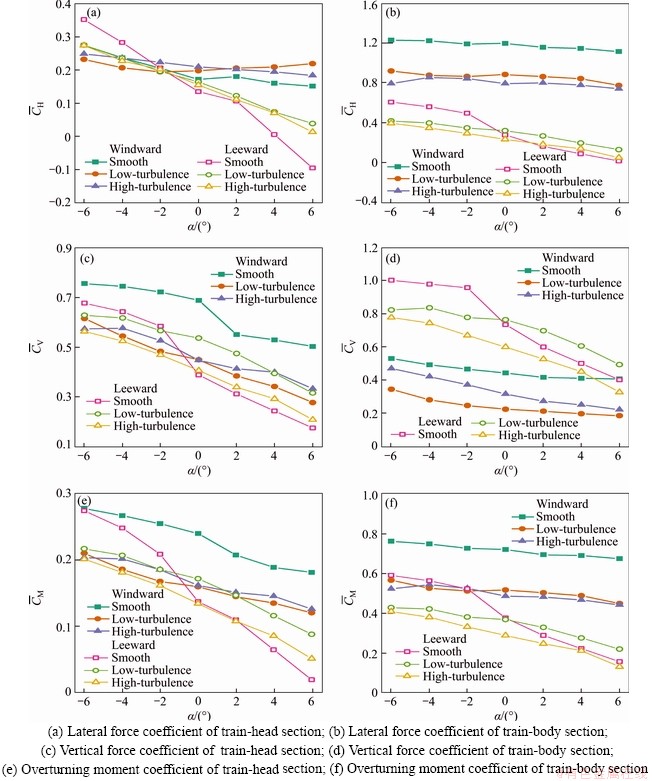
Figure 8 Mean aerodynamic force coefficients of HST in range of wind attack angles between -6�� and 6��:
The mean lateral force coefficient of the train-head section in the range of wind attack angles between -6�� and 6�� is significantly smaller than that of the train-body section. This is attributed to the fact that the train-head section is somewhat streamlined, while the train-body section is blunt. In addition, the mean lateral force coefficient of the train-head section at the windward track is larger than that at the leeward track in the range of wind attack angles between -2�� and 6��, while the mean lateral force coefficient of the train-head section at the windward track is always larger in the interested range of wind attack angle. This is because the wind velocity acting on the vehicle at the leeward track is smaller than that at the windward track. It can also be seen that the mean lateral force coefficient of the train-body section at the windward track in the interested range of wind attack angle under the smooth flow is always larger than that under the turbulence flow. This observation is consistent with the results present in the published literature at the zero wind attack angle [6]. This may be due to the influence of the mean positive pressure coefficient on the upward surface (as shown in Figure 6(c)). The mean positive pressure coefficient on the upward surface under the smooth flow is evidently larger than that under the turbulence flow, which leads to a larger lateral force coefficient under the smooth flow. The mean vertical force coefficient of the train-head section at the windward track is larger than that of the train-body section, while the value at the leeward track is smaller than that of the train-body section. Additionally, the mean vertical force coefficient of the train-head section at the windward track is similar to that at the leeward track in the interested range of wind attack angle, while the mean vertical force coefficient of the train-body section at the windward track is always smaller than that at the leeward track in the range of wind attack angles between -6�� and 4��. As can be observed, the mean vertical force coefficient of both train-head and train-body sections at the windward track in the interested range of wind attack angle under the smooth flow is also larger than that under the turbulence flow.
For the mean overturning moment coefficient, the value of the train-head section is smaller than that of the train-body section. This law is consistent with the mean lateral force coefficient. In addition, the mean overturning coefficient of the train-head section at the windward track is similar to that at the leeward track in the interested range of wind attack angle, and it is similar to the mean vertical force coefficient of the train-head section. The mean overturning moment coefficient of the train-body section at the windward track is generally larger than that at the leeward track, which is in accordance with the mean lateral force coefficient of the train-body section. At the same time, the mean overturning moment coefficients of both train-head and train-body sections at the windward track in the interested range of wind attack angle under the smooth flow are always larger than those under the turbulence flow. The overturning moment of the vehicle comes from the lateral force and the vertical force, but its law on the train-head section performs differently from it does on the train-body section. The mean overturning moment of the train-head section behaves like its mean vertical force, while the mean overturning moment of the train-body section behaves like its mean lateral force.
4.4 Contribution of each part to mean train-head force coefficient
Figure 9 shows the contribution of the four surface parts on three mean aerodynamic force coefficients of the train-head section under the high-turbulence flow. The lateral forces of the train-head section at both windward and leeward tracks consist mainly of pressure or force on the upward and downward surfaces, and the contribution of the top surface to the lateral force is very negatively limited. The contribution of the downward part is positive, while that of the upward part is negative, and the percentage of the downward part is always larger than that of the upward part. Additionally, the wind attack angle influences the percentage of these two parts, and their contributions increase as the wind attack angle increases. Compared with the contributions at the windward track, the percentages of both upward and downward parts at the leeward track are more sensitive to the wind attack angle. The contribution of the downward part to the lateral force coefficient at the leeward track at the wind attack angle of 6��, can reach 4123.8%, which is nearly 10 times greater than that at the windward track.
Unlike the case of the lateral force, all four parts have a non-negligible contribution to the vertical force. The contribution of the bottom part to the vertical force is negative, while that of the other three parts is positive. Being the two largest components, the upward and top components contribute similarly, and the contribution of the downward surface is the smallest, especially at the windward track. In addition, the influence of wind attack angle on the contribution of the mean vertical force is similar to that of the mean lateral force. An example is that the absolute value of the contribution of the bottom part at the leeward track increases from 30.3% to 203.0%, with the wind attack angle increasing from -6�� to 6��, while that at the windward track increases from 90.1% to 161.5%.
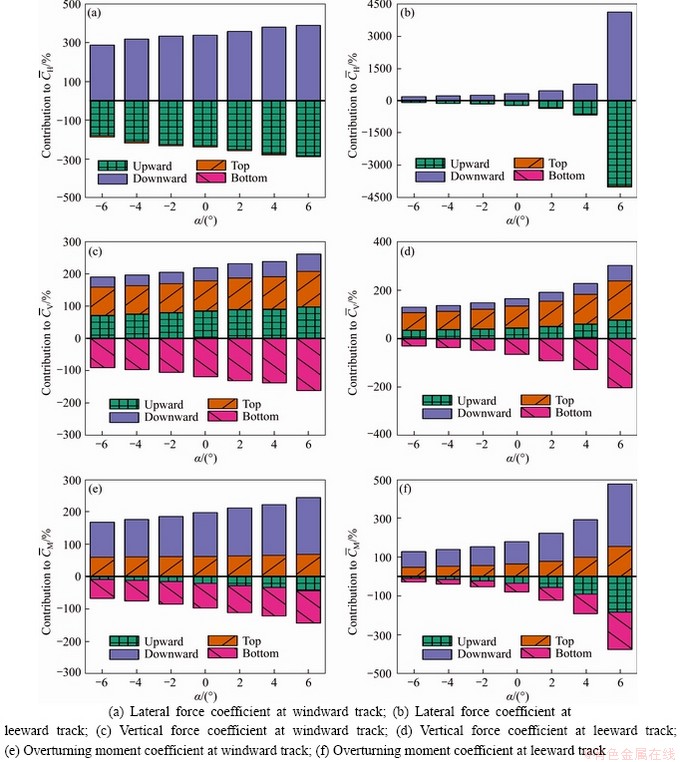
Figure 9 Contribution of each part to mean aerodynamic force coefficients of train-head section in the range of wind attack angles between -6�� and 6��:
Similar to the case of vertical force, the contributions of the four parts to the overturning moment cannot be ignored. The contributions of the top and downward parts to the overturning moment are positive, while those of the upward and bottom parts are negative. The contribution of the downward part is the greatest among the four parts, followed by the bottom part. It can be seen that the influence of wind attack angle on the contribution of the mean overturning moment is similar to that on mean lateral force and vertical force.
4.5 Contribution of each part to mean train- body force coefficient
Figure 10 shows the contribution of the four parts on three mean aerodynamic force coefficients of the train-body section under the high-turbulence flow. There are some differences in the rules for the contribution of parts compared to the train-head section.
The lateral force of the train-body section is still mainly contributed by the upward and downward parts. The results at the leeward track are similar to those of the train-head section. However,both the upward and downward components at the windward track contribute positively to the lateral force, and the downward part contributes much more than the upward part, which is different from that of the train-head section. The relationship between the absolute contribution value of upward and downward parts and wind attack angle when train at the leeward track is also similar to that of the train-head section, while the wind attack angle when train at the windward track has no obvious influence on their contributions.
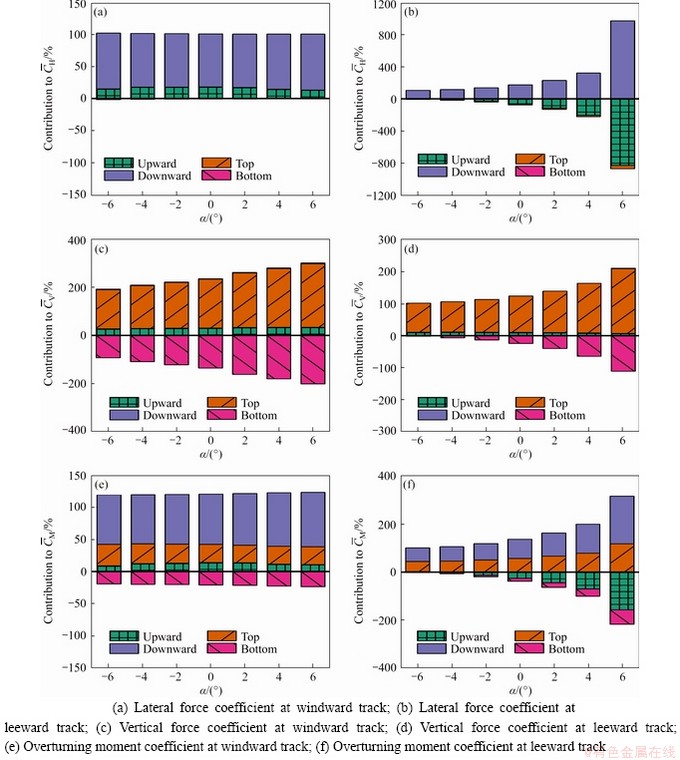
Figure 10 Contribution of each part to mean aerodynamic force coefficients of train-body section in the range of wind attack angles between -6�� and 6��:
Unlike the case of the vertical force of the train-head section, the contribution of the downward part to the vertical force of the train-body section can be ignored, and the contribution of the upward part is also small, and it can even be ignored at the leeward track. This phenomenon is attributed to the fact that the upward and downward surfaces of the train-body section are very steep, and the corresponding force components in the vertical direction are also small. The contribution of the top part is positive, while that of the bottom part is negative, and the percentage of the top part is always larger than that of the bottom part. Additionally, the absolute contribution values of the top and bottom parts increase with the increase of wind attack angle.
The overturning moment of the train-body section is still contributed by these four parts. The results at the leeward track are similar to those of the train-head section. However, the upward component at the windward track contributes positively to the overturning moment, which is different from that of the train-head section. The relationship between the absolute contribution value of the four parts and wind attack angle when train at the leeward track is similar to that of the train-head section, while the wind attack angle when train at the windward track has no evident influence on their contributions. This phenomenon is similar to that of lateral force, which indicates that the lateral force of the train-body section plays a critical role in determining its overturning moment.
5 Conclusions
1) The track position affects the mean aerodynamic characteristics of the HST, especially for the train-body section. The mean lateral force and overturning moment coefficients of the train-head section at the windward track are generally greater than those at the leeward track, and the vertical force coefficients at the windward track are generally smaller than those at the leeward track.
2) The fluctuating pressure coefficients at the leeward track are significantly affected by the bridge interference compared to that at the windward track. The effect of turbulence on the train-head section is less than that on the train-body section.
3) The mean aerodynamic force coefficients of the HST are affected by wind attack angles, and the mean aerodynamic force coefficients are almost negatively correlated to wind attack angles, which is more prominent for vehicles at the leeward track.
4) The upward and downward parts mainly contribute to the lateral force of the HST. Four parts have a non-negligible contribution to the vertical force of the train-head section, while only the top and bottom parts significantly contribute to the vertical force of the train-body section. The lateral force plays an important role in determining the corresponding overturning moment, especially on the train-body section.
References
[1] YAN Bin, DAI Gong-lian, HU Nan. Recent development of design and construction of short span high-speed railway bridges in China [J]. Engineering Structures, 2015, 100: 701-717. DOI: 10.1016/j.engstruct.2015.06.050.
[2] HE Xu-hui, ZOU Yun-feng, WANG Han-feng, HAN Yan, SHI Kang. Aerodynamic characteristics of a trailing rail vehicles on viaduct based on still wind tunnel experiments [J]. Journal of Wind Engineering and Industrial Aerodynamics, 2014, 135: 22-33. DOI: 10.1016/j.jweia. 2014.10.004.
[3] NIU Ji-qiang, ZHOU Dan, LIANG Xi-feng. Experimental research on the aerodynamic characteristics of a high-speed train under different turbulence conditions [J]. Experimental Thermal and Fluid Science, 2017, 80: 117-125. DOI: 10.1016/j.expthermflusci.2016.08.014.
[4] European Committee for Standardization. EN 14067-6:2018 railway applications-aerodynamics-Part 6: Requirements and test procedures for cross wind assessment [S]. Brussels, Belgium: CEN, 2018.
[5] SCHROCK D, WIDDECKE N, WIEDEMANN J. The effect of high turbulence intensities on surface pressure fluctuations and wake structures of a vehicle model [J]. SAE International Journal of Passenger Cars Mechanical Systems, 2009, 2(1): 98-110. DOI: 10.4271/2009-01-0001.
[6] BOCCIOLONE M, CHELI F, CORRADI R, MUGGIASCA S, TOMASINI G. Crosswind action on rail vehicles: Wind tunnel experimental analyses [J]. Journal of Wind Engineering and Industrial Aerodynamics, 2008, 96(5): 584-610. DOI: 10.1016/j.jweia.2008.02.030.
[7] CHELI F, GIAPPINO S, ROSA L, TOMASINI G, VILLANI M. Experimental study on the aerodynamic forces on railway vehicles in presence of turbulence [J]. Journal of Wind Engineering and Industrial Aerodynamics, 2013, 123: 311-316. DOI: 10.1016/j.jweia.2013.09.013.
[8] MA Cun-ming, DUAN Qing-song, LI Qiu-sheng, CHEN Ke-jian, LIAO Hai-li. Buffeting forces on static trains on a truss girder in turbulent crosswinds [J]. Journal of Bridge Engineering, 2018, 23(11): 04018086. DOI: 10.1061/ (ASCE)BE.1943-5592.0001305.
[9] Ministry of Transportation and Communication of PRC. JTG/T 3360�C01-2018: Wind-resistant design specification for highway bridges [S]. Beijing, China: China Communications Press Co., Ltd., 2018. (in Chinese)
[10] von KARMAN T. Progress in the statistical theory of turbulence [J]. Proceedings of the National Academy of Sciences of the United States of America, 1948, 34: 530-539. DOI: 10.1073/pnas.34.11.530.
[11] SIMIU E, YEO D H. Wind effects on structures: modern structural design for winds [M]. 4th ed. New York, USA: John Wiley & Sons, Inc., 2019. DOI: 10.1002/ 9781119375890.
[12] DORIGATTI F, STERLING M, BAKER C J, QUINN A D. Crosswind effects on the stability of a model passenger train��A comparison of static and moving experiments [J]. Journal of Wind Engineering and Industrial Aerodynamics, 2015, 138: 36-51. DOI: 10.1016/j.jweia.2014.11.009.
[13] BAKER C J. Train aerodynamic forces and moments from moving model experiments [J]. Journal of Wind Engineering and Industrial Aerodynamics, 1986, 24(3): 227-251. DOI: 10.1016/0167-6105(86)90024-3.
[14] BERGH H, TIJDEMAN H. Theoretical and experimental results for the dynamic response of pressure measuring systems [R]. Amsterdam, Netherlands: Nationaal Lucht-en Ruimtevaartlaboratorium, 1965. http://refhub.elsevier.com/ S0167-6105(16)30020-4/sbref2.
[15] YAN Lei, ZHU Le-dong, FLAY R G J. Span-wise correlation of wind-induced fluctuating forces on a motionless flat-box bridge deck [J]. Journal of Wind Engineering and Industrial Aerodynamics, 2016, 156: 115-128. DOI: 10.1016/j.jweia. 2016.07.004.
[16] TAMURA T, ONO Y. LES analysis on aeroelastic instability of prisms in turbulent flow [J]. Journal of Wind Engineering and Industrial Aerodynamics, 2003, 91: 1872-1846. DOI: 10.1016/j.jweia.2003.09.032
(Edited by YANG Hua)
���ĵ���
��������и����ϸ����г����������������о�
ժҪ���������߱�Ϊ1:25�Ľڶ�ģ�ͷ綴���飬����������и����ϸ����г����������Խ����о����ھ����������������£���-6����6��繥�Ƿ�Χ��ӭ��ͱ������ϵĵ��ͳ�ͷ�ͳ���������в�ѹ���飬�����û��ַ�������Ӧ��������ϵ����ʵ�������������λ�öԸ����г���ƽ������������Ӱ�죬�ر��ǶԳ��������ƽ���������ԡ���ӭ��������ȣ���������������ѹ������������Ӱ�����ԡ������Գ�ͷ�����Ӱ��С����Գ��������Ӱ�졣�г���ͷƽ��������ϵ����繥�Ǽ����ʸ���أ��������ϵij�ͷ����������ˡ����⣬�������ھ�����Ӧ���г�ͷ���㸲����ʱ���Źؼ����ã������ǶԳ������档
�ؼ��ʣ������г������ţ��������ԣ�������磻�繥�ǣ��г�������ʽ�����λ�ã���ѹ����
Foundation item: Projects(51808563, 51925808) supported by the National Natural Science Foundation of China; Project(KLWRTBMC18-03) supported by the Open Research Fund of the Key Laboratory of Wind Resistance Technology of Bridges of China; Project(2017YFB1201204) supported by the National Key R & D Program of China
Received date: 2020-04-15; Accepted date: 2020-07-16
Corresponding author: YAN Lei, PhD, Lecturer; Tel: +86-18817367859; E-mail: leiyan@csu.edu.cn; ORCID: https://orcid.org/0000- 0003-3688-8673
Abstract: In this study, experiments were carried out to investigate aerodynamic characteristics of a high-speed train on viaducts in turbulent crosswinds using a 1:25 scaled sectional model wind-tunnel testing. Pressure measurements of two typical sections, one train-head section and one train-body section, at the windward and leeward tracks were conducted under the smooth and turbulence flows with wind attack angles between -6�� and 6��, and the corresponding aerodynamic force coefficients were also calculated using the integral method. The experimental results indicate that the track position affects the mean aerodynamic characteristics of the vehicle, especially for the train-body section. The fluctuating pressure coefficients at the leeward track are more significantly affected by the bridge interference compared to those at the windward track. The effect of turbulence on the train-head section is less than that on the train-body section. Additionally, the mean aerodynamic force coefficients are almost negatively correlated to wind attack angles, which is more prominent for vehicles at the leeward track. Moreover, the lateral force plays a critical role in determining the corresponding overturning moment, especially on the train-body section.
