
J. Cent. South Univ. (2012) 19: 770-776
DOI: 10.1007/s11771-012-1070-x![]()
Sensitivity to electricity consumption in urban business and
commercial area buildings according to climatic change
LEE Kang-guk1, KIM Sung-bum2, HONG Won-hwa2
1. Research Center for Urban Affair, Kyungil University, No 425 18 / 33 Buho-ri Hayang-up, Gyeongbuk, Korea;
2. School of Architecture, Kyungpook National University, 1370 Sangyeok-dong Buk-gu Daegu, Korea;
? Central South University Press and Springer-Verlag Berlin Heidelberg 2012
Abstract:
Recently, urban high temperature phenomenon has become a problem which results from human activities, the increase in energy consumption, and land-cover change in urban areas. As extremely hot weather caused by urban high temperature continues, demand for power is increased and results in the degradation of electricity reserves. The current trend in climate change, regardless of the summer and winter power demand, is likely to have much effect on the power demand. Thus, sensitivity to electricity consumption in urban areas due to climate change was researched. The results show that, 1) the basic unit of the sensitivity to electricity consumption in the target areas is 1.25-1.58W/(m2����C); 2) The maximum sensitivity is recorded at around 8:00 pm in the area crowded with commercial and business area. And in the business area, electricity consumption load is even from 9:00 am to 6:00 pm.
Key words:
electricity consumption; electricity load; electricity reserves; energy��
1 Introduction
Recently, because of using personal heating equipment and cooling air conditioners, power demand jumped high because extremely cold weather and heavy snow in winter and extremely hot weather in summer result in the degradation of electricity reserves [1]. In January 2011, the maximum power demand overtook the maximum power demand in summer seasons after 17 years. And the rate of electricity reserve (the percentage of the auxiliary electric power divided by maximum electric power demand, and accordingly, around 15% is considered as proper level) fell down to 5.7% [2]. In the case of the target area of this work, peak power demand was broken from December, 2009 to January 2011 thirteen times [3]. This increasing electric power in urban areas will destroy the state of energy balance. And the additional consumption of energy in order to solve this problem will inhibit the progressive and sustainable development and the urban environment will be greatly exacerbated. Thus, in this work, sensitivity to electricity consumption in urban areas due to climate change is researched and it will be provided as the basic data for the future urban energy planning and urban environmental planning.
The electricity consumption was 45 060 000 kW in 2002 and it rapidly increased to 72 500 000 kW in 2010, the electricity reserve was 6 940 000 kW in 2002 and it was 4 780 000 kW in 2010, reduced by 68.2%. This shows that we seriously have to secure the energy consumption and the electricity facilities (Fig. 1).
Especially, in Korea, at 12:00 am, Jan. 10th, 2011, the maximum electricity demand recorded 71 840 000 kW due to the continuous extremely cold weather. And in the winter of 2011, the record was broken three times, and the electricity reserves fell down to 4 070 000 kW (the rate of the reserves was 5.7%), which was near the emergency level (the electricity reserves is 4 000 000 kW) (Fig. 2).
As for the electricity consumption of seven major cities in Korea by the year of 2010 [4], most of the electricity was commercial, business and residential consumption, except for the manufacturing electricity consumption (Fig. 3) [5].
In this work, the target areas of the cities which are crowded with commercial and business facilities were focused on, from January 2008 to February 2011 for three years. Based on the power supply data and electricity load data of building types and meteorologic data, characteristic of electricity load and sensitivity to electricity consumption were researched.
2 Characteristics of target areas and electricity load in target areas
2.1 Climate of target areas
The changes of the annual average temperature of the target areas in the period of this work from 2008 to 2011 were studied. The monthly average minimum temperature was recorded as -3.9 ��C in January and the monthly average maximum temperature was recorded as 34.7 ��C in August, as shown in Fig. 4. Accordingly, this work was conducted by dividing the studying period into the winter (January), summer (August), and middle season (April and October), which represented the characteristics of the seasonal temperature distribution.
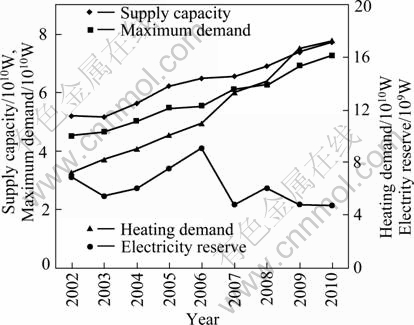
Fig. 1 Trends of annual maximum electricity demand
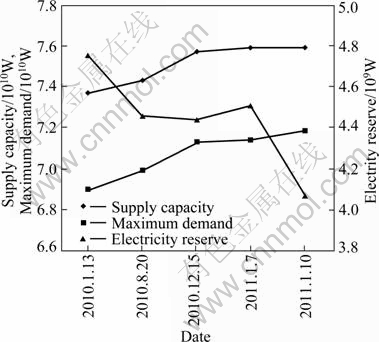
Fig. 2 Trends of maximum electricity demand from 2010 to 2011 in Korea
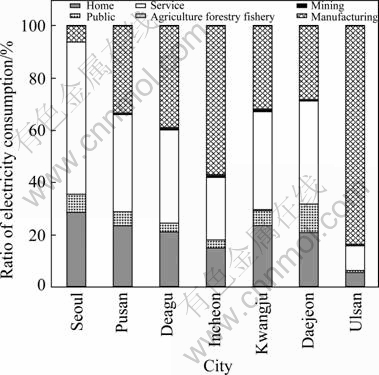
Fig. 3 Ratio of electricity consumption of 7 major cities in Korea
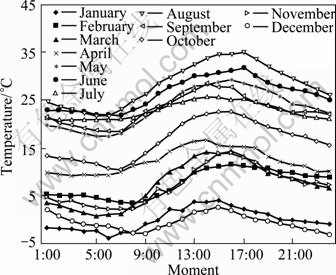
Fig. 4 Monthly average temperature of target areas
2.2 Overview of study target areas
The target areas of this work are composed of 0.8% of the metropolitan area. The commercial and business district was 3.15 km2, and the green belt was 1.11 km2 [6]. Because there were many buildings in this commercial and business district, this area was important in measuring the maximum electricity demand (Fig. 5).
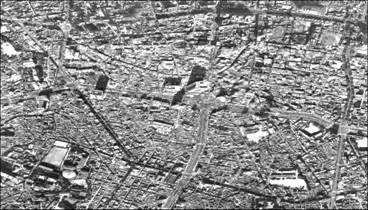
Fig. 5 Satellite photo of studied target areas
The period of this work was from January 2009 to February 2011. In the case of the target areas of this work, there were 66.9% residential construction, 11.0% business buildings, 10.4% commercial buildings and 11.7% others (Fig. 6) [7].
2.3 Current status of electricity supply in target areas
The current status of the electricity supply in the target areas shows that business electricity supply counted for more than 50%, and residential electricity supply counted for 17%. In this work, the target areas were divided into commercial area and business (service) area, and this work was conducted under the consideration of the electricity supply of Korea Electric Power Corporation Office and Substation. Figure 7 shows the current electricity supply provided by the substations in the target areas.
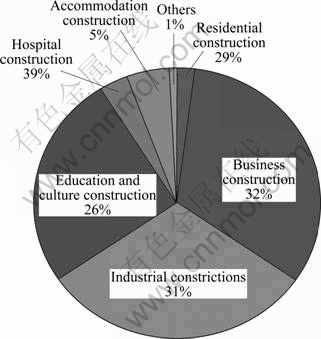
Fig. 6 Area ratios in target areas
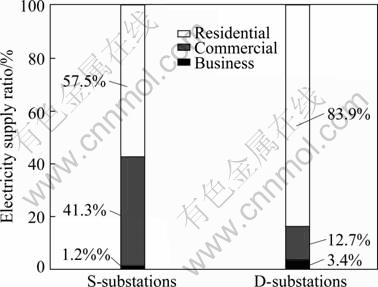
Fig. 7 Current status of electricity supply provided by substations
In the case of S-substation in the target area, there are commercial district and business district all together, and in the case of D-substation in the target area, there is mainly business area. In order to research the electricity consumption and electricity load ratio which can be extracted in the target areas, 50 constructions were chosen. And the study on these constructions was conducted.
3 Electricity demand in target areas
3.1 Characteristics by electricity supply and by electricity demand
1) In areas having commercial and business districts all together
Figure 8 shows the monthly average electricity supply of the mixed area of commercial and business constructions in the target areas. According to the monthly average electricity supply in the mixed area of commercial and business districts, in August, the maximum electricity supply was recorded, while in April the minimum electricity supply was recorded. The change in the electricity supply was consistent with the time even though there was a little difference in the electricity supply. Especially from 8:00 am, the electricity supply increased. In August (summer season), from 2:00 to 4:00 pm, the maximum electricity supply was recorded, while from 4:00 to 6:00 am, the minimum electricity supply was recorded. In January (winter season), from 8:00 am, the electricity supply increased constantly, and from 9:00 pm, the electricity supply rapidly decreased. In April and August (middle season), the electricity supply is similar.
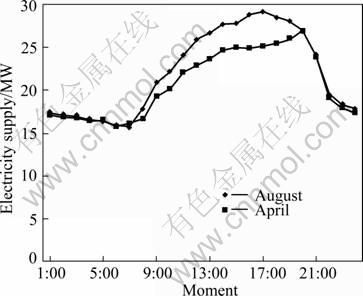
Fig. 8 Average electricity supply in S-substation area
Figure 9 shows the ratio of the electricity load in the mixed area of commercial and business districts. From 8:00 am to 8:00 pm, the electricity load in the mixed area of commercial and business districts showed the characteristic of the compounding usages. Accordingly, the characteristics of the electricity supply and demand in the mixed area of commercial and business districts are similar from 8:00 am to 8:00 pm.
2) Characteristic of electricity demand and supply in business districts
Figures 10 and 11 show the monthly average electricity supply of the business districts in the studied target area. It could be seen that in the business districts crowded with commercial facilities, the maximum electricity supply was recorded in August, while in April, the minimum electricity supply was recorded. Especially in August (in the summer season) from 3:00 pm to 6:00 pm, the maximum electricity supply was recorded, and in January (in the winter season) from 9:00 am, the electricity supply constantly increased till 5:00 pm and from 9:00 pm, the electricity supply rapidly decreased. In the middle season of April and in October, the electricity supply was similar but in April it was less.
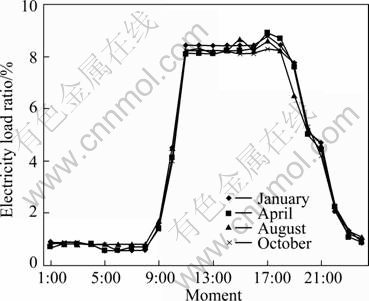
Fig. 9 Ratios of electricity load in mixed area of commercial and business districts
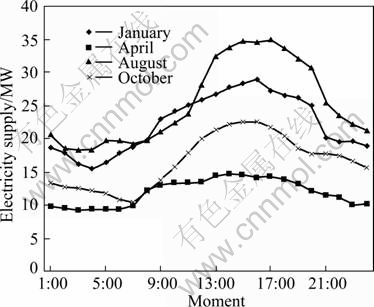
Fig. 10 Electricity load in business districts
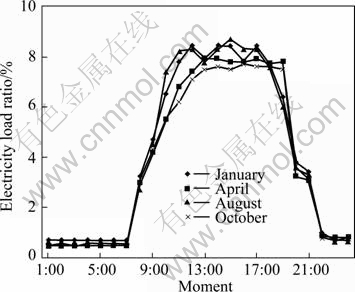
Fig. 11 Ratios of electricity load in business districts
The electricity consumption in the studied target areas happened from 8:00 am to 10:00 pm concentrically. The maximum electricity load occurred especially from 1:00 pm to 3:00 pm.
3.2 Characteristics of electricity demand and supply in workdays and weekends
1) In mixed areas
The electricity supply in the workdays and weekends of the mixed areas of commercial and business districts was generally similar. But, in the workdays, the electricity supply was more than that in the weekends. In the workdays, from 10:00 am the electricity supply increased and around 4:00 pm the maximum electricity supply was recorded. But from 8:00 pm, it rapidly decreased. Especially, from 12:00 pm to 5:00 pm, there were many differences in the electricity supply between workdays and weekends (Fig. 12).
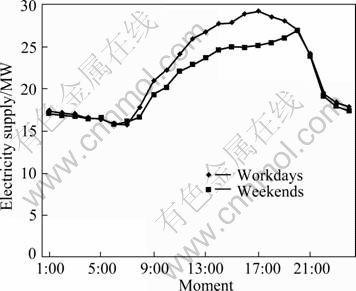
Fig. 12 Average electricity supply in workdays and weekends of mixed area of S-substation
The ratio of the electricity load in workdays and weekends in the area crowded with commercial and business constructions in the studied target areas showed that from 11:00 am to 6:00 pm it constantly and evenly increased, and from 12:00 am to 4:00 pm the maximum electricity load happened. This meant that the electricity power was constantly used at that time because of the characteristic of the area which has the commercial and business construction in the opening time (Fig. 13).
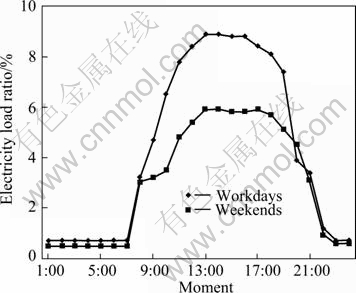
Fig. 13 Electricity load ratio in weekdays and weekends in area crowded with commercial and business constructions
2) In commercial areas
The electricity supply in the workdays and weekends of the commercial area in the studied target areas is similar. But in the workdays, from 10:00 am the electricity supply increased and around 4:00 pm the maximum electricity supply was recorded. From 9:00 pm it decreased rapidly. Especially from 1:00 pm to 6:00 pm the electricity supply had a lot differences between workdays and weekends, but in the weekends there was still electricity supply in order to maintain basic facilities in this area (Fig. 14).
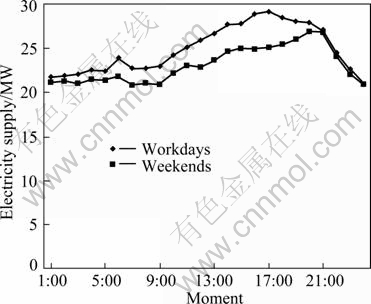
Fig. 14 Average electricity supply in workdays and weekends in business area (D-substation)
The ratios of the electricity load both in the workdays and weekends of the commercial areas rapidly increased from 8:00 and at 5:00 pm, and the maximum electricity load was recorded; from 6:00 pm, it rapidly decreased. From 10:00 am to 4:00 pm, similar electricity load happened. In the weekends, the electricity load was low (Fig. 15).
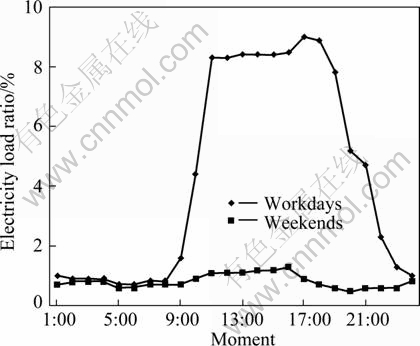
Fig. 15 Ratios of electricity load in workdays and weekends of commercial areas
4 Sensitivity to electricity consumption according to changes of weather
In this section, the relationship between the electricity supply and demand and temperature in the urban areas was analyzed.
4.1 Sensitivity to electricity consumption in each region
1) In mixed areas
Figure 16 shows the sensitivity and average sensitivity to electricity consumption of each construction in the crowded commercial and business area. As a result, there were differences of sensitivity to electricity consumption in each region but in winter season it was high while in the summer season it was low all together and generally, due to the weather changes.
2) In business area
Figure 17 shows the sensitivity and average sensitivity to electricity consumption in the business area. This was also somewhat different from that in the mixed area of commercial and business districts. In the summer season it was high and in the winter season it was low.
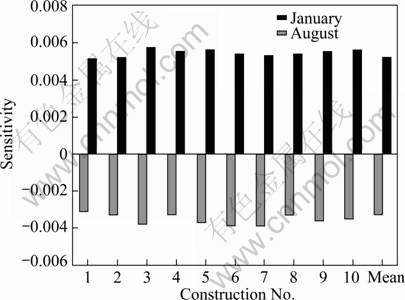
Fig. 16 Sensitivity to electricity consumption in commercial and business area
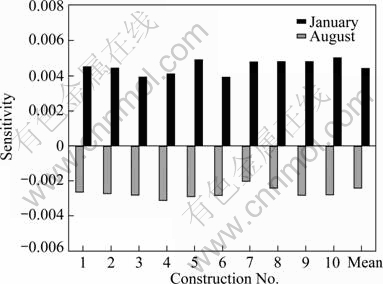
Fig. 17 Sensitivity to electricity consumption in business area
The electricity consumption was greatly affected by the weather changes.
4.2 Sensitivity to electricity consumption vs time
1) Sensitivity to electricity consumption
The sensitivity to electricity consumption based on the electricity consumption data was drawn in each region. In order to interpret the effect of weather changes on the sensitivity to electricity consumption, the survey of the sensitivity of electricity consumption was conducted based on the data of the electricity consumption vs time. Figures 18 and 19 show the sensitivity to electricity consumption vs time and the absolute value of the sensitivity to electricity consumption. In the summer season, due to the temperature rising, the electricity consumption increased and in the winter season, due to the weather declining, it decreased.
Figure 18 showed that the sensitivity to electricity consumption was high in the mixed area of commercial and business districts, but at night the sensitivity to electricity consumption was constantly higher until late night than that in the business constructions. Figure 19 showed that the sensitivity to electricity in the business area was high during the business time and it was clearly affected by the temperature changes, but in off-time, it was little affected by the temperature changes.
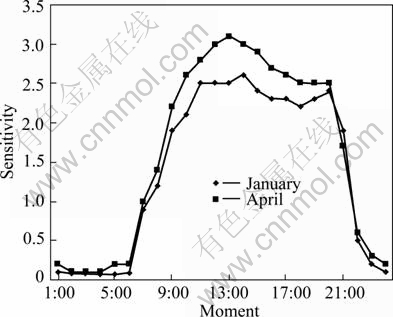
Fig. 18 Sensitivity to electricity consumption vs time in mixed area
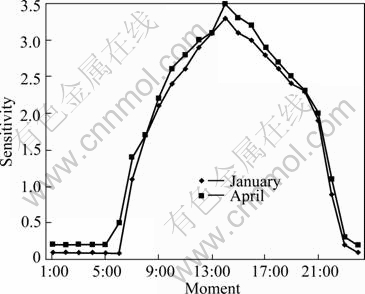
Fig. 19 Sensitivity to electricity consumption vs time in business area
2) Basic unit of sensitivity to electricity consumption vs time
The basic unit of the sensitivity to electricity consumption vs time based on the electricity supply area is shown in Fig. 20.
The basic unit of the sensitivity to electricity consumption in the target areas was 1.25-1.58 W/(m2����C) a day. The maximum sensitivity was recorded around 8:00 pm in the area crowded with commercial and business facilities. And in the business facilities, electricity consumption load was shown evenly from 9:00 am to 6:00 pm. Accordingly, it was important to discuss about making electricity load evenly and introducing the spreading energy system in the urban area.
Fig. 20 Basic unit of sensitivity to electricity consumption vs time
5 Conclusions
1) The electricity consumption was high in the area crowded with commercial and business constructions both in the summer season and in the winter season due to the temperature changes. And in the business area, it was high in the summer season due to the temperature changes. In both the areas, the electricity consumption were affected by weather changes.
2) The basic unit of the sensitivity to electricity consumption in the target areas was 1.25-1.58 W/(m2����C)
3) The maximum sensitivity was recorded around 8:00 pm in the area crowded with commercial and business area. And in the business area electricity consumption load was shown evenly from 9:00 am to 6:00 pm.
References
[1] Ministry of Knowledge Economy, Korea Electric Power Corporation. Press release [Z]. 2011-01-12. (in Korean)
[2] Ministry of Knowledge Economy, Korea Electric Power Corporation. Press release [Z]. 2011-01-13. (in Korean)
[3] Daegu, Gyeongbuk Regional Headquarter, Korea Electric Power Corporation. Press release [Z]. 2011-01-07. (in Korean)
[4] Daegu Gyeongbuk Regional Headquarter, Korea Electric Power Corporation. The current status of electric power, consumption [R]. 2010.
[5] LEE Kang-guk, HONG Won-hwa. A study on the sensitivity to electric power consumption in urban area [J]. Journal of the Architectural Institute of Korea, 2010, 26(5): 372-382. (in Korean)
[6] The current status of construction in Jung-gu, Daegu city [R]. 2010.
[7] Daegu Metropolitan City. The book of housing statistics [M]. 2010.
[8] NISHIMURA N. Space-time characteristics of energy supply in Osaka city from heat island viewpoint [J]. Journal of Heat Island Institute International, 2006, 6(1): 27-32.
[9] ANTONIEWICZ B, KOCZYK H. Analysis of thermal balances in block of flats subject to thermal renovation in stages [C]// International Conference on Problems of Environment Engineering at the Threshold of the New Millennium. Wroclaw, 2000: 23-28. (in Polish)
[10] STANKEVICIUS V, KARBAUSKAITE J, BLIUDZIUS R. Analysis of heat consumption in buildings [J]. Energetika, 2002(2): 57-61. (in Lithuanian)
[11] de WIT S, AUGENBROE G. Analysis of uncertainty in building design evaluations and its implications [J]. Energy and Buildings, 2002, 34(9): 951-958.
[12] Thermal Technique of Building Envelope RSN 143-92 [S]. 1992. (in Lithuanian)
[13] Thermal Technique of Building Envelope STR 2.05.01 [S]. 2005 (in Lithuanian)
[14] Thermal performance of buildings�CCalculation of energy use for heating residential buildings EN 832:1998/AC(2) [S].
[15] HEAP R D. Variability of energy use for domestic space heating [J]. Applied Energy, 1979, 5(3): 179-191.
[16] SRIBIKYTE E, JUODIS E. Uncertainty of heat demand in apartment buildings [C]// Proceedings of the Sixth International Conference on Energy for Buildings. Vilnius, 2004: 367-74.
[17] KARBAUSKAITE J. Importance of energy use rise in buildings [EB/OL]. http://www.krea.lt/uploads/Siluma%20pastatuose%20 Lengvai%20diegiamos%20ir%20mazai%20kainuojancios%20priemones.pdf. (in Lithuanian)
[18] JUODIS E, SAMARIN O D. Heat saving reserve in residential buildings [C]// Proceedings of the 7th International Conference on Environmental Engineering. 2008: 822-826.
[19] Construction norms and rules, heat engineering for the construction industry. SniP II-A.7-62, SNiP II-A.7-71, SNiP II-3-79 [S]. (in Russian)
[20] National Control Commission for Prices and Energy. On the centralized heat price affirmation order applied to multiflat residential house separate flats payments determination for heating and hot water supply [R]. 1999. (in Lithuanian)
[21] The power of building��s heating system, energy demand for heating STR 2.09.04 [S]. 2002 (in Lithuanian)
(Edited by YANG Bing)
Foundation item: Project(NRF-20110030631) supported by the National Research Foundation of Korea Grant funded by the Korean Government
Received date: 2011-07-26; Accepted date: 2011-11-14
Corresponding author: LEE Kang-guk, Research Professor; Tel: 82-10-8597-4638; E-mail: ggyi@naver.com
Abstract: Recently, urban high temperature phenomenon has become a problem which results from human activities, the increase in energy consumption, and land-cover change in urban areas. As extremely hot weather caused by urban high temperature continues, demand for power is increased and results in the degradation of electricity reserves. The current trend in climate change, regardless of the summer and winter power demand, is likely to have much effect on the power demand. Thus, sensitivity to electricity consumption in urban areas due to climate change was researched. The results show that, 1) the basic unit of the sensitivity to electricity consumption in the target areas is 1.25-1.58W/(m2����C); 2) The maximum sensitivity is recorded at around 8:00 pm in the area crowded with commercial and business area. And in the business area, electricity consumption load is even from 9:00 am to 6:00 pm.
[6] The current status of construction in Jung-gu, Daegu city [R]. 2010.
[7] Daegu Metropolitan City. The book of housing statistics [M]. 2010.
[12] Thermal Technique of Building Envelope RSN 143-92 [S]. 1992. (in Lithuanian)
[13] Thermal Technique of Building Envelope STR 2.05.01 [S]. 2005 (in Lithuanian)
