

Phase and microstructure selection in directionally solidified peritectic alloys with convection
SU Yan-qing(������), LI Xin-zhong(������), GUO Jing-jie(������), WU Shi-ping(��ʿƽ),
DING Hong-sheng(������), FU Heng-zhi(����־)
School of Materials Science and Engineering, Harbin Institute of Technology, Harbin 15001, China
Received 20 April 2006; accepted 30 June 2006
Abstract:
A boundary layer model was used to investigate the convection effects on phase and microstructure selection in directionally solidified peritectic alloy. Due to the convection effects, the steady-state compositions of one phase at interface corresponding to an initial composition reduce, which causes its steady-state point moves upward along its solidus line and the compositional range is not consistent with the band cycle in banding. A criterion of critical interface temperature was put forward to determine whether a phase entered steady-state growth or not. Furtherly by equivalent transformation, the equivalent solidus lines and subsequent equivalent phase diagram were derived for peritectic solidification with convection. Using this equivalent phase diagram, a phase and microstructure selection map is built for a peritectic alloy with convection effect, which shows that the compositional range for banding reduces, and moves to the hyperperitectic region, and also the coupled growth region of both solids comparing with purely-diffusive limit. The predicted map for directionally solidified Pb-Bi alloy agrees well with its experimental observations.
Key words:
boundary layer model; peritectic alloy; phase selection; convection;
1 Introduction
Peritectic systems are found in many technolog- ically important materials, such as steel, copper alloy, permanent magnetic materials, and high-temp- erature superconductors. The phase and microstructure selection play an important role in their material properties. Several studies have reported the observation of band structures in Sn-Cd [1, 2], Pb-Bi [3, 4] and Fe-Ni [5, 6]. TRIVEDI [7] proposed a model of banding in purely diffusive limit and predicted that the primary and peritectic phases would form across the entire sample with respective widths that were constant and the banding only occurred within a relatively narrow range in hypoperitectic region. While in some systems like Pb-Bi [3, 4], banding is found to occur nearly over the whole range from solid composition of primary phase to peritectic composition of liquid phase. Further study shows that the convection effect is responsible for this situation [8, 9]. Recently, KARMA et al [10] developed a boundary layer model to treat convection effect on banding, which agreed well with the experimental obser- vations of directionally solidified Pb-Bi alloys.
In addition, many other microstructures are found in directionally solidified peritectic alloys, such as eutectic- like two-phase microstructures [11-13], tree-like struct- ure, which indicates the varieties of competition and selection between phase and microstructure. So several researchers proposed microstructure selection maps for peritectic systems, giving the expected phase and morphology as a function of initial alloy composition and the ratio of G/Vp where G and Vp are temperature gradient and growth rate respectively. However, these maps are various and are not always consistent with experimental observations. HUNZIKER et al [14] clar- ified this problem, proposed a new criterion of nucleation and compositional undercooling, named as NCU criterion, and developed a microstructure selection map close to the limit of compositional undercooling. The predicted map for Fe-Ni alloy is in good agreement with experimental observations.
In this paper, we tried to integrate convection effects into thermodynamic data of peritectic phase diagram according to boundary layer model and to investigate how convection affects the phase and microstructure selection. The Pb-Bi alloy was chosen as a case.
2 Boundary layer model
Boundary layer model is developed to investigate convection effects on banding in Ref. [10]. It assumes that diffusion only takes place within a boundary layer of fixed thickness of d ahead of the solid-liquid interface, and outside this diffusion layer, the melt is uniformly mixed with a composition of cm due to convection effect. Obviously, the bigger the thickness of d, the weaker the convection intensity is. Correspondingly, the region ahead of interface can be divided into two parts, that is, diffusive zone and mixed zone, as shown schematically in Fig.1. Assuming a sample is pulled at a constant velocity of vp and a fixed temperature gradient of G, a coordinate can be built on it shown in Fig.1, whose horizontal axis is solidification distance z, the longitud- inal one is solute composition c, and the origin is taken to correspond to the isotherm of melting point of primary phase ![]() ,
, ![]() . So the linear temperature field of system can be given as T(z)=
. So the linear temperature field of system can be given as T(z)=![]() +Gz, and the interface liquid compositions of primary and peritectic phases are
+Gz, and the interface liquid compositions of primary and peritectic phases are ![]() =Gz0/m�� and
=Gz0/m�� and ![]() (
(![]() )/m��, where
)/m��, where ![]() is the position of solid-liquid interface,
is the position of solid-liquid interface, ![]() and
and ![]() are the liquidus slopes of primary and peri- tectic phases respectively, and
are the liquidus slopes of primary and peri- tectic phases respectively, and ![]() is the melting point of peritectic phase ��.
is the melting point of peritectic phase ��.
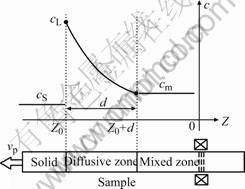
Fig.1 Schematic representations of composition profile of boundary layer model
In a directionally solidified sample, the solute distri- bution in the diffusive region can be expressed as [10]
![]() (1)
(1)
where D the is solute diffusion coefficient in the liquid. Eqn.(1) satisfies the following boundary conditions:
V(t)(1-kv)![]() (2)
(2)
c(z0, t)=![]() (3)
(3)
c(z0+d, t)=cm(t) (4)
where v(t)=vp+![]() is the interface growth velocity and v corresponds to
is the interface growth velocity and v corresponds to ![]() or
or ![]() . Assuming the composition field inside the boundary layer takes an exponential form, the solute distribution can be expressed as [10]
. Assuming the composition field inside the boundary layer takes an exponential form, the solute distribution can be expressed as [10]
c(z, t)=�� exp![]() (5)
(5)
where l0 is defined as characteristic diffusion scale, and z0(t) ��z��z0(t)+d. After integrating Eqns.(1)-(5), the following expressions can be derived as [10]
a=(![]() -cm)/(1-exp(-d/l0)) (6)
-cm)/(1-exp(-d/l0)) (6)
b=cm-(![]() )exp(-d/l0)/(1-exp(d/l0)) (7)
)exp(-d/l0)/(1-exp(d/l0)) (7)
![]()
![]() (8)
(8)
![]()
![]() (9)
(9)
![]() (10)
(10)
where f=[1-(d/l0)exp(-d/l0)/(1-exp(d/l0))]/[1- (d/l0)2.
exp(-d/l0)/(1-exp(-d/l0))], kv is the equilibrium partition coefficient, g=1/[1-(d/l0)2exp(-d/l0)/(1-exp(-d/l0))2], Ls is the length of sample, and zS=z0-z0|t=0+vP, t is the distance from the initial end of the sample.
The nucleation conditions can be specified according to the criterion of the highest interface temperature. TL=![]() and TL=
and TL=![]()
![]() where
where ![]() , are set for
, are set for ![]() nucleation during
nucleation during ![]() growth and
growth and ![]() nucleation during
nucleation during ![]() growth respectively.
growth respectively.
In a semi-infinite sample, i.e. LS���� and cm(t)=c0, the steady-state compositions of both phases can be derived by setting dl0(t)/dt=0 and dz0(t)/dt=0, and then solving equations (8)-(10):
![]() (11)
(11)
where ![]() =kv+(1-kv)exp(-��) and��=d/(D/vp) indicat-
=kv+(1-kv)exp(-��) and��=d/(D/vp) indicat-
ing the intensity of convection.
According to the criterion of highest interface temperature, the minimum and maximum compositions of banding in a semi-infinite sample are determined [10],
![]() (12)
(12)
![]() (13)
(13)
where ![]() and
and ![]() =
=![]()
are the critical compositions of nucleation of ![]() and
and ![]() , cp is the peritectic composition of liquid phase, and
, cp is the peritectic composition of liquid phase, and ![]() is the nucleation undercooling corresponding to phase v.
is the nucleation undercooling corresponding to phase v.
Fig.2 shows the phase diagram of Pb-Bi alloy derived by the thermodynamic data in Ref. [10]. The cycle and compositional ranges of banding are also shown, which are calculated by the boundary layer model when nucleation undercooling of both phases are taken as 2.0 K and ?=1.3. Assuming an initial composit-
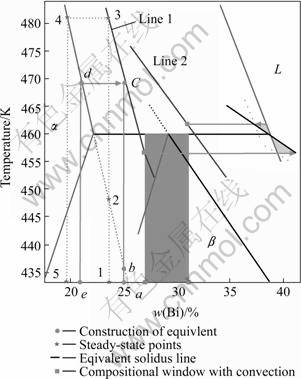
Fig.2 Phase diagram of Pb-Bi alloy and schematic derivation of equivalent steady-state points and solidus lines with convection by equivalent transformation
ion of c0 corresponding to the point a in Fig.2, the steady-state point of ![]() in planar growth is point b, i.e. the intersecting point between the initial composition line and solidus line of
in planar growth is point b, i.e. the intersecting point between the initial composition line and solidus line of ![]() , when without convection. Point b means that the solid steady-state composition of
, when without convection. Point b means that the solid steady-state composition of ![]() is c0, the liquid one is c0/k��, and the interfacial temperature of steady-state growth of
is c0, the liquid one is c0/k��, and the interfacial temperature of steady-state growth of ![]() is
is ![]() . However, when with convection, the steady-state compositions of both solid and liquid reduce according to Eqn.(11). The steady-state solid composition of
. However, when with convection, the steady-state compositions of both solid and liquid reduce according to Eqn.(11). The steady-state solid composition of ![]() reduces to the composition corresponding to point e in Fig.2, that is, the steady-state point of
reduces to the composition corresponding to point e in Fig.2, that is, the steady-state point of ![]() corresponding to the initial composition of c0 under this condition becomes point d. Obviously, due to convection effects, the steady-state point of one phase in planar growth moves upward along its solidus line to a higher temperature. This causes the compositional range is not consistent with the band cycle, not like the situation in Trivedi��s model, and the difficulty in discriminating phase and microstructure corresponding to an initial composition from the original phase diagram directly.
corresponding to the initial composition of c0 under this condition becomes point d. Obviously, due to convection effects, the steady-state point of one phase in planar growth moves upward along its solidus line to a higher temperature. This causes the compositional range is not consistent with the band cycle, not like the situation in Trivedi��s model, and the difficulty in discriminating phase and microstructure corresponding to an initial composition from the original phase diagram directly.
In fact, a steady-state point for one phase corresponds to its interfacial composition and temperature simultaneously. During directional solidification, due to the linear temperature field, the interfacial temperature represents a distance of interface away from isotherm of the highest temperature of a system, and each phase reaches its steady-state growth corresponding to a fixed distance between the interface and the isotherm. So, the interfacial temperature is often referred as the criterion of many critical conditions during directional solidification, such as the stable growth criterion of the highest interface temperature. In this paper, we introduced a criterion of critical interface temperature to determine whether a phase enters steady-state growth or not. In Fig.2, the steady-state point of ![]() corresponding to the initial composition at point a moves upward from point b when without convection while to point d when with convection, and through point d, a isothermal line can be drawn to represent the interfacial temperature in steady state, which will intersect with the extending line of initial composition through both points a and b and form a new point c in Fig.2. According to the criterion of critical interface temperature above, point c can act as the equivalent steady-state point corresponding to the initial composition at point a. Similarly, corresponding to the initial composition at point 1 in Fig.2, its solid steady-state composition of
corresponding to the initial composition at point a moves upward from point b when without convection while to point d when with convection, and through point d, a isothermal line can be drawn to represent the interfacial temperature in steady state, which will intersect with the extending line of initial composition through both points a and b and form a new point c in Fig.2. According to the criterion of critical interface temperature above, point c can act as the equivalent steady-state point corresponding to the initial composition at point a. Similarly, corresponding to the initial composition at point 1 in Fig.2, its solid steady-state composition of ![]() corresponds to the one at point 5 when with convection of ?=1.3, and the equivalent steady-state point of
corresponds to the one at point 5 when with convection of ?=1.3, and the equivalent steady-state point of ![]() can be derived from point 3. Deduced by analogy, under convection effects, there is an equivalent steady-state point of one phase corresponding to each initial composition. By geometrical solution, we can find that these equivalent steady-state points of one phase corresponding to different initial compositions constitute a line in Fig.2, named as equivalent solidus line. The line 1 in Fig.2 is the equivalent solidus line of
can be derived from point 3. Deduced by analogy, under convection effects, there is an equivalent steady-state point of one phase corresponding to each initial composition. By geometrical solution, we can find that these equivalent steady-state points of one phase corresponding to different initial compositions constitute a line in Fig.2, named as equivalent solidus line. The line 1 in Fig.2 is the equivalent solidus line of ![]() , and the line 2 is the one of
, and the line 2 is the one of ![]() .
.
By further geometrical solution, the slope of line 1 is derived as ![]() and the composition of at peritectic temperature on line 1 is
and the composition of at peritectic temperature on line 1 is ![]() . Similarly, the slope of line 2 is
. Similarly, the slope of line 2 is ![]() and the composition of at peritectic temperature on line 2 is
and the composition of at peritectic temperature on line 2 is ![]() . Furthermore, the extending lines of line 1 and line 2 go through the point (0,
. Furthermore, the extending lines of line 1 and line 2 go through the point (0, ![]() ) and (0,
) and (0, ![]() ), respectively. If both the solid-solid lines are moved parallel to the point (
), respectively. If both the solid-solid lines are moved parallel to the point (![]() , Tp) and (
, Tp) and (![]() , Tp) respectively, the new solid-solid lines together with the equivalent solidus lines of line 1 and line 2, and two original liquidus lines of
, Tp) respectively, the new solid-solid lines together with the equivalent solidus lines of line 1 and line 2, and two original liquidus lines of ![]() and
and ![]() constitute a new phase diagram, named as equivalent phase diagram with convection, shown in Fig.3. Fig.3 also shows the thermodynamic parameter of this phase diagram.
constitute a new phase diagram, named as equivalent phase diagram with convection, shown in Fig.3. Fig.3 also shows the thermodynamic parameter of this phase diagram.
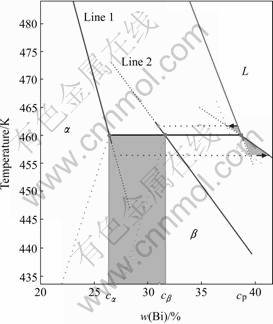
Fig.3 Equivalent phase diagram with convection for Pb-Bi alloy when ?=1.3:
![]()
After equivalent transformation, we integrated the convection into the thermodynamic data of original phase diagram and construct an equivalent phase diagram with convection. From Fig.2, it can be seen that this phase diagram connects the band cycle with compositional range harmoniously, which provides great conveniences to understand formation of band structures when with convection. And in the equivalent phase diagram, the compositional range of banding with convection is in the hypoperitectic region.
4 Convection effects on phase and micro-
structure selection map
Using the equivalent phase diagram with convection for a peritectic alloy, we investigated convection effects on the phase and microstructure selection according to the NCU criterion by HUNZIKER et al [14]. Assuming the nucleation undercooling of both phases are 2.0 K, Fig.4 shows the phase and microstructure selection maps for Pb-Bi alloy when without convection and ?=1.3. These maps give the phase and morphology as a function of the alloy composition and the ratio of G/vp. The map is divided into eight regions by seven lines representing the critical conditions, described in detail in Ref. [14]. Line 1 and line 4 represent the stable conditions of ![]() -planar growth and
-planar growth and ![]() -planar growth respectively; line 2 and line 5 represent the compositional range of banding; line 3 represents stable conditions of
-planar growth respectively; line 2 and line 5 represent the compositional range of banding; line 3 represents stable conditions of ![]() -cell growth with respect to nucleation of
-cell growth with respect to nucleation of ![]() ; and the curved line 6 and line 7 represent stable conditions of
; and the curved line 6 and line 7 represent stable conditions of ![]() -planar and cellular growth with respect to nucleation of
-planar and cellular growth with respect to nucleation of ![]() in the liquid ahead of the interface respectively. The eight regions include the ones of planar of
in the liquid ahead of the interface respectively. The eight regions include the ones of planar of ![]() , cell or dendrite of
, cell or dendrite of ![]() , planar of
, planar of ![]() , cell or dendrite of
, cell or dendrite of ![]() , band ��(��p��p��p��p��), band ��(��p��p��p��p��), coupled growth �� (��c+��p), and coupled growth �� (��c+��c).The subscript ��p��, ��c�� and ��d�� represent the planar, cell and dendrite respectively.
, band ��(��p��p��p��p��), band ��(��p��p��p��p��), coupled growth �� (��c+��p), and coupled growth �� (��c+��c).The subscript ��p��, ��c�� and ��d�� represent the planar, cell and dendrite respectively.
Fig.4 shows the move of the above lines repress-

Fig.4 Phase and microstructure selection map close to steady state for Pb-Bi alloy when without convection and ?=1.3
enting critical conditions under the effect of convection. The line 1 and line 4 move downward, line 2 and line 5 move to hyperperitectic region and the former moves more, which cause the interval between line 2 and line 5 to reduce, and the curved line 6 moves with line 5 synchronously. The moves of these lines can be attributed to the reduction of steady-state compositions of both solid and liquid phases at interface due to convection, i.e. reduction of compositional gradient at interface, which causes the reduction of the ratio of G/vp corresponding to the above critical conditions. In general, the existence of convection causes increase of ![]() -planar region, corresponding decrease of
-planar region, corresponding decrease of ![]() -cell or dendritic region, reduction of both
-cell or dendritic region, reduction of both ![]() -planar region and
-planar region and ![]() -cell or dendritic region, decrease of compositional range of
-cell or dendritic region, decrease of compositional range of
banding and its moving to the hyperperitectic region, reduction of band �� region, and reduction of coupled-growth region of both �� and ��.
5 Compared with experimental results
In Refs. [4, 10], directionally solidified experiments were carried out using the Bridgman crystal growth technique for Pb-Bi alloy. We took some experimental results from them and determine the convection intensity of ?=0.76 approximately like in Ref. [10]. Then, using the equivalent phase diagram with convection above, the phase and microstructure selection map is derived by Hunziker model neglecting the nucleating undercooling of both phases, shown in Fig.5. The marks in it are some typical microstructures from the above experiments. This map predicts the banding at two initial compositions in hyperperitectic region of 30%Bi and 33%Bi at high
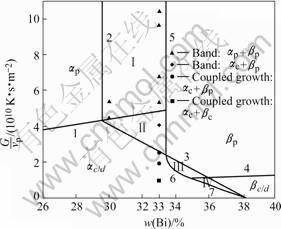
Fig.5 Comparison between experimental observations in directionally solidified Pb-Bi alloy and predicted map using equivalent phase diagram
ratios of G/vp, which shows good agreement with experimental observations. Fig.5 also gives some exper- imental results of coupled growth at low ratios of G/vp for Pb-33%Bi, which are not in the predicted regions by the map, but so close to them. This can be attributed to neglecting the nucleating undercooling of both phases and the constant value of ![]() in present map. The existence of nucleation undercooling will cause the line 7 move to the left and the line 3 to the right in Fig.5, i.e. increase the region of coupled growth. Furthermore, in fact, the thickness of diffusive layer, d, should not remain constant, but change with the different growth conditions including the pulling rate and temperature gradient. So if we consider the nucleation undercooling of both phases and take a relatively big value of
in present map. The existence of nucleation undercooling will cause the line 7 move to the left and the line 3 to the right in Fig.5, i.e. increase the region of coupled growth. Furthermore, in fact, the thickness of diffusive layer, d, should not remain constant, but change with the different growth conditions including the pulling rate and temperature gradient. So if we consider the nucleation undercooling of both phases and take a relatively big value of ![]() at low ratios of G/vp, the coupled growth region of both �� and �� will enlarge to the left, and the experimental observation of coupled growth will appear the predicted region by the map.
at low ratios of G/vp, the coupled growth region of both �� and �� will enlarge to the left, and the experimental observation of coupled growth will appear the predicted region by the map.
6 Conclusions
1) In a semi-finite sample, the existence of convection causes the decrease of the steady compositions of both solid and liquid. The compositional range of banding reduces and moves to the hyper- peritectic region. A criterion of critical interface temper- ature is put forward to derive the equivalent steady-state points, equivalent solidus lines, and then the equivalent phase diagram with convection by integrating the conv- ection effects into the thermodynamic data of original peritectic phase diagram.
2) The phase and microstructure selection map with convection is derived using this equivalent phase diagram for directionally solidified peritectic alloys. It shows several effects of convection on it, including increase of ��-planar region, decrease of ��-cell or dendritic region, reduction of both ��-planar region and ��-cell or dendritic region, decrease of compositional range of banding and its moving to hyperperitectic region, reduction of band �� region, and reduction of coupled-growth region. The predicted selection map with convection for Pb-Bi alloy shows good agreements with its experimental observations in directional solidific- ation.
References[1] BOETTINGER W J. The structure of directionally solidified two phase Sn-Cd peritectic alloys [J]. Metall Trans, 1974, 5: 2023-2031.
[2] TRIVEDI R, PARK J S. Dynamics of microstructure formation in the two-phase region of peritectic systems [J]. J Cryst Growth, 2002, 235: 572-588.
[3] TOKIEDA K, YASUDA H, OHNAKA I. Formation of banded structure in Pb-Bi peritectic alloys [J]. Mater Sci Eng A, 1999, A262: 238-245.
[4] SUMIDA M. Growth analysis of banded microstructure formed during directional solidification of peritectic alloys [J]. Mater Trans, 2004, 45(2): 388-391.
[5] SUMIDA M. Evolution of two phase microstructure in peritectic Fe-Ni alloy [J]. Journal of Alloys and Compounds, 2003, 349: 302-310.
[6] SUMIDA M. Band structure formation in peritectic Fe-Co and Fe-Ni alloys [J]. Mater Trans, 2003, 44(7): 1351-1358.
[7] TRIVEDI R. Theory of latered-structure formation in peritectic systems [J]. Metall Mater Trans, 1994, 26: 1583-1590.
[8] PARK J S, TRIVEDI R. Convection-induced novel oscillating microstructure formation in peritectic systems [J]. J Crystal Growth, 1998, 187, 511-515.
[9] MAZUMDER P, TRIVEDI R. Integrated simulation of thermo-solutal convection and pattern formation in directional solidification [J]. Appl Math Modelling, 2004, 28: 109-125.
[10] KARMA A, RAPPEL W J, FUH B C, TRIVEDI R. Model of banding in diffusion and convective regimes during directional solidification of peritectic systems [J]. Metall Mater Trans, 1998, 26: 1457-1470.
[11] VANDYOUSSEFI M, KERR H W, KURZ W. Two-phase growth in peritectic Fe-Ni alloys [J]. Acta Mater, 2000, 48: 2297-2306.
[12] SUMIDA M. Evolution of two phase microstructure in peritectic Fe-Ni alloy [J]. Journal of Alloys and Compounds, 2003, 349: 302-310.
[13] DOBLER S, LO T S, PLAP M, KARMA A, KURZ W. Peritectic coupled growth [J]. Acta Mater, 2004, 52: 2795-2808.
[14] HUNZIKER O, VANDYOUSSEFI M, KURZ W. Phase and microstructure selection in peritectic alloys close to the limit of compositional undercooling [J]. Acta Mater, 1998, 46: 6325-6336.
Foundation item: Projects (50391012, 50271020) supported by the National Natural Science Foundation of China
Corresponding author: SU Yan-qing; Tel: +86-451-86418815; E-mail: hitlxz@163.com
