
Trans. Nonferrous Met. Soc. China 26(2016) 2567-2585
Influence of welding parameters on fracture toughness and fatigue crack growth rate in friction stir welded nugget of 2024-T351 aluminum alloy joints
Danial GHAHREMANI MOGHADAM, Khalil FARHANGDOOST
Faculty of Engineering, Department of Mechanical Engineering, Ferdowsi University of Mashhad, Mashhad 9177948974, Iran
Received 8 September 2015; accepted 5 May 2016
Abstract:
Friction stir welding (FSW) was performed on 2024-T351 aluminum alloy plates. Metallographic analysis, Vickers microhardness and XRD tests were conducted to determine the properties of the welded zone. FE simulation of the FSW process was implemented for the different welding conditions to extract the residual stress and stress intensity factor (SIF). Fracture and fatigue behaviors of the welds which have the initial crack in the nugget zone and the crack orientation along the welding direction, were studied based on standard test methods. Fracture behavior of the welds was also evaluated by shearography method. The results showed that the tool rotational and traverse speeds affect the fracture toughness and fatigue crack growth rate. FSW provides 18%-49% reductions in maximum fracture load and fracture toughness. A slight diminution in fracture toughness of the joints was observed for lower traverse speed of the tool, and at higher traverse or rotational speeds, increasing the probability of defects may contribute to low fracture toughness. Fatigue crack propagation rate of all welds was slower than that of the base metal for low values of stress intensity factor range ��K (��K<13 MPa��m1/2), but is much faster for high values of ��K.
Key words:
aluminum alloy; friction stir welding; fracture toughness; shearography; fatigue crack propagation rate;
1 Introduction
Friction stir welding (FSW) is a solid state welding process which was invented by The Welding Institute (TWI) in Cambridge (UK) in 1991 [1]. PEEL et al [2] investigated the main advantages of FSW process such as creating high quality joints, precise external control and high levels of repeatability, simple specimen preparation, requiring less energy and less pollution. This welding process is more appropriate than the conventional methods specially used for welding of aluminum alloys with lower weld ability and also for welding of dissimilar alloys. Unlike traditional methods of welding, FSW occurs below the melting point temperature, which provides lower distortions and residual stresses. Due to these advantages, FSW is utilized extensively in various industrial fields such as automobile manufacturing, aerospace, shipbuilding and railroad for welding aluminum alloys [3]. For instance, FSW is used for welding series 2 and 3 aluminum alloys in aircraft construction, which reduces weight by 15% and costs by 20%, respectively [4,5].
The tool geometry, rotational and traverse speeds, mass plunge depth, forge force and the tilt angle are the most effective parameters influencing the microstructure, joint strength, hardness, residual stress and fatigue resistance in FSW which are widely investigated. MOSHWAN et al [6] investigated the effects of tool rotational speed on the microstructure and mechanical properties of 5052 aluminum alloy, welded by FSW. Welding process was conducted at a constant traverse speed and different rotational speeds from 800 to 3000 r/min. Their results indicated that a rotational speed of 1000 r/min provides joints with higher tensile strength. LAKSHMINARAYANAN and BALASUBRAMANIAN [7] studied the effects of tool rotational speed, welding speed and axial force on ultimate tensile strength of Al-Zn-Mg alloy plates by using Taguchi method for optimization of process parameters. Their results indicated that these parameters have affected the tensile strength of the joints significantly. KRASNOWSKI et al [8] examined the effects of tool shape and welding configuration on the microstructure and mechanical properties of friction stir welded 6082 aluminum alloy joints. They found that welding by conventional and Triflute tool provides better tensile strength, and two-sided welds exhibit weaker mechanical properties than one-sided welds due to the greater heat transference to the material during the second pass of welding.
PEEL et al [2] investigated the effect of tool speed on residual stress by using XRD. They found that the peak longitudinal stresses increase as the traverse speed increases. XU et al [9] used hole-drilling and strain-gauge to measure residual stress on top and bottom surfaces of thick plates welded by FSW, and concluded that by increasing rotational speed, the residual stress is reduced on the top surface and is increased on the bottom surface of the specimen.
Besides the experimental methods, numerical simulations have been widely conducted to determine residual stress in FSW process. CHO et al [10] performed a three-dimensional thermomechanical simulation of FSW process for ferritic stainless steel by using an Eulerian finite volume under the steady state condition. ZHANG et al [11] and CHIUMENTI et al [12] simulated the FSW process of aluminum alloys using a fully coupled thermomechanical analysis and Lagrangian-Eulerian formulation.
The most basic factor to prevent the structure failure is that the stress which is applied to the components must be lower than the strength of the material. Moreover, in the case of cracked component, failure might occur before yielding. Fracture toughness is one of the material properties for crack propagation under static loading depending on critical stress and the initial crack length. SUTTON et al [13] studied microstructure and Mode I fracture of AA2024-T3 plates designated hot, medium and cold due to the level of nominal generated heat during the FSW. Their results showed that all welded specimens have weaker fracture properties than base metal. SUTTON et al [14] also examined mixed mode I/II fracture of welded specimens. They found that FSW affects fracture behavior and crack growth path. SANTOS et al [15] investigated fracture toughness of ISO 3183 steel thick plates which were friction stir welded using two passes on both sides of the plate by ceramic tool. They obtained fracture toughness by using the critical crack tip opening displacement (CTOD), revealing that joints produced with lower rotational speeds presented higher toughness in the heat affected zone (HAZ) and stir zone (SZ), which are comparable with the toughness of the base metal. PIRONDI and COLLINI [16] examined the fracture of composite aluminum alloy 6061 and 7005 plates reinforced with Al2O3 particles. The results of their tests on welded and un-welded specimens showed that FSW affects fracture toughness, and it is 25% lower for the former on welded specimen, but it is 10%-20% higher for the latter on welded specimen.
In recent years, many efforts have been devoted to studying optical methods to obtain mechanical properties of materials. Quality and reliability, being non-contact and also non-destructive, are significant factors needed for the development of these methods. Among optical methods, shearography has been further developed in the last decade due to the relative non-sensitivity to ambient disturbances, vibrations and noises such as rigid body movement and no additional reference beam (contrary to holography). Shearography has many applications such as measuring the strain, material properties, residual stress, and also for determining shape and slope of surfaces and vibrational analysis [17-24]. Additionally, this method can be used to measure stress intensity factor (SIF).
ERICSSON and SANDSTROM [25] studied fatigue behavior of friction stir welded joints for using in the manufacture of aircraft and automobile industries. However, this topic is of researchers�� interest, but the fatigue strength is not completely established because fatigue process is fundamentally complex and FSW is a relatively new advent technology. In recent years, many efforts have been done to study the fatigue properties in friction stir welded joints and the relationship between these properties and process parameters. JAMES et al [26] investigated the effect of process parameters, defects of welding and residual stress on fatigue behavior. FRATINI et al [27] studied the effects of welding residual stress on crack propagation. They showed that fatigue crack growth rate outside the welding zone is affected by residual stress and in the welding zone crack propagation is affected by microstructure and hardness changes. KIM et al [28] conducted fatigue tests on 6005-T5 aluminum alloy plates welded by FSW technique and gas metal arc welding (GMAW). They found that FSW joint strength is significantly higher than that of GMAW specimens. Also, it was observed that fatigue resistance in FSW specimens is reduced with increasing in tool rotational and traverse speed, and with decreasing tool tilt angle. MA et al [29] examined fatigue crack propagation rate in FSW joints of AA2198-T8. Fatigue test was conducted by creating crack in nugget zone at different load ratios (Rratio) on specimens. Their results showed that contrary to base metal, fatigue crack propagation rate is not sensitive to Rratio in welded specimens. Also, they performed FE simulation to evaluate the effects of residual stress. CIRELLO et al [30] examined the effects of FSW process parameters such as tool rotational and traverse speeds on fatigue resistance in FSW joints of aluminum alloy 6082-T6. Their results showed that the variation of process parameters has weak effect on fatigue resistance of welded joints. Also, the ratio of traverse speed to rotational speed is the most important parameter in determining the joints fatigue resistance. FENG et al [31] studied the effects of welding parameters on low cycle fatigue (LCF) behavior and microstructure of FSW welded specimens of AA6061-T651. They found that rotational speed has a negligible effect on the mechanical properties of the joints, while fatigue life is increased by increasing the traverse speed. Furthermore, FSW specimens have lower fatigue life than the base metal specimen.
The effects of FSW welding parameters on fracture toughness and fatigue crack growth rate have not been studied completely. For instance, the effects of tool rotational and traverse speeds on fracture toughness and fatigue crack propagation rate have not been investigated in literatures. In this work, the microstructure of FSW joints of 2024-T351 aluminum alloy and the effects of rotational and traverse speeds on hardness and residual stress were investigated. Fracture toughness was determined using standard test method and shearography optical method in mode I (KI). Also, the effects of rotational and traverse speeds on fracture toughness were studied. Numerical simulations of FSW were performed using thermal model to find the residual stress and fracture toughness for different rotational and traverse speeds. The numerical results were in good agreement with the experimental results and the model was validated. The effects of tool rotational and traverse speeds on fatigue crack propagation rate were studied in the nugget zone by performing fatigue tests on welded specimens. Also, fracture surfaces of the specimens were investigated by using SEM.
2 Experimental
2.1 Frictions stir welding
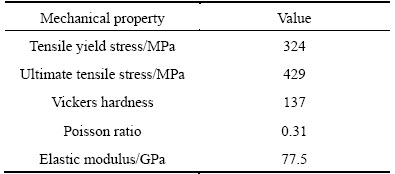
Welding was performed by milling machine on 2024-T351 aluminum alloy plates with dimensions of 35 mm �� 120 mm and 8 mm in thickness in butt joint way. Table 1 gives the chemical composition of 2024-T351 aluminum alloy measured by XRF analysis and the mechanical properties obtained from tensile tests are presented in Table 2.
Table 1 Elemental chemical composition of 2024-T351 aluminum alloy (mass fraction, %)

Table 2 Mechanical properties of 2024-T351 aluminum alloy
The welding tool (Fig. 1) which was made from steel alloy SPK 2436 with Rockwell hardness of 50, employed to weld the plates in longitudinal edge and parallel to rolling direction. Figure 2 shows the assembled parts prepared for FSW and the welded specimen.
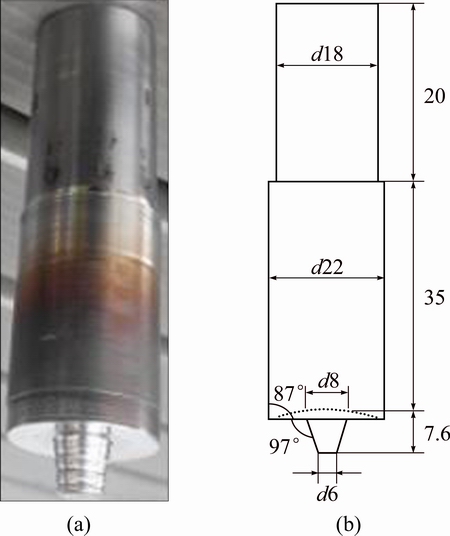
Fig. 1 Welding tool (a) and its geometry (b) (unit: mm)
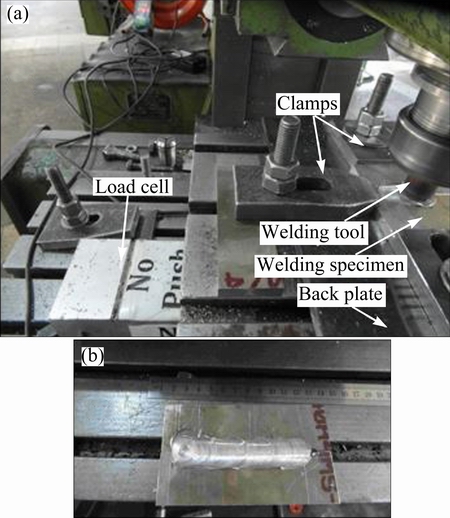
Fig. 2 Assembled parts for FSW (a) and welded specimen (b)
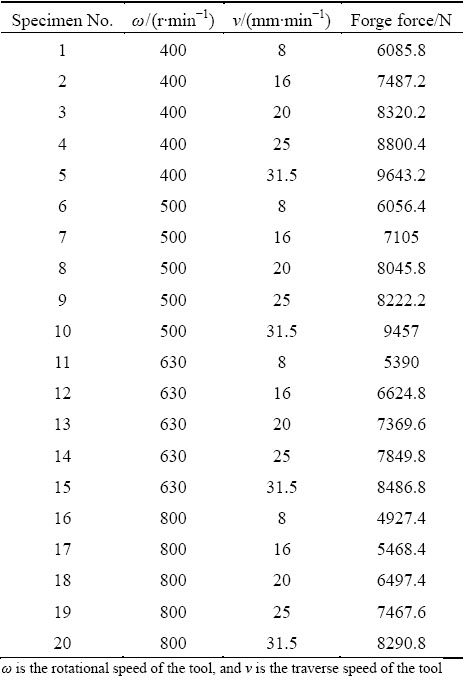
Different rotational and traverse speeds for FSW of the plates are presented in Table 3. It is observed that the minimum rotational speed which is appropriate for a proper welding is about 400 r/min because less values of rotational speed cannot provide sufficient heat for the welding. The mechanical properties and thickness of the plates are significant parameters which are restricted by the minimum rotational speed. Although the worst weld feature is a result of high rotational and traverse speeds of the tool (Fig. 3) and the burr implies that the insufficient and unsteady flow of material cannot fill the cavity made by the pin, especially on the advancing side (AS) [32]. It should be mentioned that, when the traverse speed increases, the shoulder cannot force the material into the flow of the pin at an increased rate. The softened material tends to accumulate under the shoulder, and therefore it has a tendency to lift away from the specimen resulting in surface voids, irregularities and a poor surface finish. By trial and error in experiments, proper rotational and traverse speeds of the tool are found to be 400-800 r/min and 8-31.5 mm/min, respectively, and the best welding morphology occurred in this interval of speeds. Additionally, other significant parameters of welding such as the plunge depth, the tool edge angle and the pin shape were chosen by trying different welds to achieve optimal heat generation. Optimum heat generation guaranties a proper material flow during the welding and consequently the burrs or cracks do not appear in the welding zone.
Table 3 Different values of applied rotational and traverse speeds and measured forge forces of FSW experiments
The forge force was measured using a load cell which was calibrated and attached under the clamps.
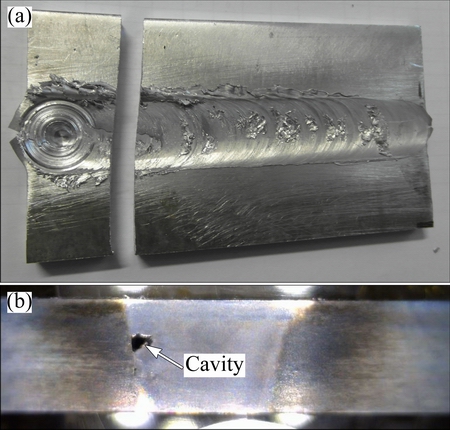
Fig. 3 Inappropriate welding feature at rotational speed of 1200 r/min and traverse speed of 31.5 mm/min (a), and cavity made by pin at weld section (b)
The load cell capacity is 14700 N and the axial force of the milling machine could be determined during the welding process. The forging force values for welding of some specimens are shown in Fig. 4, which is approximately constant during the FSW, as mentioned in literature [32]. Table 3 includes the forge force values of FSW experiments. At constant shoulder plunge depth, forge force values changed by various tool rotational and traverse speeds. When the rotation speed increases, the heat input in the stirred zone also increases due to the higher friction heat which in turn results in intense stirring and mixing of materials [33]. So, the shear strength decreased significantly at high rotational speed, which means that the material becomes more flowable around the tool. On the other hand, the forging forces are lower at high rotational speed. Furthermore, the forging force increases significantly with increasing in traverse speed. This is expected due to a reduction in heat input and thermal softening and resultantly the higher forging force, which is required for movement of the tool in harder material.
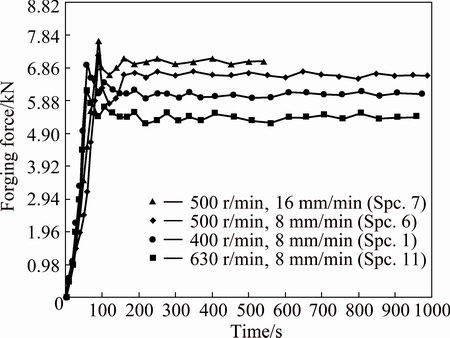
Fig. 4 Forging forces during welding for different specimens
2.2 Morphological analysis and Vickers test
The microstructure of the transverse section of the joints can be observed after surface preparation according to ASTM E3-01 [34] and etching Keller��s reagent (95% H2O, 2.5% HNO3, 1.5% HCl, and 1% HF). Vickers microhardness test was conducted according to ASTM E384 [35] on cross-section of specimens with the applied load of 50 g and the dwell time of 15 s. Hardness profile was extracted for the middle cross section of the specimens.
2.3 Longitudinal residual stress measurement
The analysis of the longitudinal residual stress for welded specimens was performed using standard X-ray diffraction method. The basic methodology for XRD method is available in Refs. [36,37].
Based on the X-ray diffraction test method, at first, the angle (2��) of the most appropriate peak should be determined. For this purpose, the considered surface was exposed to the X-ray for spectral analysis from 0�� to 150��. When the intensity and accuracy of the peaks are proper, the residual stress measurement will be performed. In this work, the 2�� scanning angle for the specimens was considered from 133.8�� to 140.8�� and the specimen rotated in seven tilt angles of �� (from 0 to 0.6 with 0.1 increment for sin2��). Eventually, assuming the linear relation between lattice spacing d and sin2��, the values of residual stress can be calculated [36,37].
2.4 Fracture toughness and fatigue testing
The fracture toughness and fatigue crack growth experiments were performed on the non-welded and welded specimens using universal 10 t tensile test machine. For detecting more accurate crack length, a camera was used in addition to the extensometer. Fracture and fatigue tests were performed on compact tension (CT) specimens (Fig. 5). The specimens were machined in L-T orientation relative to the plate rolling direction. The crown side of FSW specimens was also machined to remove flash and to ensure that the opposite sides of each specimen are parallel and the final thickness of the specimens is 6 mm. A Chevron notch was created in the middle of weld nugget using spark process in CT specimens, and crack orientation is along the welding direction. Chevron starter notches have 17 mm in length as measured from the specimen load-line (hole centers).
Specimen geometry, preparation and testing were performed according to ASTM E399 [38] for fracture toughness measurement and ASTM E647 [39] was employed to measure fatigue crack growth rate. Specimens were pre-cracked at a frequency of 10 Hz, and the crack length reached 25 mm for fracture toughness testing and 18.5 mm for fatigue crack growth testing. Loading rate of all fracture toughness tests was 0.1 kN/s. Figure 6 shows the tensile load versus crack opening displacement (COD) curves obtained from experiments, which is used to calculate fracture toughness according to ASTM E399.
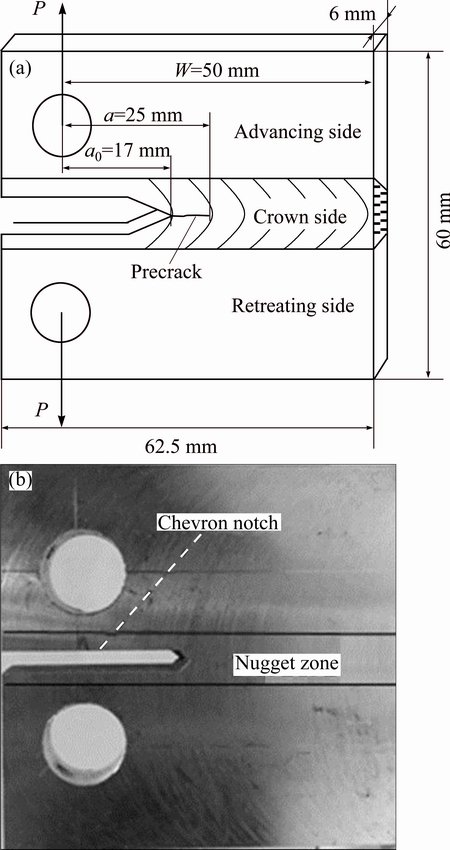
Fig. 5 Dimensions of compact tension (CT) specimen (a) and prepared CT specimen (b)
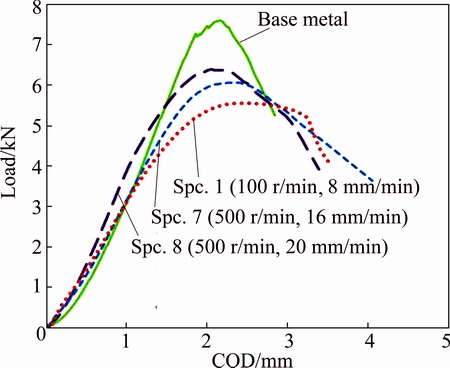
Fig. 6 Load vs COD curves for different specimens
Fatigue tests were performed under constant load amplitude control, at minimum to maximum load ratio of 0.1 and frequency of 10 Hz. Crack length was monitored by the compliance method. Tests were continued to the crack length of 47 mm or at specimen breakage.
There were 21 different specimens including 20 different welding conditions and the base metal, and each fatigue test was repeated at least three times for these specimens to decrease the uncertainty. All these experiments were conducted to study the fatigue behavior of FSW joints. Crack length versus cycles data were obtained based on the ��incremental polynomial method�� for estimating fatigue crack propagation rate (da/dN) versus stress intensity factor (SIF) range (��K) propagation curves.
After breakage, all fracture surfaces were observed and examined by means of scanning electron microscopy (SEM), to analyze the fracture mechanism. To decrease the intrinsic scatter due to welding, the propagation curves were plotted as the average of three repeated tests. The propagation curves were approximated as the average of propagation rates which have the same amount of ��K.
2.5 Determination of KI by digital shearography
Digital shearography is a non-contact, full field and optical measurement method, which is able to measure directly the deformation gradient. Hence, shearography was used to determine the opening mode (Mode I) SIF of friction stir welded CT specimens in this research. An optical setup of digital shearography is shown in Fig. 7. In this method, the test object is illuminated using an expanded laser beam to form a speckle image and the image is recorded by a CCD-camera where a shearing device (modified Michelson interferometer) is implemented in front of camera lens. A pair of laterally displaced (or sheared) images of the test object is generated on the CCD-camera [40]. A speckle pattern is produced by interfering of the two sheared images. After any deformation on the object surface, another speckle pattern is provided, and the result of the subtraction operation between two digitals information (two speckle patterns) yields a fringe pattern called ��digital shearogram�� depicting the fringe phase ��.

Fig. 7 Optical setup of digital shearography based on Michelson interferometer
It can be shown that the relative phase change is proportional to the displacement derivatives instead of displacement itself due to the shearing function of shearography [40]. For the x component of shearing direction, relative phase change ( ) is as follows:
 (1)
(1)
where ks is the sensitivity vector; ��x is the image shearing that is directed along the x-axis and w is the displacement component along the z-axis. For the shearing along the y direction, relative phase change (��y) is
 (2)
(2)
where ��y is the image shearing that is directed along the y-axis.
The out of plane component of displacement in plane stress state could be written as
 (3)
(3)
where ��, h and E represent Poisson ratio, specimen thickness and elastic modulus, respectively. According to linear elastic fracture mechanics (LEFM) relations, normal components of stress field near the crack tip (��x, ��y) are expressed in terms of mode I SIF (KI) and polar coordinate components (r, ��). By substituting the stress components into Eq. (3) and through transforming partial differential relation from polar coordinates into Cartesian coordinate, first partial derivative components of displacement (w) can be achieved. Eventually, by substituting these derivative components into Eqs. (1) and (2) and considering  , where �� is the laser wave length and �� is the angle between illuminating and viewing direction (assuming ��= 0), ��x and ��y are derived as
 (4)
(4)
 (5)
(5)
Figure 8 shows the optical setup and loading system of shearography experiment. As illustrated in this figure, an Al-7000M Gotech universal tensile machine was employed to load the specimens and a helium-Neon laser (wave length of 632.8 nm) was utilized to illuminate the surface of the specimens. Speckle pattern was formed using a simple Michelson interferometer.
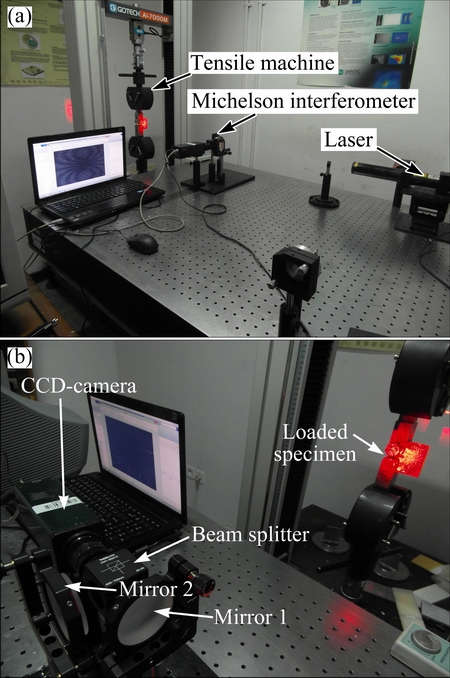
Fig. 8 Test setup of digital shearography (a) and Michelson interferometer (b)
The pre-cracked CT specimens with 25 mm in crack length were tested to measure fracture toughness by shearoghraghy optical method. The shear value is adjusted to 5 mm for all cases. The speckle patterns have been taken using a digital CCD camera. The fringe patterns will appear by subtracting the intensities before and after the loading, which is demonstrated by the out of plane displacement derivatives  w/y.
w/y.
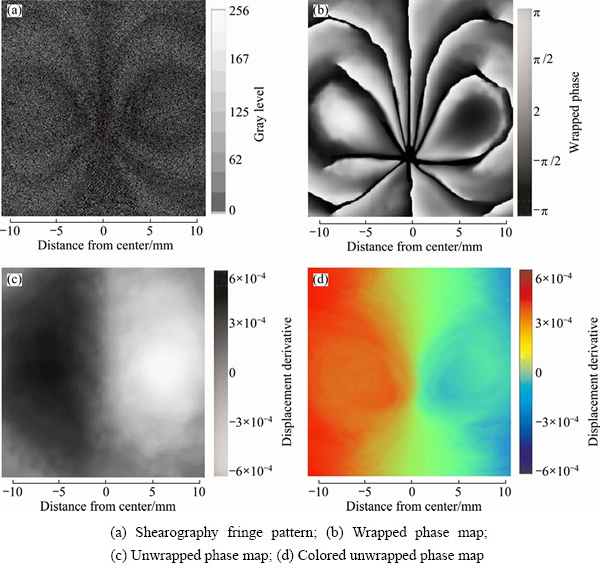
Fig. 9 Shearography results of loading (3 kN) of Specimen 1
The obtained shearographic fringe pattern of Specimen 1 under loading 3 kN is shown in Fig. 9(a). To extract the phase information from shearograms (fringe patterns), wavelet transformation was implemented in this work. The steps of image processing for extracting the phase information of Specimen 1 are represented in Figs. 9(b) and (c). After eliminating the noises of shearogram, 1D Paul wavelet algorithm was used to calculate the wrapped phase map of Fig. 9(b). The last stage was to unwrap phase map (Figs. 9(c) and (d)) which was determined by applying a phase unwrapping algorithm [41]. The extracted phase map was used to calculate SIF according to Eq. (5). Although the data of one point were sufficient to determine SIF, in order to take advantage of whole field shearography and increase the accuracy of SIF, the data of several points were registered and least squares method was utilized [42].
3 Numerical simulation
The numerical analysis was performed based on FE simulation using a thermal model. Hence, the generated heat should be determined in the FSW process. By considering the tool pin shape as a cylinder which is connected to the tool shoulder with angle �� toward inside, the total generated heat (Qtotal) under the partial sliding/sticking condition [43] can be expressed as follows:

 (6)
(6)
where �� is the tool rotational speed, ��yield is the yield stress of material at welding temperature, �� is the friction coefficient, p is the forge pressure, Rshoulder is the radius of the tool��s shoulder, Rprobe and Hprobe are the radii at middle section and the height of the tool pin, respectively, �� is the shoulder cone angle, and �� is the contact state variable (dimensionless slip rate) with 0<��<1 for partial sliding/sticking.
For numerical simulation, a rectangular plate was modeled with dimensions of 120 mm �� 70 mm and thickness of 8 mm that was meshed by C3D8T eight-node quadrangular elements (Fig. 10). The tool rotational and traverse speeds were considered according to Table 3. The material properties were modeled using the Johnson-Cook model [44]:

 (7)
(7)
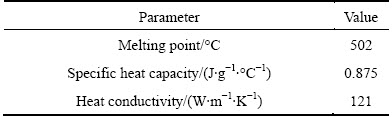
where ��p is the plastic strain, ���� p is the plastic strain rate, T is the material temperature, Tmelt is the melting point of the material, ��yield is the yield stress at temperature T, and the coefficients of this equation are listed in Table 4 [44]. The thermal properties of aluminum alloy 2024-T351 are provided in Table 5 [45].
The moving heat source which is applied to the elements of the simulation is calculated from Eq. (6). In this equation, the optimal amount of �� is obtained by repeating simulation for different values of ��. The best value of �� (=0.25) is the state that numerical and experimental results of residual stress and fracture toughness have the best agreement. Friction coefficient �� is considered to be 0.4 and the forge pressure (p) is obtained from experimental forge forces and tool section area.
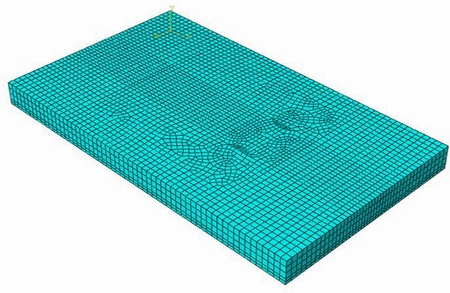
Fig. 10 Meshed plate using C3D8T eight-node quadrangular elements
Table 4 Coefficients of Johnson-Cook model for aluminum alloy 2024-T351 [44]
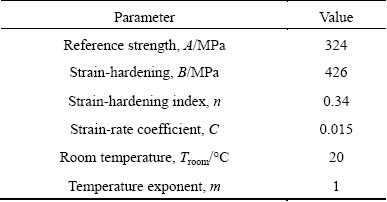
Table 5 Thermal properties of aluminum alloy 2024-T351 [45]
Computed temperature contours on the top surface of the workpiece during the welding for Specimens 2, 10 and 12 are shown in Fig. 11. The maximum temperatures of some specimens during the welding process are illustrated in Fig. 12. Based on Fig. 12, the maximum temperature is increased by increasing the tool rotational speed, or decreasing the traverse speed of the tool.
After the welding process simulation, the new dimensions of the welded plate are 60 mm �� 62.5 mm with thickness of 6 mm, using the model change method for preparing the CT model. Figure 13 shows the residual stress contour of changed model Specimens 1, 14 and 20.

Fig. 11 Maximum temperature during welding process for Specimens 2, 10 and 12
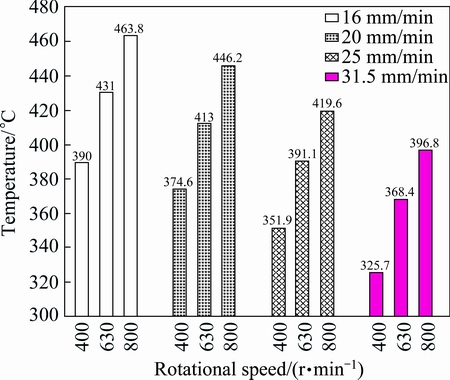
Fig. 12 Maximum temperatures for some specimens during welding under different welding conditions
The second change model was used to create a notch with 17 mm in length in the weld line, and a crack with a length of 8 mm was modeled at the end of the notch. Then, a tensile load was applied at the cracked CT specimen holes and SIF (KI) was determined for specimens.
4 Result and discussion
4.1 Morphological analysis
Considering the structural properties of the grains, four different zones were observed in all welding specimens: 1) the nugget zone with very fine, homogeneous and equiaxed microstructure; 2) the thermo-mechanical affected zone (TMAZ), which is partially recrystallized and modified by severe deformation and heating induced by friction; 3) the heat affected zone (HAZ), produced by thermal cycle of heating and cooling near welding; and 4) the base metal, which is unaffected by welding.
Microstructure images for different sections of the welded zone are illustrated in Fig. 14. In the nugget zone, the material underwent the most severe plastic deformation and the highest temperature conditions. Due to the friction between the shoulder and specimen and the plastic deformation of the material, the temperature increases to (0.6-0.9)Tm, where Tm is the melting point [46,47].
The TMAZ is located around the nugget zone with a different microstructure affected by heat and mechanical work; however, the influence of the welding on its microstructure is lower than the nugget zone and the effect of rotational flow on elongated grains is apparent. The HAZ is the region beyond the TMAZ. This zone experienced a thermal cycle, without any plastic deformation during the welding, and the change in its microstructure is lower than that in the nugget zone and TMAZ.
4.2 Hardness
Severe plastic deformation has great influence on mechanical properties of heat treatable and non-heat treatable aluminum alloys. For heat treatable aluminum alloys welded by FSW, hardness would be decreased in welded zone [48] and the hardness of the advanced side of FSW welds is lower than that of the retreating side [49]. When the dynamic recrystallization occurs, the grain structure of the base metal will be replaced by a proper equiaxed recrystallized grain structure in the stirred zone. The recrystallized grain size is influenced by the generated heat, and the hardness depends on the microstructure of the stirred zone under different welding conditions [49].
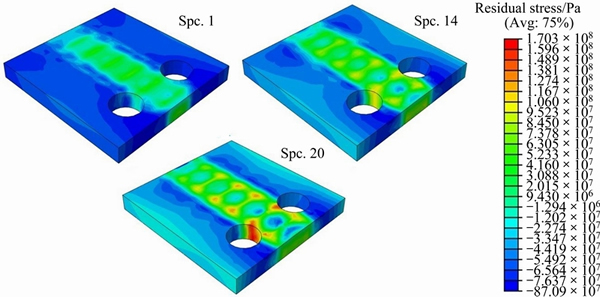
Fig. 13 Residual stress contour after cooling and changing in dimensions for Specimens 1, 14 and 20
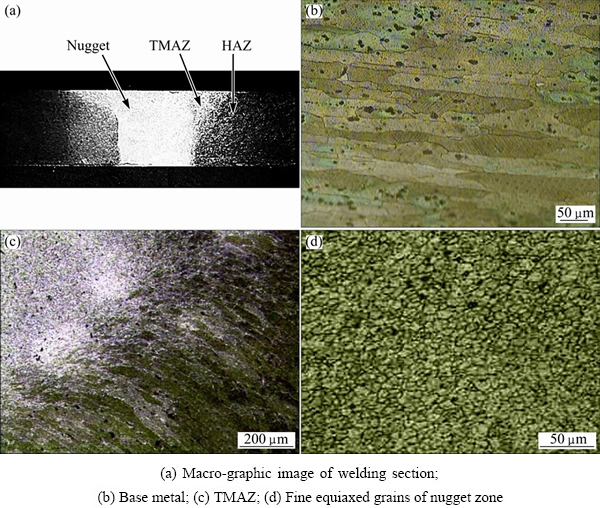
Fig. 14 Optical micrographs associated with welded zone sections for Specimen 1
Vickers microhardness is obtained for specimens which are welded with different rotational and traverse speeds of the tool. Figure 15 shows the microhardness results on the middle line of transversal section from nugget (center) to base metal (B. M) (advancing and retreating sides). The hardness profile displayed W-shape, which is characteristic for friction stir welds of precipitation hardening aluminum alloys [48,49]. The grains structure of the welding zone is affected by heat and plastic deformation and its hardness is lower than that of the base metal.
Due to high generated heat in FSW process, the precipitates of Al2CuMg (S) in the alloy base (Al) which is the significant reason for the hardness of the aluminum alloy 2024 [50], were either dissolved or aggregated, and consequently the hardness would be decreased in the heated region. Furthermore, the size of recrystallized grain varies with heat input [48], therefore, it can be concluded that the generation of refined grains and the higher S particles density in the stirred zone are the main factors that cause the hardness increase associated with decreasing heat input. As illustrated in Fig. 15, the nugget zone is significantly harder than TMAZ because of refined and equiaxed grains. Figure 16 summarizes the dependence of average microhardness of the stir zone on the rotational and traverse speeds of the tool. As mentioned before, with the increase in traverse speed, there would be a decrease in maximum temperature, and consequently a decrease in solving or aggregating of the strengthening precipitates. Therefore, the hardness of the welded zones (HAZ, TMAZ and nugget) has fewer reduction, by increasing the traverse speed of the welding. Additionally, with the increase in rotational speed, there would be an increase in maximum temperature, and enhancement in the hardness reduction of each welding zones.
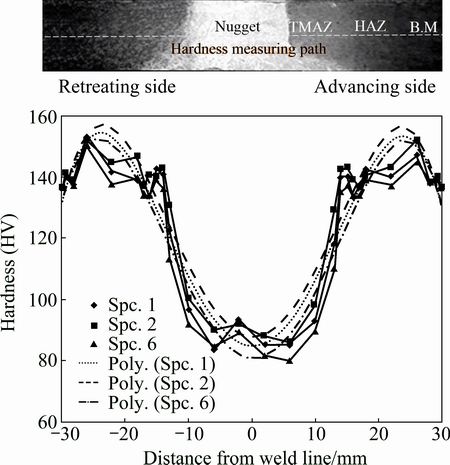
Fig. 15 Vickers microhardness of Specimens 1, 2 and 6
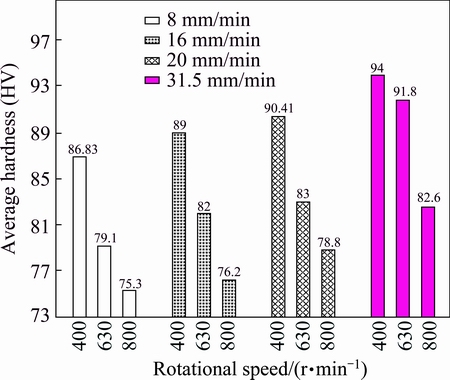
Fig. 16 Microhardness of stir zone for different rotational and traverse speeds of tool
4.3 Residual stress
Residual stress was studied using standard X-ray diffraction method for the welded CT specimens without notch. Residual stresses, which are perpendicular to the weld line, were measured in a few square regions with 5 mm sides. Figure 17 illustrates the numerical and experimental results of the longitudinal residual stress for Specimens 12, 15, 17 and 20. According to Fig. 17, the residual stress in the welding zone which is in contact with tool shoulder (with 22 mm in width), has the maximum positive values; in the rest of the regions, the compressive residual stress is observed. It can be seen that the tensile residual stress peaks are located in the region which is around ��8 mm far from the weld line, and this distance indicates the region which is in contact with the edge of the tool shoulder, before dropping slightly at the weld center. The dip around the pin position may be due to the high temperatures generated in this region, which would limit the capacity of the material to support the applying load [51].
Figure 18 shows mean value of the residual stress in the transverse distance of ��10 mm relative to the weld line, for different rotational and traverse speeds of the tool. It shows that at a constant traverse speed, with an increase in tool rotational speed, there would be an increase in the mean value of longitudinal residual stress, due to the increase in generated heat in the welding zone. Also at a constant rotational speed, increasing the traverse speed leads to the fact that the peak stresses become closer to the weld line and the stress values would be increased. The former may be due to the reduction in generated heat that accompanies with an increase in traverse speed. This would result in a reduction in the width of the high temperature zone around the tool. Also, this could be a result of the increased thermal gradients during higher traverse speed of welding. The residual stress profile indicates a mild asymmetry within the welds which is about 10% higher on the advancing side (only for experimental results).
4.4 Fracture toughness
Experimental measurement (based on ASTM E399) and shearography tests were performed on specimens to study the effect of rotational and traverse speeds of the tool on fracture toughness. Table 6 shows the fracture toughness results of standard test (ASTM E399), shearography test and numerical simulation for some specimens. Based on KIC (fracture toughness of Mode 1) validation (Table 7), it is observed that the obtained results are not valid, and this difference may be due to the thin plates and the brittle fracture phenomenon without considerable plastic deformation. Considering Fig. 6 and Table 6, it can be concluded that the maximum fracture load (PQ) of base metal is approximately 8 kN, which is higher than PQ of all the welded specimens. As a result, the welded specimens have lower fracture toughness, which is between 51% and 82% of non-welded specimen. This abjection is expected based on the fact that the weld microstructure has been modified from a form that was developed in order to maximize the fracture toughness of the material (2024-T3) [13]. Thus, it can be concluded that the welding operation would decrease the fracture toughness, maybe due to the existence of wormholes along the weld line. Furthermore, coarse precipitates cause lower tensile strength [48,52], welding zone hardness and consequently fracture toughness of the welded specimens. Besides, it can be seen that specimens behave differently during the loading. Table 6 shows the results of the fracture toughness for some specimens. The differences between standard test results and shearography and numerical results are approximately 14% and 9%, respectively.
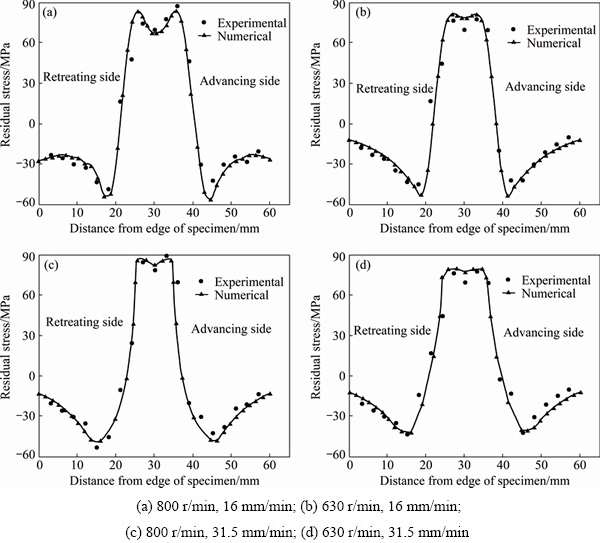
Fig. 17 Longitudinal residual stress obtained from experimental results and numerical simulation for Specimens 12 (a), 15 (b), 17 (c) and 20 (d)
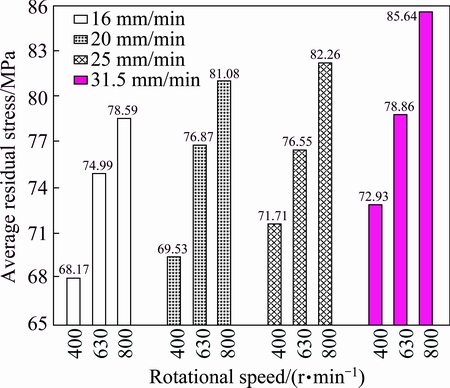
Fig. 18 Average longitudinal residual stress for different rotational and traverse speeds of tool
Comparing shearography and standard test results demonstrates that the digital shearography is a novel technique that can be utilized to determine the fracture toughness. According to Fig. 19, one can conclude that at each constant rotational speed, the welds fracture toughness reached the maximum values of 46.8, 47.2, 46.9 and 47.1 MPa��m1/2 which occurred at the speed ratios (��/v) of 400/16, 500/20, 630/25, 800/31.5 r/mm, respectively. Then, the fracture toughness results at each rotational speed decreased gradually. At lower traverse speeds higher heat generation, consequently lower nugget hardness and the overaging or coarse precipitates followed by dissolving of strengthening precipitates at high temperatures may be the main factors that provide the low PQ (as a result low fracture toughness) in the stir zone. Also for the specimens that have been welded with higher traverse speed, the probability of defects increases and some defects such as tunnel defects behave as a notch that increases stress intensity factor locally, resultantly the fracture occurred at lower PQ. From the obtained fracture toughness results, it can be found that, at lower traverse speeds (e.g., 8 and 16 mm/min), as the rotational speed and consequently inputted heat increased, considering the reduction of strengthening precipitates in stir zone, the joints fracture toughness decreased. At higher traverse speeds (e.g., 31.5 mm/min) it is seen that at fixed traverse speed, increasing the tool rotational speed causes to increase the joints fracture toughness because of the grains refinement and higher recrystallization in the stir zone.
Table 6 Experimental and numerical results of fracture toughness for some specimens
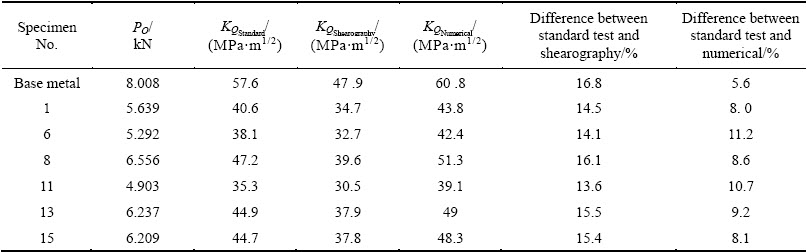
Table 7 Validation for KIC
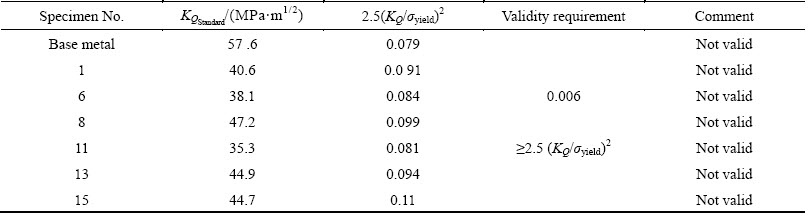
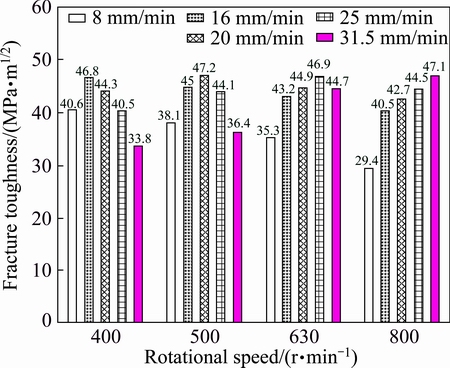
Fig. 19 Fracture toughness of some specimens at various rotational and traverse speeds of tool
The optimum tool rotational and traverse speeds were essential to generate adequate frictional heat as it produced defect-free welded joints with better mechanical properties and higher fracture toughness by sufficient strain of plasticized material with fine recrystallized grains. From the fracture toughness results, it can be found that the fracture toughness is higher at the speed ratios (��/v) of 400/16, 500/20, 630/25, and 800/31.5 r/mm, and the optimum welding conditions can be obtained at this interval of ��/ v .
4.5 Fatigue crack propagation rate
Fatigue tests were conducted for specimens where the SIF range is 8-38 MPa��m1/2 and the crack propagation rate is about 4��10-7 to 4��10-3 mm/cycle. Figure 20 shows the crack propagation diagram specimens under four different welding conditions and the base metal.
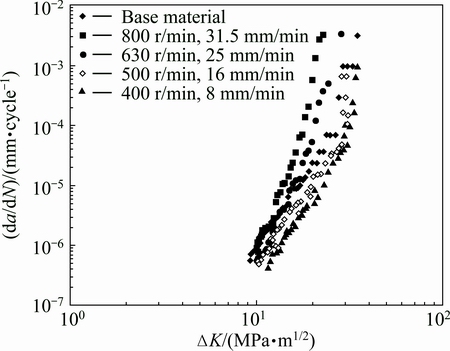
Fig. 20 Fatigue crack growth rate vs stress intensity factor range (��K) diagram of base metal and some welded specimens
Experimental results confirm that the welding conditions have influence on fatigue curves. At low values of ��K (in fatigue curve), propagation rate of welded specimens is always less than or equal to that of base metal. At higher rotational and traverse speeds, fatigue curve of welded specimens is located below the fatigue curve of base metal at low values of ��K, but the crack growth rate slowly achieves higher levels at the high values of ��K. At the rotational speed of 400 r/min and traverse speed of 8 mm/min, the fatigue curve does not exceed the base metal, and generally for low rotational and traverse speeds, the crack propagation rate at any ��K is lower than that of the base metal (e.g., 400 r/min, 8 mm/min and 500 r/min, 16 mm/min). This behavior is more apparent in Fig. 21. This figure illustrates the normalized propagation rate which is defined based on the ratio of the crack propagation rate in welded specimen (da/dN)w to propagation rate of base metal (da/dN)b. The effects of rotational and traverse speeds on fatigue behavior of specimens can be summarized as follows: higher rotational and traverse speeds lead to higher propagation rate.
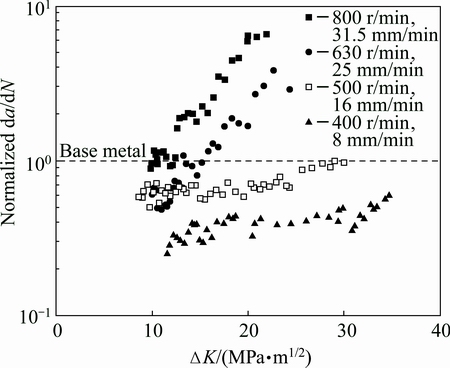
Fig. 21 Normalized fatigue crack growth rate vs stress intensity range diagram
The crack propagation rate of welded specimens at lower rotational and traverse speeds (400 r/min, 8 mm/min) is almost 4 times lower for low values of ��K (��K=11 MPa��m1/2) and it will increase up to 60% in base metal for higher values of ��K (��K=34 MPa��m1/2). At rotational speed of 630 r/min and traverse speed of 25 mm/min, the normalized propagation rate is started from 0.5 and at ��K=15 MPa��m1/2 it reaches the values higher than that of the base metal. At higher rotational and traverse speeds (800 r/min, 31.5 mm/min), the propagation rate is about 5 times higher than that of the base metal at ��K=22 MPa��m1/2.
Figure 22 shows the effect of welding traverse speed on fatigue behavior of welded specimens. At lower rotational speed of 400 r/min, with increasing in traverse speed, the crack propagation rate is increased, but the crack propagation rate is lower than that of the base metal; in other words, at low rotational speeds, welded specimens show better fatigue behavior. At higher rotational speeds, the crack propagation rate of welded specimens is higher than that of the base metal, and increasing the traverse speed will increase the crack propagation rate. Therefore, it can be concluded that traverse speed will affect the fatigue behavior. Increasing the rotational speed from 400 to 800 r/min will change fatigue behavior of specimens, so that the welded specimens would have better behavior than base metal at low traverse speeds, but crack propagation rate will be much faster at high traverse speeds (especially for higher values of ��K). Figure 23 illustrates the variation of fatigue curves when the rotational speed increases from 400 to 800 r/min at a constant traverse speed of 16 mm/min. It is observed that with the increase of rotational speed, the fatigue crack propagation rate will increase.
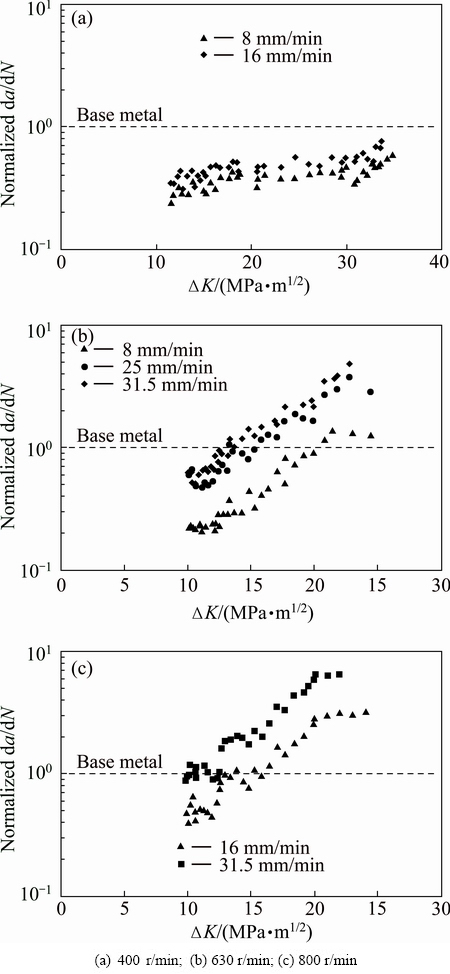
Fig. 22 Effect of traverse speed on normalized crack propagation rate at different rotational speeds
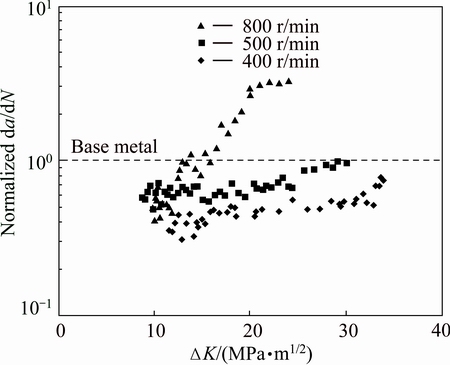
Fig. 23 Effect of rotational speed on normalized crack propagation rate at traverse speed of 16 mm/min
Although all requirements of ASTM E647 are observed, the crack tends to move away from the central line of the welded specimen (contrary to base metal). This might be due to the difference of mechanical properties among nugget zone (initial position of the crack), TMAZ and HAZ. Also, residual stress distribution is different in these zones affecting the crack deviation from the center.
Welding parameters affect the fatigue behavior and preferential path of crack propagation due to difference between the microstructure and dimensions of weakened zone around the nugget zone. In some specimens, the crack propagation is different on two sides of the specimen. On the crown side (tool side) of the specimen, the crack deviation is more due to high plasticization.
Based on macroscopic morphology of fracture surfaces for CT specimens after fatigue test, three regions are apparent on fracture surface: fatigue pre-cracking, crack propagation and final rupture. In pre-cracking zone, crack initiation occurs due to microstructural defects. It should be considered that tunnel defects are often observed in the crack propagation region (Fig. 24); however, in specimens with the best fatigue properties, tunnel defects are not observed. Higher welding rotational speeds cause tunnel defects because of the abnormal stirring of the plasticized metal, and higher traverse speeds easily result in piping defects because of the insufficient heat generation [53,54]. It seems that these defects will affect the direction of crack propagation and propagation rate. Therefore, the defects behave as a notch that increases SIF locally and accelerate the crack propagation mainly at higher values of ��K, where the effect of internal compressive residual stress generated by FSW can be ignored. In other words, internal residual stress will be effective at lower values of ��K, so the fatigue crack propagation rate in welded specimens is reduced relative to base metal. JOHN et al [55] studied the effect of residual stresses distribution generated by FSW on the fatigue resistance of aluminum alloys. Compressive stresses along the welding line will reduce the crack tip SIF, thus, the crack propagation rate is reduced. JAMES et al [56] by investigating the effect of welding residual stress found that crack propagation reduction occurred in specimens at low values of ��K. Further increase in ��K reduces the positive effect of compressive residual stresses on crack propagation. So, at higher values of ��K, the crack propagation rate of welded specimens is higher than that of the base metal. Therefore, the effect of rotational and traverse speeds on fatigue behavior of FSW joints is complicate. At low values of ��K, internal residual stresses reduce the crack propagation rate, and at high values of ��K, metallurgical defects increase the crack propagation rate to the level even higher than that of base metal.
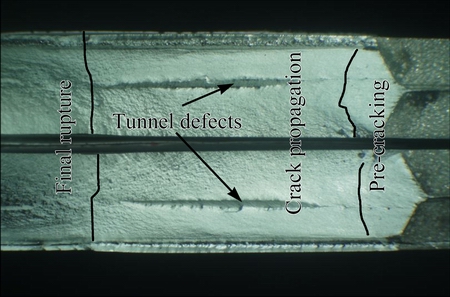
Fig. 24 Fracture surface of specimen welded by inappropriate welding condition (1000 r/min, 25 mm/min)
4.6 Fractography
The fracture surfaces of CT specimens were studied by scanning electron microscopy (SEM). Figure 25 shows the pre-cracked zone and also the crack initiation in the chevron notch tip. Due to geometry of Chevron notch, Crack initiation starts in all specimens almost from the same zone (chevron tip). Figure 25(b) illustrates the fatigue crack propagation zone where the crack is propagated in recrystallized fine nugget zone and also the final rupture. According to Fig. 25(c), which magnifies the final rupture zone, ductile behavior can be seen in this zone.
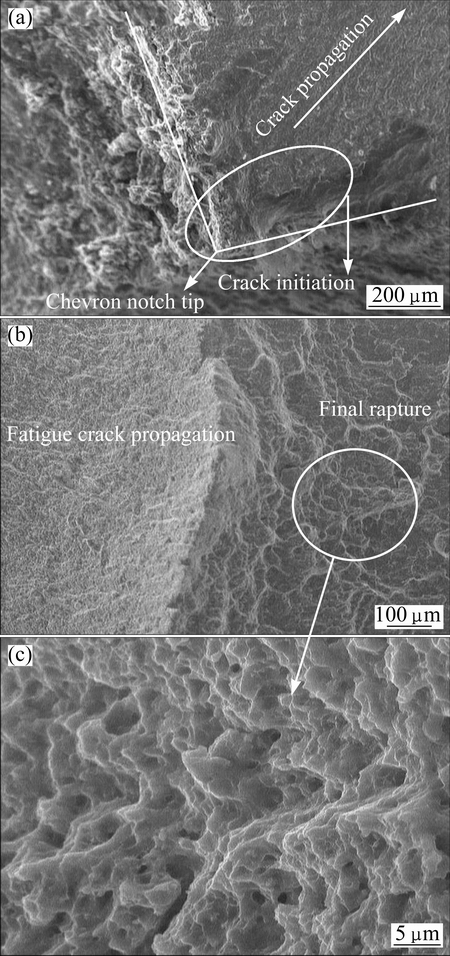
Fig. 25 Crack initiation in Chevron notch tip and fatigue crack propagation for welded CT specimen (400 r/min, 8 mm/min) (a), distinct zones of crack propagation and final rapture (b), and final rapture zone at higher magnification (c)
Figure 26 shows the difference of fracture surface of fatigue crack propagation zone between base metal and welded specimen. It is seen that the crack propagation in base metal is completely different and characterized by the presence of flat areas in the low ��K zone, and the crack propagation on multiple plateaus joined by tear ridges. In the crack propagation zone, the fracture surface of welded specimens includes a large number of intergranular facets at low values of ��K (Fig. 26) which is confirmed in Refs. [57,58]. It should be noted that intergranular facets significantly reduce the crack propagation rate (as shown in propagation curves). This effect can be justified due to increased tortuosity created in the path of crack and crack deviation from the plain of maximum stress. At high values of ��K, the fracture surfaces in base metal and welded specimen are very similar.
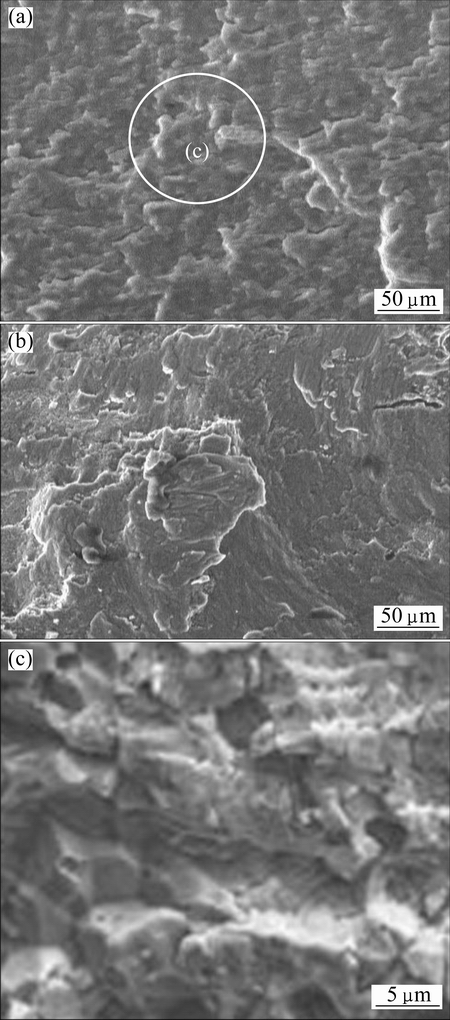
Fig. 26 Fatigue propagation of welded specimen at 500 r/min and 16 mm/min (a), base metal (b), and intergranular facets of welded specimen fracture surface (c)
5 Conclusions
1) The microhardness of welding zone is lower than that of the base metal, and the microhardness profile is in W-shape on the welding section. By increasing the traverse speed or decreasing the rotational speed of the tool, there would be a decrease in hardness. Increasing the rotational or traverse speed of the tool causes the increase of the longitudinal residual stress in the welded zone. 18%-49% reductions in maximum fracture load and fracture toughness are observed in welded specimens compared with the base metal.
2) Digital shearography was employed as a novel method to determine the SIF (��K) in FSW specimens. The maximum difference between shearography and standard test results is less than 15%. At lower traverse speeds, dissolving of strengthening precipitates and the lower nugget hardness provided low fracture toughness. At higher traverse or rotational speeds of the tool, increasing the probability of defects may contribute to low fracture toughness.
3) At low values of ��K, the fatigue crack propagation rate in the weld nugget is always slower than that in the base metal. The increase in rotational and traverse speeds of the tool will increase the crack propagation rate of the welded specimens. In the low ��K region, crack propagates on multiple plateaus joined by tear ridges in base metal, and for the welded specimens, the crack propagation rate is reduced due to presence of a large number of intergranular facets.
References
[1] THOMAS W M, NICHOLAS E D, NEEDHAM J C, MURCH M G, TEMPLESMITH P, DAWES C J. Friction stir welding: International patent application and Great Britain patent application, PCT/GB92102203 [P]. 1991-12-01.
[2] PEEL M, STEUWER A, PREUSS M, WITHERS P J. Microstructure, mechanical properties and residual stresses as a function of welding speed in aluminium AA5083 friction stir welds [J]. Acta Mater, 2003, 51: 4791-4801.
[3] NANDAN R, DEBROY T, BHADESHIA H K D H. Recent advances in friction-stir welding��Process, weldment structure and properties [J]. Prog Mater Sci, 2008, 53: 980-1023.
[4] TALWAR R, BOLSER D, LEDERICH R, BAUMAN J. Friction stir welding of airframe structures [C]//Proceedings of the Second International Symposium on Friction Stir Welding. Gothenburg, Sweden, 2000.
[5] LOHWASSER D. Application of friction stir welding for aircraft industry [C]//Proceedings of the Second International Symposium On Friction Stir Welding. Gothenburg, Sweden, 2000.
[6] MOSHWAN R, FARAZILA Y, HASSAN M A, RAHMAT S M. Effect of tool rotational speed on force generation, microstructure and mechanical properties of friction stir welded Al-Mg-Cr-Mn (AA 5052-0) alloy [J]. J Mater Des, 2014, 66: 118-128.
[7] LAKSHMINARAYANAN A K, BALASUBRAMANIAN V. Process parameters optimization for friction stir welding of RDE-40 aluminium alloy using Taguchi technique [J]. Transactions of Nonferrous Metals Society of China, 2008, 18(3): 548-554.
[8] KRASNOWSKI K, HAMILTON C, DYMEK S. Influence of the tool shape and weld configuration on microstructure and mechanical properties of the Al 6082 alloy FSW joints [J]. Arch Civ Mech Eng, 2014, 15: 133-141.
[9] XU W F, LIU J H, ZHU H Q. Analysis of residual stresses in thick aluminum friction stir welded butt joints [J]. J Mater Des, 2011, 32: 2000-2005.
[10] CHO H H, HONG S T, ROH J H, CHOI H S, KANG S H, STEEL R J, HAN H N. Three-dimensional numerical and experimental investigation on friction stir welding processes of ferritic stainless steel [J]. Acta Mater, 2013, 61: 2649-2661.
[11] ZHANG Z, WU Q, ZHANG H. Numerical studies of effect of tool sizes and pin shapes on friction stir welding of AA2024-T3 alloy [J]. Transactions of Nonferrous Metals Society of China, 2014, 24(10): 3293-3301.
[12] CHIUMENTI M, CERVERA M, de AGELET SARACIBAR C, DIALAMI N. Numerical modeling of friction stir welding processes [J]. Comput Method Appl Mech Eng, 2013, 254: 353-369.
[13] SUTTON M A, REYNOLDS A P, YANG B, TAYLOR R. Mode I fracture and microstructure for 2024-T3 friction stir welds [J]. J Mater Sci Eng A, 2003, 354: 6-16.
[14] SUTTON M A, REYNOLDS A P, YANG B, TAYLOR R. Mixed mode I/II fracture of 2024-T3 friction stir welds [J]. Eng Fract Mech, 2003, 70: 2215-2234.
[15] SANTOS T F A, HERMENEGILDO T F C, AFONSO C R M, MARINHO R R, PAES M T P, RAMIREZ A J. Fracture toughness of ISO 3183 X80M (API 5L X80) steel friction stir welds [J]. Eng Fract Mech, 2010, 77: 2937-2945.
[16] PIRONDI A, COLLINI L. Analysis of crack propagation resistance of Al-Al203 particulate-reinforced composite friction stir welded butt joints [J]. Int J Fatigue, 2009, 31: 111-121.
[17] BUTTERS J N, LEENDERTZ J A. Application of coherent light techniques to engineering measurement [J]. Appl Optics, 1972, 11: 1436-1437.
[18] HUNG Y Y. A speckle-shearing interferometer: A tool for measuring derivatives of surface displacements [J]. Opt Commun, 1974, 11: 132-135.
[19] GRYZAGORIDIS J, FINDEIS D, SCHNEIDER D R. The impact of optical NDE methods in vessel fracture protection [J]. Int J Pres Ves & Piping, 1995, 61: 457-469.
[20] HUNG M Y Y, LONG K W, WANG J Q. Measurement of residual stress by phase shift shearography [J]. Opt Lasers Eng, 1997, 27: 61-73.
[21] YANG L, STEINCHEN W, KUPFER G, MACKEL P, VOSSING F. Vibration analysis by means of digital shearography [J]. Opt Lasers Eng, 1998, 30: 199-212.
[22] GROVES R M, JAMES S W, BARNES S E, FU S, FURFARI D, IRVING P E, TATAM R P. Multi-component laser shearography for the investigation of defects in rotating machinery [J]. P Soc Photo��Opt Ins, 2004, 5457: 546-556.
[23] HUNG Y Y, CHEN Y S, NG S P, LIU L, HUANG Y H, LUK B L, IP R W L, WU C M L, CHUNG P S. Review and comparison of shearography and active thermography for nondestructive evaluation [J]. Mater Sci Eng R, 2009, 64: 73-112.
[24] XIE X, XU N, SUN J, WANG Y, YANG L. Simultaneous measurement of deformation and the first derivative with spatial phase-shift digital shearography [J]. Opt Commun, 2013, 286: 277-281.
[25] ERICSSON M, SANDSTROM R. Influence of welding speed on the fatigue of friction stir welds, and comparison with MIG and TIG [J]. Int J Fatigue, 2003, 25: 1379-1387.
[26] JAMES M N, HATTINGH D G, BRADLEY G R. Weld tool travel speed effects on fatigue life of friction stir welds in 5083 aluminium [J]. Int J Fatigue, 2003, 25: 1389-1398.
[27] FRATINI L, PASTA S, REYNOLDS A P. Fatigue crack growth in 2024-T351 friction stir welded joints: Longitudinal residual stress and microstructural effects [J]. Int J Fatigue, 2009, 31: 495-500.
[28] KIM W K, WON S T, GOO B C. A study on mechanical characteristics of the friction stir welded A6005-T5 extrusion [J]. Int J Precis Eng Man, 2010, 11: 931-936.
[29] MA Y E, ZHAO Z Q, LIU B Q, LI W Y. Mechanical properties and fatigue crack growth rates in friction stir welded nugget of 2198-T8 Al-Li alloy joints [J]. Mater Sci Eng A, 2013, 569: 41-47.
[30] CIRELLO A, BUFFA G, FRATINI L, PASTA S. AA6082-T6 friction stir welded joints fatigue resistance: Influence of process parameters [J]. J Eng Manu, 2005, 220: 805-811.
[31] FENG A H, CHEN D L, MA Z Y. Microstructure and low-cycle fatigue of a friction-stir-welded 6061 aluminum alloy [J]. Metall Mater Trans B, 2010, 41: 2626-2641.
[32] SU H, WU C S, PITTNER A, RETHMEIER M. Simultaneous measurement of tool torque, traverse force and axial force in friction stir welding [J]. J Manuf Process, 2013, 15: 495-500.
[33] MISHRA R S, MA Z Y. Friction stir welding and processing [J]. Mater Sci Eng R, 2005, 50(1): 1-78.
[34] ASTM Standard E3-01. Standard guide for preparation of metallographic specimens [S]. ASTM International. West Conshohocken. PA, 2008.
[35] ASTM Standard E384. Standard test method for microindentation hardness of materials [S]. ASTM International. West Conshohocken. PA, 2008.
[36] BALASINGH C, SINGH A K. Residual stresses and their measurements by X-ray diffraction methods [J]. Met Mater and Process, 2000, 12: 269-280.
[37] PREVEY P S. X-ray diffraction residual stress techniques [M]. Ohio: American Society for Metals, 1986: 308-92.
[38] ASTM E399. Standard test method for linear-elastic plane-strain fracture toughness KIC of metallic materials [S]. ASTM International. West Conshohocken, PA, 2013.
[39] ASTM E647. Standard test method for measurement of fatigue crack growth rates [S]. ASTM International. West Conshohocken, PA, 2001.
[40] STEINCHEN W, YANG L. Digital shearography: Theory and application of digital speckle pattern shearing interferometry [M]. Bellingham: SPIE Press, 2003.
[41] BIOUCAS-DIAS J M, VALADAO G. Discontinuity preserving phase unwrapping using graph cuts [J]. Lect Notes Comput Sci, 2005, 3757: 268-284.
[42] GHAHREMANI-MOGHADAM D, GALLEHDARI A, HADIDI- MOUD S. Determination of opening mode stress intensity factor in edge cracked specimen by means of digital shearography [C]//Proceedings of European Conference on Fracture. Kazan, Russia, 2012.
[43] SCHMIDT H, HATTEL J. Modelling heat flow around tool probe in friction stir welding [J]. Sci Technol Weld J, 2005, 10: 176-186.
[44] JOHNSON G R, COOK W H. A constitutive model and data for metals subjected to large strains high strain rates and high temperatures [C]//Proceedings of the 7th International Symposium on Ballistics. Hague, Netherlands, 1983: 541-547.
[45] LESUER D R. Experimental investigations of material models for Ti-6Al-4V titanium and 2024-T3 aluminum [M]. Virginia: Spring, 2000.
[46] AYDIN H, BAYRAM A, UGUZ A, AKAY K S. Tensile properties of friction stir welded joints of 2024 aluminum alloys in different heat-treated-state [J]. J Mater Des, 2009, 30: 2211-2221.
[47] NELSON T W, STEEL R J, ARBEGAST W J. In situ thermal studies and post-weld mechanical properties of friction stir welds in age hardenable aluminium alloys [J]. Sci Technol Weld J, 2003, 8: 283-288.
[48] AL-JARRAH J A, SWALHA S, ABU MANSOUR T, IBRAHIM M, AL-RASHDAN M, AL-QASHI D A. Welding equality and mechanical properties of aluminum alloys joints prepared by friction stir welding [J]. Mater Design, 2014, 56: 929-936.
[49] MOGHADAM D G, FARHANGDOOST K, NEJAD R M. Microstructure and residual stress distributions under the influence of welding speed in friction stir welded 2024 aluminum alloy [J]. Metall Mater Trans B, 2016, 47(3): 2048-2062.
[50] SMITH W F. Structure and properties of engineering materials [M]. 2nd ed. New York: McGraw-Hill Book Company, 1987.
[51] CHARITIDIS C A, DRAGATOGIANNIS D A, KOUMOULOS E P, KARTSONAKIS I A. Residual stress and deformation mechanism of friction stir welded aluminum alloys by nanoindentation [J]. Mater Sci Eng A, 2012, 540: 226-234.
[52] SIVARAJ P, KANAGARAJAN D, BALASUBRAMANIAN V. Fatigue crack growth behaviour of friction stir welded AA7075-T651 aluminium alloy joints [J]. Transactions of Nonferrous Metals Society of China, 2014, 24(8): 2459-2467.
[53] ZHANG Z, XIAO B L, MA Z Y. Effect of welding parameters on microstructure and mechanical properties of friction stir welded 2219Al-T6 joints [J]. Mater Sci, 2012, 47(9): 4075-4086.
[54] JAYARAMAN M, BALASUBRAMANIAN V. Effect of process parameters on tensile strength of friction stir welded cast A356 aluminium alloy joints [J]. Transactions of Nonferrous Metals Society of China, 2013, 23(3): 605-615.
[55] JOHN R, JATA K V, SADANANDA K. Residual stress effects on near-threshold fatigue crack growth in friction stir welds in aerospace alloys [J]. Int J Fatigue, 2003, 25: 939-948.
[56] JAMES M N, HATTINGH D G, HUGHES D J, WEI L W, PATTERSON E A, da QUINTA FONSECA J. Synchrotron diffraction investigation of the distribution and influence of residual stresses in fatigue [J]. Fatigue Fract Engng Mater Struct, 2004, 27: 609-622.
[57] TRA T H, OKAZAKI M, SUZUKI K. Fatigue crack propagation behavior in friction stir welding of AA6063-T5: Roles of residual stress and microstructure [J]. Int J Fatigue, 2012, 43: 23-29.
[58] KIM S, LEE C G, KIM S J. Fatigue crack propagation behavior of friction stir welded 5083-H32 and 6061-T651 aluminum alloys [J]. Mat Sci Eng A, 2008, 478: 56-64.
���Ӳ����Խ���Ħ����2024-T351���Ͻӽ�ͷ�������Ժ�ƣ�������������ʵ�Ӱ��
Danial GHAHREMANI MOGHADAM, Khalil FARHANGDOOST
Department of Mechanical Engineering, Faculty of Engineering, Ferdowsi University of Mashhad 9177948974, Mashhad, Iran
ժ Ҫ���ں����ٶ�Ϊ8~31.5 mm/min�������ٶ�Ϊ400~800 r/min�����¶Ժ��Ϊ8 mm��2024-T351���Ͻ����н���Ħ������ʵ�顣Ϊ�˿��캸����Ʒ�ĸ������ܣ��Ժ�����Ʒ���н��������ά��Ӳ�Ⱥ�XRD(ȷ�Dz���Ӧ��)���ԡ�Ϊ�˵õ���Ʒ�IJ���Ӧ����Ӧ��ǿ������(SIF)������Ʒ�Ľ���Ħ�����ӹ��̽�������Ԫ���������ڱ����Է����о�������Ʒ�Ķ��Ѻ�ƣ����Ϊ��������Ʒ�ں��������ֳ�ʼ�����������غ��ӷ�����չ��ͬʱ���ü���ɢ�߸��淽���Ժ�����Ʒ�Ķ�����Ϊ���н�һ���о�����������������ٶȺͽ����ٶ�Ӱ����Ʒ�Ķ������Ժ�ƣ�������������ʡ�����Ħ����ʹ��Ʒ�������Ѻ��غͶ������Խ�����18%~49%���ϵ͵ĺ����ٶ�ʹ���ӽ�ͷ�Ķ��������������͡��ڽϸߵĺ����ٶȻ�ϵ͵Ľ����ٶ��£����ӽ�ͷȱ�ݵ����ӿɵ��½ϵ͵Ķ������ԡ��ڽϵ�Ӧ��ǿ�����Ӳ�ֵ(��K��13 MPa��m1/2)�����£����к�����Ʒ��ƣ��������չ���ʱ������Ͻ��ƣ��������չ�����������ڽϸߵĦ�Kֵ�����£�������Ʒ��ƣ��������չ���ʱȻ���Ͻ��ƣ��������չ���ʿ�öࡣ
�ؼ��ʣ����Ͻ𣻽���Ħ�������������ԣ�����ɢ�߸��淨��ƣ��������չ����
(Edited by Wei-ping CHEN)
Corresponding author: Khalil FARHANGDOOST; E-mail: farhang@um.ac.ir
DOI: 10.1016/S1003-6326(16)64383-2
Abstract: Friction stir welding (FSW) was performed on 2024-T351 aluminum alloy plates. Metallographic analysis, Vickers microhardness and XRD tests were conducted to determine the properties of the welded zone. FE simulation of the FSW process was implemented for the different welding conditions to extract the residual stress and stress intensity factor (SIF). Fracture and fatigue behaviors of the welds which have the initial crack in the nugget zone and the crack orientation along the welding direction, were studied based on standard test methods. Fracture behavior of the welds was also evaluated by shearography method. The results showed that the tool rotational and traverse speeds affect the fracture toughness and fatigue crack growth rate. FSW provides 18%-49% reductions in maximum fracture load and fracture toughness. A slight diminution in fracture toughness of the joints was observed for lower traverse speed of the tool, and at higher traverse or rotational speeds, increasing the probability of defects may contribute to low fracture toughness. Fatigue crack propagation rate of all welds was slower than that of the base metal for low values of stress intensity factor range ��K (��K<13 MPa��m1/2), but is much faster for high values of ��K.
