
Trans. Nonferrous Met. Soc. China 25(2015) 1657-1676
Isothermal thermo-analytical study and decomposition kinetics of non-activated and mechanically activated indium tin oxide (ITO) scrap powders treated by alkaline solution

Department for Dynamics and Matter Structure, Faculty of Physical Chemistry, University of Belgrade, Belgrade 11001, Serbia
Received 18 June 2014; accepted 16 February 2015
Abstract:
Isothermal decomposition process of chemically transforming indium tin oxide (ITO) powders into indium (III) hydroxide powders was investigated. Two types of powders were analyzed, i.e., non-activated and mechanically activated. It has been found that in the case of activated sample, shorter induction periods appear, which permits growth of smaller crystals, while in the case of non-activated sample, long induction periods appear, characterized by the growth of larger crystals. DAEM approach has shown that decomposition processes of non-activated and mechanically activated samples can be described by contracting volume model with a linear combination of two different density distribution functions of apparent activation energies (Ea), and with first-order model, with a single symmetrical density distribution function of Ea, respectively. It was established that specific characteristics of particles not only affect the mechanism of decomposition processes, but also have the significant impact on thermodynamic properties.
Key words:
indium tin oxide; mechanical activation; chemical preparation; grain boundaries; thermal properties; decomposition kinetics;
1 Introduction
Indium tin oxide (ITO) is a mixed indium and tin oxide whose composition may vary depending on its application, but typically consists of 80%-90% indium oxide with the remainder corresponding to tin (IV) oxide. This material shows very good conductivity (the ITO is an advanced semi-conducting material) and transmission performance allied to excellent stability, reproducibility and morphology. It has optical and electronic applications in devices such as solar cells, gas sensors, organic electroluminescent devices, functional glasses, ther mal mirrors and solid electrolyte cells. In thin film form, it possesses high electrical conductivity and transparency in the visible region, combined with low electrical resistance [1-3]. Many investigations and development studies on ITO were mainly focused on synthesis and properties of its films and powders.
ITO films are generally fabricated by DC magnetron sputtering using ITO ceramic target. Magnetron sputtering is favored because it is easily applied to large area with good uniformity. However, ITO targets should be replaced before a large portion of ITO material (60%-70%) has been used because of race track formation [4-6]. So, it might be said that the recycling of unused ITO target is indispensable as indium is a trace element and very expensive. As shown in In1.82Sn0.18O3 obtained by doping indium oxide with approximately 10% of tin oxide, tin is the major impurity in recovery process of indium metal from ITO target-scrap. In addition to unused ITO target, various impurity metals including Al, Mo, Fe, Ni, and Cr are contaminated in the collection process of ITO scrap. Many investigators have designed various methods to recover the pure indium metal from ITO scrap. MASLII et al [7] have designed the electrolytic method to recover indium from concentrated sulfate solutions. Another method concerned neutralization of solutions containing tin to pH=1 followed by cementation with indium [8] or by treating with NaOH to a pH value of 2.8 [9]. The new developed method to remove tin and purify indium metal from ITO target-scrap has been reported using ozonization [10].
Based on previous experience [11,12], in this work, the alkaline solution procedure to remove tin from ITO scrap was used. Furthermore, since the hydrothermal treatment in alkaline solution decomposed directly In2-xSnxO3 compound into In(OH)3 and Na2SnO3 without using strong acid, it might shorten the commercial process of indium recovery.
The main goal of this work was detailed examination of isothermal kinetics and disclosure of complete mechanistic scheme of the decomposition process of transforming coarse ITO target-scrap powders into fine indium (III) hydroxide powders. In this work, the kinetic analysis was conducted on the two series of thermo-analytical measurements which were as follows: the first series included the transformed powders that were not subjected to any additional external effects, and in the second series of measurements, resulting powders were subjected to the mechanical activation (MA).
Mechanical activation (MA) may increase the internal energy and reaction activity due to the formation of lattice distortion, defect in crystal lattice, and amorphization in the solid material via the mechanical force by high-energy milling [13-15]. The other important goal of this work was to investigate the influence of mechanical activation on the decomposition kinetics of powders which were subjected to thermal treatment, and also to determine whether this effect influences the change of the reaction mechanism of the process and the thermodynamic properties.
2 Experimental
2.1 Materials and methods
ITO target-scrap was obtained from the Uctend Co., Ltd., (Shanghai, China). The displayed sample was crushed and then pulverized. 120 g powder sample was mixed with 100 mL 50% NaOH solution in a round-shaped alumina crucible, and then heated in air at 500 ��C for 5 h. The sodium hydroxide treated powder was washed with distilled water until the residual solution pH value of 7, and then filtered and dried at 150 ��C in a dry-oven. The resulting powder was transferred to a vial for powder samples.
2.2 Mechanical activation analysis
The mechanical activation in this work was achieved with a customized stirring mill driven by a commercial available drill press equipped with a variable speed motor. In milling experiments, 6 mm mill balls were housed inside a stainless 1200 mL steel chamber whose temperature was maintained at constant level, under the inert atmosphere (atmospheric pressure) of N2, and no other additives were used during the milling. About 100 g powder samples were subjected to dry milling during a specified time interval. The mill was stopped and the balls were removed after the designated time (after 30 min of milling). The mechanically activated powders were sieved through a sieve with pore size of 149 ��m, which were loosely packed in cylindrical vials, where they were further used for thermo-analytical studies.
2.3 Isothermal thermo-analytical measurements
The isothermal thermo-analytical (TA) studies of non-activated and mechanically activated powders were performed using SDT 2960 simultaneous DTA (differential thermal analysis)-TG (thermogravimetry) analyzer (TA Instruments, 159 Lukens Drive, New Castle (UK), DE 19720), at four different operating temperatures (in low temperature measuring modes) of Ti=333.15, 343.15, 353.15 and 363.15 K (i = 1, 2, 3 and 4) wherein the experiments were performed at the heating rate (used to achieve the desired operating temperature) ��=150 K/min, as the heat-ramping rate. All the isothermal experiments were carried out in the atmosphere of the flowing nitrogen (flowing rate ��=50 mL/min), with the sample placed in an open platinum crucible. Prior to sample filling in the platinum crucible, the crucible mass is calibrated to zero. Then, crucible was filled with the powder sample and its initial mass was recorded. Isothermal TG runs were repeated until the consistent of the experimental data was identified.
Kinetic rate data for the thermal decomposition processes were collected from performed TA measurements of non-activated (the first series of measurements) and mechanically activated (the second series of measurements) under the same experimental conditions, where in each case about 10 mg powder sample was used. Isothermal mass-loss traces were recorded at different constant operating temperatures in the T range, which did not exceed 373.15 K.
3 Theoretical backgrounds (DAEM approach)
Kinetic analysis of decomposition process is traditionally expected to produce an adequate kinetic description of the process in terms of the reaction model and the Arrhenius parameters using a single-step kinetic equation [16]:
 (1)
(1)
where d��/dt is the rate of process, t is the time, T is operating temperature, �� is the conversion fraction or the extent of reaction (�� is usually calculated by using the relationship in the form: ��=(m0-mt)/(m0-mf), where m0 is the initial mass of the sample measured in TA experiments, mt is the mass of the sample at time t, and mf is the final mass of the sample, measured at the end of considered TA run), k(T) is temperature-dependent rate constant, and f(��) is the analytical form of the function of the reaction model. Temperature dependence of the rate constant is introduced by replacing k(T) with Arrhenius equation in the form: k(T)=Aexp[-Ea/(RT)], where A is the apparent pre-exponential factor, Ea is the apparent activation energy, and R is the mole gas constant.
In this work, various integral and differential kinetic methods were applied for the calculation of the kinetic (Arrhenius) parameters and for determination of the reaction mechanism function. Some of these methods used in the current study are summarized in Table 1.
BURNHAM and BRAUN [26] have discussed the problems of characterizing the range of reactivity inherent in complex materials such as polymers, minerals, fossil fuels, and biochemical materials. For such systems, the distributed reactivity caused by the complexity of the reaction can be modeled by a set of concurrent reactions, each with its characteristic pre-exponential factor and Ea. One extreme case of the model would be that the relationship between all the values of A and Ea does not exist. Simplifying assumptions include: 1) a compensation type of relationship with ln A being a linear function of Ea; 2) a single common value of A and a continuous distribution Ea, and 3) a single common value of Ea and a continuous distribution of the pre-exponential factors.
Let �� j (j=1, 2, 3, ��, N) be the conversion fraction of the jth ��pseudo-reaction�� of the complex decomposition process of starting material, and let ��j(t, Ea) denotes the solution of a first-order kinetic equation (first-order approximation) at a given Ea value, in the form of
 (9)
(9)
where d��j(t,Ea)/dt represents the overall rate of the current process, Aj is the pre-exponential factor of the jth ��pseudo-reaction��, and To represents the isothermal operating temperature.
Table 1 Differential and integral methods used in current work for isothermal decomposition processes of non-activated and mechanically activated indium tin oxide (ITO) scrap powder samples
The reactivity differences of various reactions involved in the complex process of decomposition can be described by appropriate selection of one or more types of the density distribution functions, designated by fj(Ea). The function fj(Ea) does not have to belong to the same type of distribution functions, for example, the Gaussian-type of distributions. The overall conversion fraction ��(t) can be obtained by integration procedure as
 (10)
(10)
where in the above exposed equation, a condition of standardizing the density distribution function was taken into consideration [27]. However, if functions fj(Ea) drastically differ in their external properties (for example, the functions are asymmetric or symmetric), and the number of degree of freedom, in this case, there may be a vigorous energy effect of the current functions, which give rise to their linear combination, so that Eq. (10) is modified to the form:
 (11)
(11)
where ��j is the relative abundance of the jth ��pseudo- reaction�� as a proportion of total ��reactions population�� and must satisfy the following constraints: 0 �ܦ�j ��1 and ��j��j=1. Taking into account all proposed equations, we can make predictions of entire decomposition process, through kinetic behaviors of main ��pseudo-reactions�� stemming from a complex heterogeneous process of initial tested material.
The experimental density distribution function Ea can be deduced from the functional dependence of ��=��(Ea), which can be extracted from isoconversional approach. The experimental f(Ea) (designated by f(Ea)exp) can be represented in the following relationship that characterizes the investigated material [28]:
 (12)
(12)
4 Results and discussion
4.1 Experimental integral and differential (rate) conversion curves for non-activated and mechanically activated ITO target-scrap precursor powders subjected to isothermal thermal activation
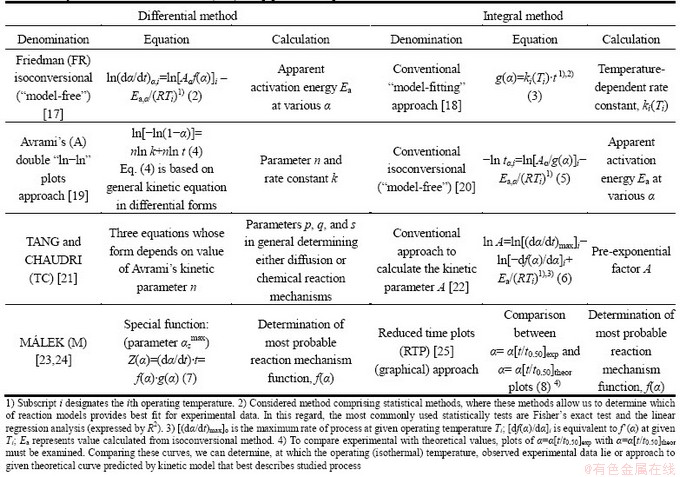
Figures 1 and 2 show experimentally obtained integral conversion curves of non-activated and mechanically activated (during 30 min) indium tin oxide target-scrap powders treated by alkaline solution at different operating temperatures (333.15, 343.15, 353.15 and 363.15 K), respectively.
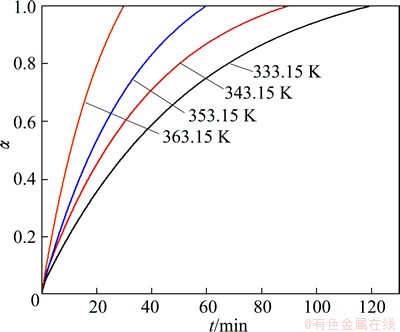
Fig. 1 Experimentally obtained integral conversion curves of non-activated indium tin oxide target-scrap powders, treated by alkaline solution at different operating temperatures
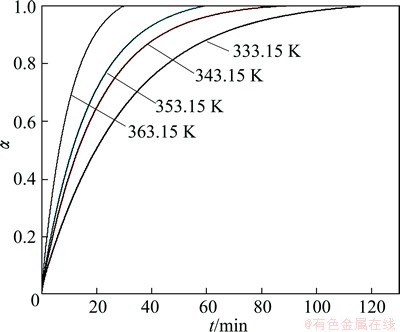
Fig. 2 Experimentally obtained integral conversion curves of mechanically activated (during 30 min) indium tin oxide target-scrap powders, treated by alkaline solution at different operating temperatures
In the case of both samples, based on the external appearance of the conversion curves (Figs. 1 and 2) at all the operating temperatures, we can see that all curves are characterized by the deceleratory behavior. It should be noted that, kinetic models can be classified based on the graphical shape of their isothermal conversion (��-t) curves, or on their mechanistic assumptions. Based on their shape, kinetic models can be grouped into acceleratory, deceleratory, linear, or sigmoidal models. With respect to the decelaratory nature of the conversion curves presented in Figs. 1 and 2, we can conclude that in both investigated cases, the kinetics of decomposition processes can probably be described by the following sets of reaction models: the order-based (F) kinetic models, the diffusion (D) kinetic models, and the geometrical contraction (R) models. All these models belong to the group of deceleratory models, without identifying the presence of an induction period on the conversion curves (Figs. 1 and 2). This identification of the kinetic model, which can describe the studied decomposition processes, represents only a preliminary inquiry, which is based roughly on detecting external/geometric shape of conversion curves, and cannot be a reliable approach in determining the overall kinetics of the current processes.
However, we can notice that, the conversion curves for non-activated and mechanically activated samples at all operation temperatures differ significantly in their slopes, where the conversion curves for the activated samples show a higher slope with an increase of the operating temperature (comparing Figs. 1 and 2). On the other hand, for both samples, with increasing operating temperature, the decomposition time is significantly reduced, so at the highest temperature, the 100% of conversion is achieved in about 0.5 h. Such a shift of conversion curves with an increase in operating temperature greatly indicates that the processes which take place within samples, are carried out as thermally activated processes, so that the amplitude of the shifts affects diffusion effects, where as the temperature plays a significant role. In this regard, the temperature increases the activity of a diffusing species.
In addition, based on the external shape of the differential curves (d��/dt-t), as well as the certain characteristics related to the mentioned curves, we can make a preliminary selection of the appropriate category of the kinetic models, based on which we can expect that the mechanism of decomposition takes place, for all tested samples.
Figure 3 shows the isothermal conversion rate curves in differential form as d��/dt in a function of time (t), for both the non-activated and mechanically activated (during 30 min) indium tin oxide target-scrap powders treated by alkaline solution at different operating temperatures (333.15, 343.15, 353.15 and 363.15 K).
Fig. 3 Isothermal conversion rate curves in differential forms as d��/dt in function of time (t), for non-activated and mechanically activated (during 30 min) indium tin oxide target-scrap powders treated by alkaline solution at different operating temperatures
All rate curves are presented as the stack plots graph.
From the rate curves presented in Fig. 3, in the case of both samples, we have that (d��/dt) = (d��/dt)max at t=0, which is typical for the deceleratory group of kinetic models. Typical representatives of this models group are diffusion (D) and order-based (F) kinetic models (thereby excluding geometrical contraction (R) models). However, the above considerations should be taken as preliminary, because for reliable determination of the ��kinetic triplet��, it requires a more sophisticated kinetic analysis.
4.2 Isoconversional analysis
The apparent activation energy (Ea) values corresponding to different and constant values of conversion fraction (��), for isothermal decomposition process of non-activated and mechanically activated (30 min) indium tin oxide target-scrap powders treated by alkaline solution are shown in Figs. 4 and 5, respectively. Dependencies Ea=Ea(��) calculated by both (integral and differential) isoconversional methods are provided in all of the above figures, for the purpose of a visual comparison. It can be pointed out that if Ea values are independent of ��, the decomposition process is dominated by a single reaction step [29]; on contrary, significant variation of Ea with �� should be interpreted in terms of multi-step mechanism [30]. If Ea values are roughly constant, it is likely that a process is dominated by a single reaction step and can be described by a single-step kinetic model.
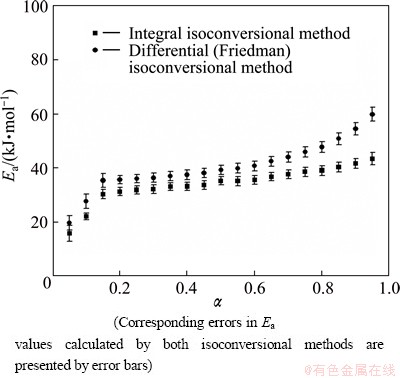
Fig. 4 Dependence of apparent activation energy (Ea) on conversion fraction (��) for isothermal decomposition process of non-activated powder sample, estimated by integral and Friedman isoconversional methods
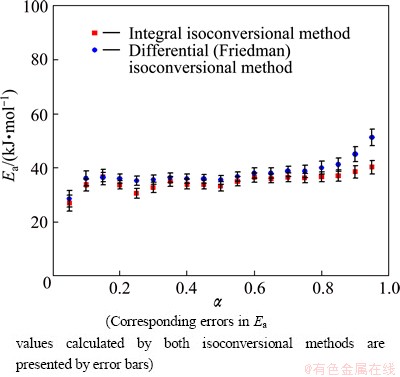
Fig. 5 Dependence of apparent activation energy (Ea) on conversion fraction (��) for isothermal decomposition process of mechanically activated powder sample, estimated by integral and Friedman isoconversional methods
In the case of both studied systems, we can see that, during the decomposition processes, the Ea (taking into account both the applied isoconversional methods) shows the variation with progression in the conversion fraction (��) (Figs. 4 and 5).
For non-activated system (Fig. 4), in the case of both applied isoconversional methods, Ea increases at the beginning of the process (from 15.8 to 30.3 kJ/mol, see integral ��model-free�� method), in the conversion fraction range of 0.05 �� �� �� 0.15. After the conversion fraction value of ��=0.15, we can see that Ea shows no significant variation with �� until ����0.80 (Fig. 4). After ��=0.80, we have a slight increase in the Ea value, which is slightly more pronounced in the case of the use of Friedman method.
In the range of conversion fraction from ��=0.15 up to ��=0.80, for the non-activated sample, we can consider that the decomposition process occurs at the approximately constant Ea value, and the process probably proceeds through the single-step reaction mechanism, where the following values of Ea were calculated: EaIntegral=(34.6��1.6) kJ/mol and EaFriedman= (39.8��1.8) kJ/mol, and wherein the difference between these values is equal to ��Eanon-activated=5.2 kJ/mol. Due to different derivation routes which arise from integral and differential (Friedman) isoconversional methods, the difference between the calculated values of Ea is quite acceptable. It should be mentioned that the appearance of the above difference in Ea values calculated by the integral and differential (Friedman) isoconversional methods may arise from the origins of the mathematical relations which ground the current isoconversional approaches [31]. The results obtained by Friedman method employing the point values of the overall rate of process, unlike the integral isoconversional method, did not include the history of the investigated system, within 0-�� range during the integration procedure.
On the other hand, in the case of mechanically activated system (Fig. 5), we can observe a slightly different shape in Ea=Ea(��) dependence, wherein we cannot identify an enormous difference in the amplitudes of variation of the Ea values, as compared with the amplitudes of variation in the values of Ea for the non-activated sample (Fig. 4). However, in the current case, the Ea increases from 26.8 kJ/mol up to approximately 33.6 kJ/mol at the beginning of the process (see the integral ��model-free�� method), in a relatively narrow conversion fraction range as ����=0.05-0.10. Nevertheless, after the conversion fraction of ��=0.10, we may with certainty assume that the value of Ea is almost constant until ��=0.85, wherein after the last mentioned conversion value, there is an increase in Ea, which is particularly evident in the case of the Friedman isoconversional method (Fig. 5). In the conversion fraction range of 0.10�ܦ���0.85, the following values of Ea were calculated: EaIntegral= (34.7��1.8) kJ/mol and EaFriedman=(37.1��2.0) kJ/mol, and wherein the difference between these values is equal to ��Eaactivated= 2.4 kJ/mol. Also, we can see that the difference between the calculated values of Ea is more than that acceptable for this type of kinetic analysis. Comparing the calculated values of Ea for non-activated and activated reaction systems, we can see that the integral isoconversional method gives almost identical values for Ea, while the Friedman method gives a slightly higher value of Ea in the case of non-activated system (39.8 kJ/mol) than the value of Ea in the case of the activated system (37.1 kJ/mol).
It should be noted that in the case of the process that takes place in the solid state, which is carried out in a fairly wide �� region and may also be described with the single-step reaction mechanism, the Friedman method is then taken as a much more reliable method compared with integral isoconversional method. So, in the following kinetic analysis, we rely only on the values of Ea, which were calculated by the above-mentioned differential isoconversional method.
In the case of both dependencies Ea=Ea(��) (Figs. 4 and 5), a certain increase in the Ea values can be attributed to the occurrence of the nucleation process, that is characterized by an induction period, tind. However, the increase in the value of Ea at low ��, takes place at different bandwidth values of the conversion fraction (for non-activated sample in range of 0.05�ܦ���0.15, whereas for mechanically activated sample in range of 0.05�ܦ���0.10, respectively (Figs. 4 and 5). However, it should be noted that, the duration of the induction period (tind) in conversion curves (Figs. 1 and 2) cannot be detected, so in this case, tind is impossible to be clearly detected. Assuming kinetic phenomena in the induction period as the constant rate nucleation and/or formation of nucleus forming sites on the surfaces, the rate behavior can be expressed by the first-order equation [32], such as (d��n/dt)=kn(1-��n), where ��n and kn are the fraction of nucleus saturation on the overall surfaces and the rate constant of surface nucleation, respectively. Because the reciprocal value of time interval of the induction period (tind) corresponds to the average value of nucleation rate (d��n/dt)Avr and the nucleation rate attains the average value at a constant ��n irrespective of the reaction operating temperature applied, the tind is related to kn by the following expression [33]:
 (13)
(13)
where  represents the corresponding nucleation rate constant. For the studied systems, induction period (tind) was determined according to the conversion (kinetic) curves, where the x axis (time) is re-scaled into the logarithmic time axis, lg t.
An example of this is given in Fig. 6 for the non-activated and the activated samples, at two operating temperatures (333.15 and 343.15 K), whereby a similar shape of the curves was obtained and the other operating temperatures, where exactly the same procedure for the determination of tind was applied. The tind was determined in the intersection point of the tangents that are drawn on the initial and the linear parts of the curves in Fig. 6.
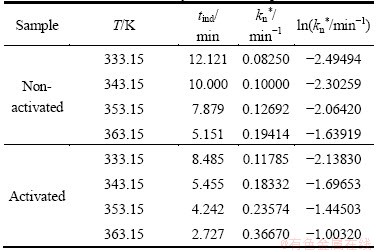
Table 2 lists the values of tind, reciprocal tind (tind-1��kn*) and ln kn* at different operating temperatures, for non-activated and mechanically activated samples.
From Table 2, we can see that in both cases, with an increase of operating temperature, there is a decrease in the value of induction period (tind). On the other hand, we can observe that, in the case of non-activated sample, tind values are larger than those in the case of activated sample, at all operating temperatures.
Furthermore, we can see that the rate of nucleation process increases with the increase of operating temperature, and reaches its highest value at the maximum of temperature (363.15 K), and this can be detected for both studied samples.
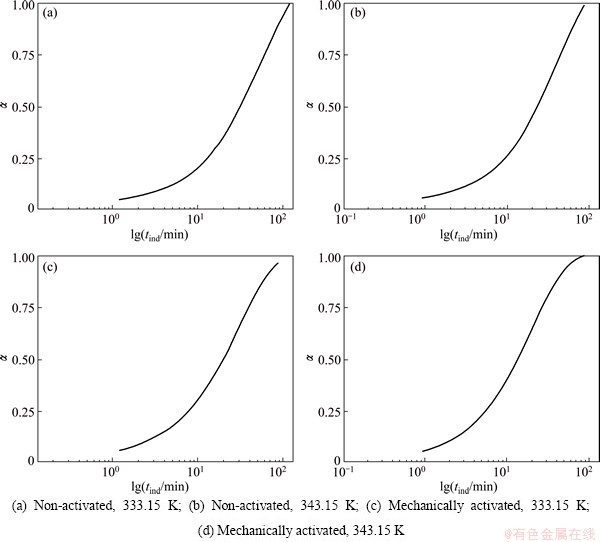
Fig. 6 Method for determining induction period (tind) for isothermal decomposition processes of non-activated and mechanically activated powder samples
Table 2 Values of tind, reciprocal tind (tind-1��kn*, nucleation rate constant) and ln kn* at different operating temperatures for non-activated and mechanically activated samples
From the Arrhenius plots such as ln kn*= ln An*-  /(RT), in the limited operating temperature range of 333.15-363.15 K, the apparent kinetic parameters (An* and ) of nucleation process for both considered samples, can be calculated from direct dependence of ln kn* against T -1. All the plots were demonstrated to be good linearity with the Adj. R-square higher than in 0.99000. From these plots, the following values of the apparent kinetic parameters for nucleation processes were obtained: An*=1.965��103 min-1 (apparent pre-exponential factor for non-activated sample) and =(28.1��0.5) kJ/mol (apparent activation energy for non-activated sample); An*=6.915��104 min-1 (the apparent pre-exponential factor for activated sample) and =(36.8��0.4) kJ/mol (the apparent activation energy for activated sample). It is interesting to note that the apparent activation energy for the nucleation stage of growth of new phase in the case of an activated sample is higher than that of Ea for the same process in the case of non-activated sample. Namely, during rather short time and high-energy milling of precursor powder (after chemical treatment and prior to thermal heating), the effect of a mechanical force on the surfaces of randomly distributed crushed powder may lead to a short-term ��tacking�� of the outer ��flats�� of the powder particles, that can be kept as a micro ��aggregates�� according to the received energy, which can be interpreted through the activation degree of powder. The size of these micro ��aggregates�� just depends on the above-mentioned activation degree of powder. Also, the internal microstructure of precursor powder can affect the ��aggregate�� size. The activation degree of powder can significantly affect the initial particle sizes of obtained powder of In(OH)3 in the general case. When the resulting powder, which has undergone the mechanical activation, was subjected to thermal treatment at the selected operating temperatures, the thermal activation may lead to the formation of independent active nucleation sites, which are formed by the gradual separation of micro ��aggregates��, wherein the total number of the particles of critical size depends on the critical free energy of nucleus formation ��G*, which depends on the operating temperature. At small sizes the free energy increases with the growth of the particle because of the effect of surface area.
In the case of activated powder sample, we can expect the formation of sufficiently small particles of the product phase. Namely, the formation of small crystallites is governed by two competing factors: the free energy gained upon transferring constituent particles from the metastable phase to the more stable solid phase, and the free energy needed to create the surface area of the crystallite. The first above-mentioned reaction phase greatly contributes to certain increase in value for the mechanically activated powder sample, compared with the value of for the non-activated powder sample. Furthermore, it should be noted that with further reduction in crystallite size, however, the volume of product which is formed likely as a consequence of each relatively difficult nucleation step is restricted to the volume of the particle nucleated. When crystallite dimensions are sufficiently small, the rate of reaction is controlled by nucleation in assemblage of identical reactant fragments. This phenomenon could occur when a large number of small crystallites exist [34]. This effect can be directly reflected in the behavior of induction period (tind). So, we can expect that shorter induction periods (activated powder sample in Table 2) just permit the growth of smaller crystals and that cation/anion molar ratio of the lattice probably does not affect the size of the formed crystals [35]. Of course, in the case of the non-activated powder sample, we will have the opposite effect (viz the appearance of long induction periods allowing the growth of larger crystals in Table 2).
In addition, from Figs. 4 and 5, we can see that after approximately 15% of conversion in the case of both studied systems, curves of Ea=Ea(��) indicate nearly constant values of Ea during the process with 39.8 kJ/mol (Fig. 4) and 37.1 kJ/mol (Fig. 5) (from the Friedman plots) averaged over 0.15�ܦ���0.80 and 0.10�ܦ���0.85 ranges, respectively. Namely, after approximately 85% of conversions, we can identify a specific increase in Ea values (Figs. 4 and 5). The regions of increasing Ea correspond to the backward part in the isothermal rate data and the part of increasing effects of the operating temperatures in the rate data, when we consider the rate data of constant transformation rate mode. From a simple physico-geometric consideration of the reaction mechanism, such ��regressive�� behavior is expected by the decrease in the active reaction interface. Namely, this decrease in the active reaction interface could be possibly the consequence of the increase of surface pressure up to a certain value, where the partial pressure of water vapor (the evolution of H2O during In(OH)3 decomposition) may have a significant role. This effect is much more pronounced in the case of non-activated than in the case of activated powder sample, as can be seen based on the slightly higher values of Ea at the end of the process in the first mentioned case (Figs. 4 and 5).
4.3 Function of reaction mechanisms
In order to determine the kinetic model that best describes studied processes under isothermal experimental conditions, as well as the calculation of the single pair of the kinetic parameters attached to a specific reaction mechanism, the model-fitting approach based on Eq. (3) in Table 1 was applied. In the case of non-activated powder, it is found that the decomposition process at all operating temperatures can be described by several equivalent statistical models, such as power law (P4), phase-boundary (R2 and R3), the first order (F1, Mampel), Avrami-Erofeyev (A3/2) and diffusion (D1, 1D diffusion) kinetic models. On the other hand, in the case of mechanically activated powder, it is also found that the decomposition process at all operating temperatures can be described by several equivalent statistical models, such as phase-boundary (R3), the first order (F1, Mampel), Avrami-Erofeyev (A3/2) and diffusion (D1 and D2, 1D and 2D diffusions, respectively) kinetic models. In addition, in both considered cases, from the analysis of results, the calculated kinetic parameters (ln A and Ea) show rather mild variable when changing the kinetic model (these results are not shown here). It is found that in the case of non-activated powder, Ea value attached to F1 model is proximately the value of Ea calculated by Friedman method (39.8 kJ/mol). Furthermore, for mechanically activated powder, it is found that the value of Ea calculated by F3 and A3 models (the results are not shown here) coincides with the value of Ea calculated by Friedman��s method (37.1 kJ/mol).
However, we cannot take these models randomly into further consideration, since we cannot be sure that they belong to a group of closely kinetic models that could successfully describe the mechanisms of decomposition processes, due to fact that detailed statistical analysis shows that the above-mentioned models are not fully reliable and therefore cannot be unambiguously taken for further kinetic studies. An important problem that arises from this approach is based on the following fact: any statistical characteristics rank the kinetic models by the goodness of data fit, but not by physical sense of applying these models to the experimental data, which means that even if a kinetic model does not have any physical meaning at all, it may perfectly fit the data. It should be mentioned that the prime objective of the kinetic analysis is to obtain the physically sound kinetic information. Therefore, for this type of kinetic analysis, the statistical procedures cannot be used as an ultimate tool for determining the most reliable reaction model.
Normalized Z(��) functions (Eq. (7) in Table 1) calculated for both non-activated and mechanically activated powder samples are shown in Fig. 7.
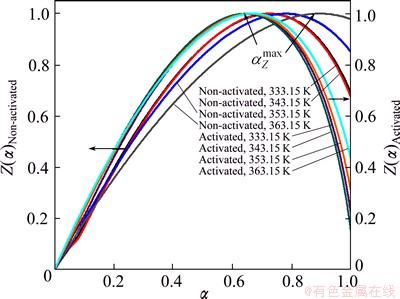
Fig. 7 Normalized Z(��) functions (Table 1) calculated for decomposition processes of non-activated and mechanically activated powder samples at different operating temperatures
In the case of non-activated powder sample, the shapes of Z(��) function curves (Fig. 7) are practically variant with respect to operating temperature. On the other hand, in the case of mechanically activated powder sample (Fig. 7), the variability of the shape of Z(��) function with a change in the operating temperature is not so pronounced as compared with the previous case. This means that the observed change of operating temperature has a much smaller effect on the shape of the reaction mechanism function in the case of the mechanically activated powder.
Table 3 lists the values of ��zmax for Z(��) functions (Table 1) in the cases of the isothermal decomposition process of non-activated and the mechanically activated powder samples, respectively.
Table 3 Values of ��Zmax for Z(��) functions (Eq. (7) in Table 1) for isothermal decomposition process of non-activated and mechanically activated powder samples at different operating temperatures
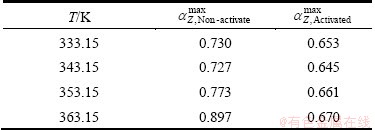
From Table 3 we can see that the maxima of Z(��) functions for non-activated powder sample fall into the range of 0.727�ܦ�Zmax��0.897, while for mechanically activated powder sample those fall into the range of 0.645�ܦ�Zmax ��0.670. From these values of ��Zmax, we may conclude that the most suitable kinetic model which can best describe the decomposition process of non-activated powder sample under isothermal conditions, belongs to the group of the kinetic models, which are referred to as phase-boundary models (the contracting area or the contracting volume) [23]. In addition, based on ��Zmax values presented in Table 3, we can conclude that the most suitable kinetic model which can best describe the decomposition process of mechanically activated powder sample under isothermal conditions, belongs to the group of the kinetic models, which are referred to as reaction order (RO) models (these are most likely kinetic models F1 or F3/2) [23].
However, this approach has enabled us to narrow the choice of kinetic models, in order to determine the precise reaction model that can realistically describe the given processes. So, we need to perform the further kinetic analysis.
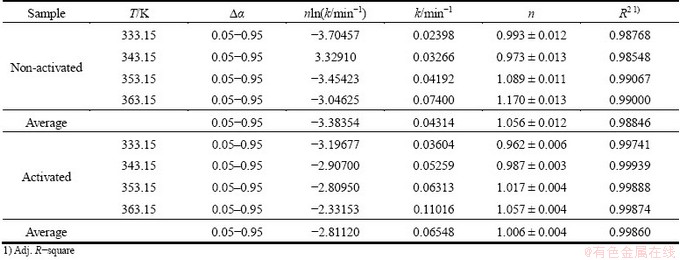
In the following, we can apply the method of Avrami��s (A) ln-ln plots (Eq. (4), Table 1) for the purpose of extracting the kinetic parameters, n and k, for both investigated systems.
Table 4 shows the values of the rate constant k and the kinetic parameter n (slope) as well as the values of nln k (intercept, Table 1) for both non-activated and mechanically activated powder samples subjected to the isothermal decomposition processes at different operating temperatures (333.15, 343.15, 353.15 and 363.15 K) in the conversion range of 0.05�ܡ�����0.95.
Based on the results shown in Table 4, we can clearly see that the decomposition process of the non-activated powder sample can be best described with the three-dimensional boundary progresses as the contracting volume (R3) kinetic model [25]. On the other hand, in the case of decomposition process of the mechanically activated powder sample, we can conclude that the process can be best described with the first order (Mampel) kinetic model [25]. The obtained results clearly show that the decomposition processes related to the non-activated and mechanically activated powder samples proceed through different reaction mechanisms. Furthermore, using the values of the rate constants (k) presented in Table 4, based on the Arrhenius plots in the form of ln k against 1/T, the values of the kinetic parameters (A and Ea) were calculated. The following values of the kinetic parameters were obtained: Ea=(36.3��0.7) kJ/mol and A=1.138��104 min-1 (for non-activated sample); Ea=(35.4��0.6) kJ/mol and A=1.271��104 min-1 (for mechanically activated sample). We can see that the calculated values of Ea are in good agreement with those of Ea obtained from the application of isoconversional methods in the case of both studied systems.
The results obtained using Eq. (4) in Table 1 are tested using the Tang and Chaudri method. For the kinetic equations of geometrical contraction model (precisely the contracting volume (R3) model) and the order-based (F) model (precisely the first order (Mampel, F1) model) indicated by the previous method to control the investigated decomposition processes, the Adj. R-square (R2), is an indicator of the equation most likely to represent the decomposition process. The closer it to unity is, the more suitable the equation is.
The resulted values of ��, and the corresponding values of slope (s, Table 1) and intercept (lg k), together with values of k and R2, calculated from linear dependence of lg(d��/dt) vs lg(1-��) (not shown) for both investigated decomposition processes are shown in Table 5.
Table 4 Values of rate constant k and kinetic parameter n (slope) as well as values of nln k (intercept) (Eq. (4) in Table 1) for both non-activated and mechanically activated powder samples subjected to isothermal decomposition processes at different operating temperatures in conversion range of 0.05 �� ���� �� 0.95
For the decomposition process of non-activated powder sample, we can see that at all operating temperatures, the value of slope s is greater than 0.500 (the average value of s is equal to 0.672 in Table 5), which represents a ��threshold�� for the selection of the R2 model, within the geometrical contraction models [21]. Therefore, this method confirms that the best kinetic model which realistically describes the decomposition process of non-activated powder sample is precisely the R3 model. On the other hand, the results for the decomposition process of the mechanically activated powder sample show that the value of slope s at all operating temperatures, is very close to 1.000 (average value of s is equal to 0.923 in Table 5). This result confirms that the decomposition process of the mechanically activated powder sample can be described with first order (Mampel) reaction model.
All above presented results were verified using the reduced time plots (RTP) as �� vs t/t0.50 (Eq. (8) in Table 1), and for both considered decomposition processes, these plots are shown in Figs. 8 and 9.
From Figs. 8 and 9, it is clear that the experimental data (symbols) related to the decomposition processes of non-activated and mechanically activated powder samples lie or are around the theoretical reduced time plots (the full color lines) for the reaction models R3 and F1 at all the considered operating temperatures, respectively. These results indicate that the reaction models R3 and F1 represent realistic kinetic models, which, together with the calculated kinetic parameters, make a complete mechanistic scheme of studied decomposition processes for the observed powder patterns.
In the kinetic study of thermal decomposition of solid samples, the determination of the appropriate mechanistic function (f(��) or g(��)) is one of the most important subjects in the solid-state kinetics. A proper selection of the formal expression of this function gives the linear dependence between ln A and Ea. This relation is referred to as kinetic compensation effect (KCE) [36,37]. The following mathematical formula is generally used to describe the KCE:
ln A=a*+b*Ea (14)
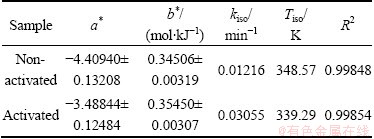
where a* and b* are kinetic compensation constants. Constant a* is equal to a*=ln kiso, where kiso represents the isokinetic rate constant, while constant b* is equal to b*=1/(RTiso), where Tiso represents the isokinetic temperature. Table 6 lists the values of a*, b*, kiso and Tiso, which were calculated from the linear dependence of ln A vs Ea, evaluated from Friedman method, where the values of ln A were derived from the established kinetic models R3 and F1, for the non-activated and mechanically activated powder samples, respectively.
From Table 6, it can be seen that both the investigated decomposition processes possess the KCE with large values of R2. The kinetic compensation constants (a* and b*) obtained by the selected isoconversional method are almost the same (Table 6), which implies that the above evaluated mechanistic functions, and A and Ea achieved are reasonable and reliable. The above results confirm that the kinetic parameters of the considered decomposition processes are correlated with each other. Any change of the apparent activation energy is compensated by the change in the form of ln A. This true compensation effect is confirmed by the calculated values of the isokinetic temperature, Tiso. Namely, from Table 6, we can see that both values of the isokinetic temperature (348.57 and 339.29 K) lie within the experimental range of the operating temperatures (333.15-363.15 K).
Table 5 Values of ��1 (conversion fraction expressed through number of data points) and corresponding values of slope s and intercept (lg k) (Table 1, TC method), together with values of k (rate constant) and R2 (Adj. R-square) calculated from linear dependence of lg(d��/dt) vs lg(1-��) for isothermal decomposition processes of non-activated and mechanically activated powder samples
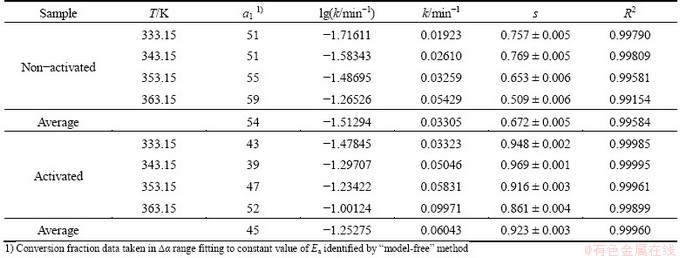
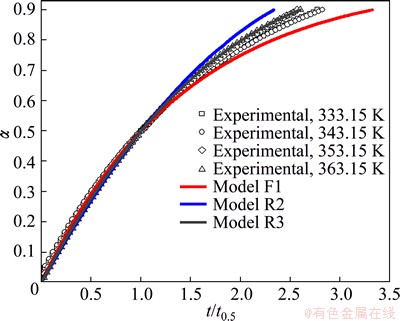
Fig. 8 Reduced time plots (RTP) as �� vs t/t0.50 (Eq. (8) in Table 1) for isothermal decomposition process of non-activated powder sample, expressed through comparison procedure of experimentally obtained and theoretically calculated RTP��s for selected set of kinetic models
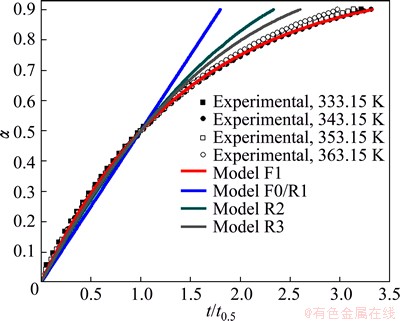
Fig. 9 Reduced time plots (RTP) as �� vs t/t0.50 (Eq. (8) in Table 1) for isothermal decomposition process of mechanically activated powder sample, expressed through comparison procedure of experimentally obtained and theoretically calculated RTP��s for selected set of kinetic models
Table 6 Values of a*, b*, kiso and Tiso calculated from kinetic compensation effect (KCE) (ln A vs Ea) evaluated from Friedman method for both isothermal decomposition processes of non-activated and mechanically activated powder samples
calculated from the KCE based on the established kinetic models R3 and F1 for both considered reaction systems and the ln A values calculated by Eq. (6) in Table 1. In
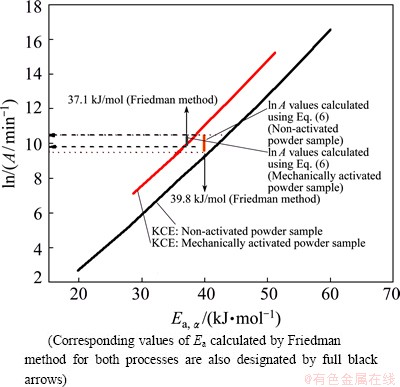
Fig. 10 Comparison of ln A values calculated from KCE based on established kinetic models R3 and F1(A1) for isothermal decomposition processes of non-activated and mechanically activated powder samples, and ln A values calculated by Eq. (6) in Table 1
Figure 10 shows a comparison of ln A values the latter case, Ea values obtained from Friedman method were used. It can be seen from Fig. 10 that the values of ln A for both considered systems, which are calculated by using Eq. (6) lie in a fairly narrow range (the horizontal dashed and dotted arrows in Fig. 10), and by the magnitude orders (expressed through the pre-exponential factor (A/104)) are in very good agreement with ln A (i.e., with A), which were evaluated from the current kinetic models. It can be pointed out that the obtained low values (with respect to order of magnitude) of the pre-exponential factor often indicate a surface reaction, but if the reactions are not dependent on the surface area, the low pre-exponential factor may indicate a existence of ��tight�� complex. Since in many cases the concentrations in the solid are not controllable, it will be convenient if the magnitude of the pre-exponential factor gives an indication of the molecularity.
From these ln A-Ea profiles for a given set of the experimental data, it is clear that the above-determined specific kinetic models represent the most suitable mechanisms of the investigated decomposition processes.
4.4 DAEM analyses
Based on the preceding analysis, we have mentioned the important fact that the first order behavior (F1) is closely similar to the contracting volume kinetic equations (Models R2 and R3), except in the final stages of the process when �� approaches 1.00. This similarity can be seen from a very similar shape of Ea=Ea(��) curves, for decomposition processes of non-activated and activated powder samples (Figs. 4 and 5), respectively. However, since in these dependencies there are no complete consistencies Ea in the whole range of conversion values, but only in strictly defined bands of ��, we can conclude that the conversion dependence of the apparent activation energy like a Friedman-type reaction profile approach can directly imply the occurrence of Ea distribution, i.e., the distributed reactivity. These distributions of the Ea values, with respect to the derivative Ea-�� dependency, which are similar but not identical, may differ in both width and shape.
Figure 11 shows the comparison between the experimentally derived density distribution functions Ea (using differential d��(Ea)/dEa procedure, Eq. (12)), f(Ea)exp, for decomposition processes of non-activated and mechanically activated powder samples.
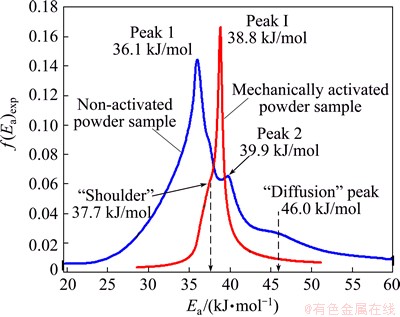
Fig. 11 Comparison between experimentally derived density distribution function Ea (using differential d��(Ea)/dEa procedure and f(Ea)exp for decomposition processes of non-activated and mechanically activated powder samples, respectively
In the case of non-activated powder sample, the obtained f(Ea)exp represents fairly wide distribution Ea, with two major peaks (designated as Peaks 1 and 2 with maximum values at 36.1 and 39.9 kJ/mol respectively in Fig. 11) and one ��diffusion�� peak on the right tail of distribution, with the maximum at 46.0 kJ/mol. It can be pointed out that in the case of the non-activated powder sample, the left tail of the current distribution function corresponds to the initial stage of the process, which can be attached to the increasing behavior Ea up to approximately ��=0.20 (Fig. 4). The appearance of the first peak (Peak 1), including the visible second peak (Peak 2, the lower peak by the intensity) in the current distribution, corresponds to the stage of process (based on the isoconversional results) at constant Ea (Fig. 4), even though on the derived distributions we can see that there are still some variations in Ea, which cannot be observed from Ea=Ea(��) dependence with this threshold of detection. The advent of ��diffusion maximum�� (designated by ��diffusion�� peak at 46.0 kJ/mol, see Fig. 11) on the right tail of actual distribution, corresponds exactly to �� value (��=0.75), wherein a gradual increase in Ea values appears (Fig. 4).
On the other hand, the distribution function f(Ea)exp ascribed to the mechanically activated powder sample, is much narrower and is characterized by a sharp peak (designated by Peak I, with the maximum at 38.8 kJ/mol), with an increased likelihood (in respect to f(Ea)exp values (y-axis in Fig. 11)), in relation to the visible features in the case of the prior distribution. It should be noted that the main peak (Peak I) arises from the ��shoulder��, which appears on the left tail of the current distribution, with characteristic value of Ea equal to 37.7 kJ/mol. The position of ��shoulder�� (together with entire left tail until the occurrence of Peak I) corresponds to the progression of the process, until the subsequent conversion values reach the value of ��=0.65 (even including the initial and later stages of the decomposition process, see Fig. 5). In contrast to the perceived characteristics with the previous distribution, the appearance of the main and sharp peak (Peak I) after 38.8 kJ/mol, corresponds to a later stage of decomposition process, where there is an increase in the value of Ea beyond ��=0.80 (Fig. 5).
It is obvious that the experimental density distribution functions of Ea differ in their general characteristics, especially in their widths and shapes, so no matter what these distribution profiles represent the similar reaction mechanisms, we think that obvious differences are the result of specific geometric characteristics of the particles of the final products, while the particle size plays a crucial role in the general mechanistic interpretation of studied processes. Namely, in the second case, for decomposition of the mechanically activated powder samples, we can expect that we will get a fine powder of In2O3 as the final decomposition product (from the precursor powders), while the particle nucleation occurs on a random basis and the growth does not advance beyond the individual crystallite nucleated. This nucleation-growth scheme can be described with the first order kinetics, which truly corresponds to the Avrami-Erofeyev model labeled as A1 (Model A1 is identical with model F1). The actual reaction profile really corresponds to the shape of density distribution function shown in Fig. 11 for mechanically activated powder samples.
This very narrow distribution (compared with the distribution of the non-activated sample, which is quite wide) with rather sharp and the pronounced peak, is the characteristic of the crystallization process of fine powders of nano-dimensions. It should be noted that we cannot say that in the first case, we will not get the final nano-sized powder, but the powder is probably ��small in nano-sizes��, with regard to the numerical values. Such a conclusion would probably suit up to the phase transition from one to the other geometric forms.
For each of the studied process, several types of continuous density distribution functions were tested, in order to search which of these functions best fits the experimental density distribution function of Ea (Fig. 11). The following types of density distribution functions were tested: Gauss (normal), Gauss modified, log-normal, inverse polynomial peak (IPP), extreme (Ex), Laplace (L), logistic, Lorentz, Pearson VII peak, Voigt (V), pseudo-Voigt type 1 and pseudo-Voigt type 2 distributions.
Using the distribution fitting software EasyFit [38], from the selected group of continuous distributions (12 distribution functions), it was found that in the case of decomposition process of non-activated powder samples, Gauss modified (designated by f1(Ea)) and Laplace (designated by f2(Ea)) distributions best describe the observed experimentally derived distribution Ea for the current process. The graphical representation of this fitting procedure is shown in Fig. 12.
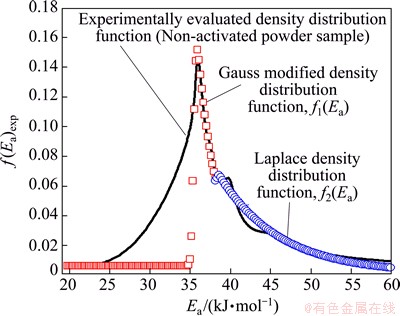
Fig. 12 Graphical representation of numerical fitting procedure of experimentally obtained density distribution function of Ea with selected continuous probability functions of Gauss modified (designated by f1(Ea)) and Laplace (designated by f2(Ea)) distributions for isothermal decomposition process of non-activated powder sample
The first function f1(Ea) describes the distribution of Ea, which includes the left tail of f(Ea)exp function, together with the first (main) peak, until the appearance of the second peak in the experimental distribution function (Fig. 12). On the other hand, the second function f2(Ea) describes the second peak (Peak 2), which further comprises the ��diffusion�� peak on the right tail of the experimental distribution function, f(Ea)exp (Fig. 12). However, the function f1(Ea) somewhat poorer can fit the left tail of the experimental density distribution of Ea, but very well fits the shape of the first (main) peak and part of the right tail of f(Ea)exp until the advent of the second, smaller peak by intensity. In addition, the function f2(Ea) fits quite well Peak 2 and other ��diffusion�� peak, counting at the same time, the good fitting of the entire right tail of f(Ea)exp function (Fig. 12).
In the case of decomposition process of non-activated powder sample, we can see that the mixture probability model (f(Ea)theor=f1(Ea)+f2(Ea)) adequately fits the distribution of f(Ea)exp, which represents the linear combination of two distribution functions. Based on the results shown in Fig. 12, the first component function in the mixture (f1(Ea)) is not too flexible in relation to another component function in the mixture (f2(Ea)). Specifically, it should be noted that function f1(Ea) attached to the Gauss modified distribution describes very well the maximum of the experimentally obtained function, f(Ea)exp, where this part of the actual function represents the reaction stage, wherein Ea is taken to have a constant value. The total (theoretical) distribution function f(Ea)theor is described by synergistic effect of two component density functions (f1(Ea) and f2(Ea)), which is not the case in decomposition process of the mechanically activated powder sample.
The graphical representation of the above mentioned fitting procedure for the decomposition process of the mechanically activated powder sample is shown in Fig. 13.
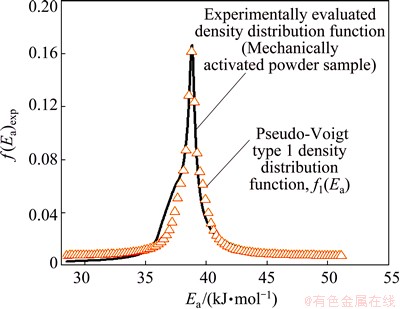
Fig. 13 Graphical representation of numerical fitting procedure of experimentally obtained density distribution function of Ea, with selected continuous probability function such as Pseudo-Voigt type 1 (designated by f1(Ea)) distribution for isothermal decomposition process of mechanically activated powder sample
It is found that in the case of decomposition process of the mechanically activated powder sample, pseudo-Voigt type 1 distribution best describes experimentally derived distribution of Ea, while the comparison between these functions is shown in Fig. 13. We can see that function f1(Ea) (f1(Ea) represents the ��single�� function without any combination scheme with other functions (Fig. 13)) fits the experimentally derived density distribution function of Ea very well. A little deviation in the area of experimental function can be noticed, in which a ��shoulder�� occurs at the value of 37.7 kJ/mol.
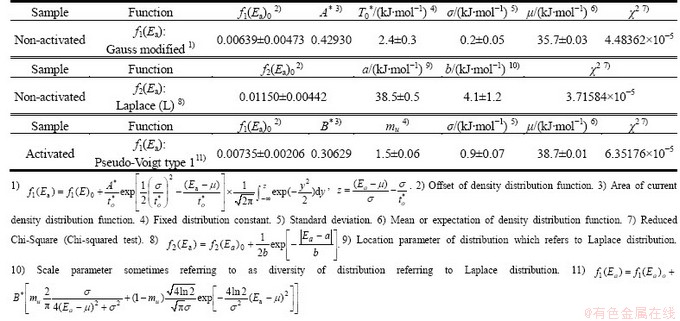
Table 7 shows corresponding probability density functions (f1(Ea) and f2(Ea)) and the values of the distribution parameters in order to describe the experimentally evaluated density distribution functions of Ea, for the decomposition processes of non-activated and mechanically activated powder samples, respectively.
From Table 7, we can see that the mean value (��) of f1(Ea) attached to Gauss modified density function (35.7 kJ/mol) is very close to the maximum value of the first peak (Peak 1) (36.1 kJ/mol) in the experimentally derived density distribution function. However, low value in the resulting dispersion (��=0.2 kJ/mol), is in fact an ��artificial�� value, in the reference studied case. In addition, the location parameter (a) of f2(Ea) attached to the Laplace (L) density function (a=38.5 kJ/mol, Table 7) is also very close to the maximum value of the second peak (Peak 2) (39.9 kJ/mol) in f(Ea)exp function. It can be observed for the mechanically activated sample that the mean value (��) of f1(Ea) attached to the pseudo-Voigt type 1 density function (38.7 kJ/mol) (Table 7) is nearly identical to the value of the maximum for main peak (Peak I, 38.8 kJ/mol) in the experimentally derived density distribution function. On the other hand, unlike non-activated sample, the obtained value of dispersion (��=0.9 kJ/mol) is a non-artificial value.
Based on the above-presented results, it can be clearly seen that all theoretically derived density distribution functions, in a safe manner and with high reliability, can describe the distribution of reactivity for both investigated decomposition processes.
The question now is how all of these functions are associated with the investigated crystallization processes? Namely, the geometrical contraction model R3 is attached to the solid particles with a spherical/ cubical shapes, i.e., contracting sphere/cube (contracting volume) model assumes that the nucleation occurs rapidly on the surface of the crystal system, where the rate of decomposition is controlled by the resulting reaction interface progress toward the center of the crystal. In the case of decomposition process of non-activated sample, the nucleation reaction step probably occurs with modified ��boundary layers�� between two phases, while the rapid onset of nucleation may be followed by ��dehydration�� of starting material into the water vapor. Sites of locally enhanced reactivity at which nucleation occurs, are probably changed in asymmetrically spatial manner, while this change does not take place at an even pace, and can lead to specific structural modifications. These events may lead to a transformation of the distribution density function of Ea from the symmetric function (such as Gauss distribution) into asymmetric function, whose representative is just received as a modified Gaussian density distribution, which is shown in Fig. 12. However, since the first nuclei may require significant enhanced local reactivity, the first stage in their development may involve changes within the reactant phase to generate an incipient nucleus. Proceeding from this precursor to the germ nucleus may require an investment of the energy. Thereafter, the interface of the growth nucleus appears in advance by preferred chemical change at the reactant-product contact. The relative ease of nucleation plays an important rote in the kinetics of the overall process. When the nucleation step occurs infrequently (sometimes ascribed to a larger apparent activation energy, as the increased Ea at the initial stage in Fig. 4), it may lead to the formation of the asymmetric probability density function (Fig. 12).
Table 7 Probability density functions f1(Ea) and f2(Ea) and values of distribution parameters to describe experimentally evaluated density distribution functions of Ea for decomposition processes of non-activated and mechanically activated powder samples
In the later stages of the process, the growth of a new phase, in an important sense can affect the changes in the distributions of sizes and shapes of the crystals which comprise the reactant.
This is clearly due to the variations in the geometry of surface production of nuclei and the subsequent interface advance in particles of different dimensions. It can be expected that there is an appropriate range of the obtained particle sizes. The occurrence of the type of distribution, such as Laplace density distribution (Fig. 12), is a consequence of the difference between two independent identically distributed exponential random variables, such as the rate of the growth process, probably evaluated at exponentially distributed random time values needed for the growth of a new phase [39].
In the case of decomposition process of the mechanically activated powder, the current process can be described with distributed reactivity, which is characterized by the symmetric pseudo-Voigt type 1 density distribution function of Ea (Fig. 13). This reactivity may include the possibility of three-dimensional growth of product with a small particles, where there is effectively a single nucleus generated on each crystallite. It should be mentioned that, when crystallite dimensions are sufficiently small, the rate of the process is controlled by nucleation of identical reactant fragments, and the first order kinetics is valid. This reaction treatment can be considered the special case of the Avrami-Erofeyev kinetic model (A1, Mampel law). Such kinetic behavior can be accompanied by a symmetrical density distribution of Ea, with strongly developed tails of distribution, especially with a tail that characterizes the final stage of decomposition process (Fig. 13).
For the purpose of kinetic modeling of the decomposition process of non-activated powder samples at different operating temperatures, Eqs. (9)-(11) can be modified and transformed into mathematical form that corresponds to the geometrical contraction volume model (R3), and we have an expression for the conversion fraction in the form:

 (15)
(15)
where ��1 and ��2 respectively represent the relative abundance of the first and the second reaction stages, which can be attributed to the appropriate statistical descriptions with probability distributions (f1(Ea) and f2(Ea)), which are shown in Fig. 12; A represents the numerically evaluated constant of the pre-exponential factor (A=1.140��104 min-1), Ea,�� represents the isoconversional obtained effective activation energy, and Ti is the ith value of operating temperature.
In the case of decomposition process of the mechanically activated powder samples, kinetic modeling is based on Eqs. (9)-(11), which are based on the first-order kinetic model. So, the expression for the conversion fraction takes the following form:
 (16)
(16)
where f1(Ea) represents the probability distribution, which is shown in Fig. 13, A is the numerically evaluated constant of the pre-exponential factor (A=1.271��104 min-1).
Figure 14 shows the comparison of experimental and numerically calculated conversion curves using Eqs. (15) and (16), with corresponding density distribution curves that are previously derived.
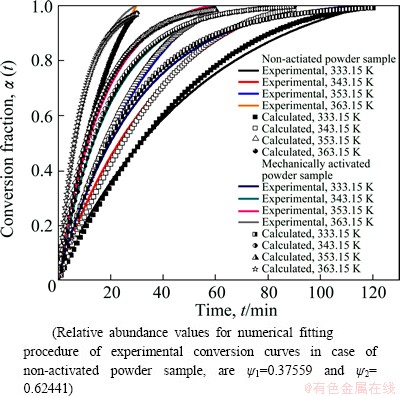
Fig. 14 Comparison of experimental and numerically calculated conversion curves using Eqs. (15) and (16), with corresponding density distribution curves, which are presented in Figs. 12 and 13, for isothermal decomposition processes of non-activated and mechanically activated powder samples, respectively
From Fig. 14, we can see that there is a very good agreement between experimental and calculated conversion curves at all operating temperatures for the investigated decomposition processes. Based on the obtained results, it can be concluded that modeling of studied processes can be successfully implemented using Eqs. (15) and (16) which inherently contain the corresponding distribution functions and thus, together with evaluated kinetic models, make the distributed reactivity of a given system in general completed.
Important difference between obtained reaction models is reflected in the case of isothermal decomposition of the mechanically activated powder sample. We deal with Mampel model A1/F1, which describes a random nucleation process on the surface of the crystal grains and the isotropic growth of the nuclei. The nuclei are assumed to appear on the surface of grains and to grow inward. The rate limiting step takes place at the internal interface (between the starting phase and the growing new phase) and the expansion coefficient is equal to unity [40]. In this case, the nucleation can be assumed to be a space-time Poisson process, with a mean frequency of nucleation [41,42], which is usually expressed as a number of nuclei per unit of time and per unit of surface area [41]. In addition, if the decomposition process follows the first-order kinetic model (A1/F1), then the rate-determining step is obviously the nucleation process, and there is an equal probability of nucleation at each active site.
In the case of decomposition process of non-activated powder sample, the contracting volume kinetic model (R3) indicates the decomposition on an ideal surface of a reactant particle, which is not hindered by diffusion, proceeds uniformly towards its centre [43]. In these types of reactions, it can be assumed that the nucleation step occurs instantaneously, so that the surface of each particle is covered with a layer of the product [44].
As a general statement, we can conclude from all above established results that the short time milling on the thermal behavior of ITO powders has an effect on the kinetics of decomposition process, depending on the circumstances of the heat treatment (such as the operating temperature range which was used and the magnitude of the partial pressures) and probably from the properties of the formed product particles.
4.5 Thermodynamic properties
The entropy and enthalpy changes (��S�� and ��H��) of the current decomposition process were calculated using the following equation [45]:
 (17)
(17)
where k is the rate constant, T is the operating temperature, R is the mole gas constant, N is Avogdro number and h is Plank constant. Plotting ln(k/T) against 1/T, the slope and intercept give the values of ��H�� and ��S��, respectively. For the purpose of a given calculation, the values of the rate constant (k) are used for each of the observed decomposition process, which are listed in Table 4.
The change of Gibbs free energy (��G��) was calculated from well-known thermodynamic relationship, which connects ��H�� and ��S�� functions, and is represented in the form [45]:
 (18)
(18)
where TAvr represents the average value of the operating temperature.
Table 8 lists the changes of the thermodynamic functions (��H��, ��S�� and ��G��) for the isothermal decomposition processes of the non-activated and the mechanically activated powder samples, calculated using Eqs. (17) and (18).
Table 8 Changes of thermodynamic functions (��H��, ��S�� and ��G��) for isothermal decomposition processes of non-activated and mechanically activated powder samples
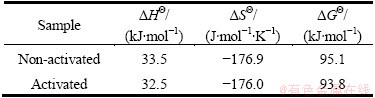
From the results in Table 8, we can see that in both studied decomposition processes, the values of ��H�� are in good agreement with the calculated values of Ea obtained by applying the Arrhenius plots (ln k vs 1/T) (Ea=36.3 kJ/mol for non-activated sample and Ea=35.4 kJ/mol for the mechanically activated sample). The lower values of enthalpy change (33.5 and 32.5 kJ/mol (Table 8)) may be indication for existence of a certain ��steric hindrance�� within crystal lattice caused by Bulkier re-arrangements of ions. This might cause the disclosure of the reactant to have low reactivity so that the time required to form the activated complex may be ��too long��. In this case, the decline in Ea is in proportion to the decline in ��H��, which is clearly seen in the case of the mechanically activated powder sample (Table 8). In the case of non-activated sample, on the principle of minimum displacement of lattice components, we can conclude that it is possible to deduce the probable ionic movements which occur during interface advance in 3D directions [46].
Therefore, it is possible to expect a slightly higher value of the apparent activation energy (and also somewhat higher value of ��H��) in the case of non-activated powder sample compared with the mechanically activated powder sample (Table 8). For mechanically activated powder sample, we can expect the significant lattice strain effect, so in the lower range of the operating temperatures, the initiation of process requires a short induction period (Table 2) followed by a brief acceleratory process, indicative of a nucleation and growth mechanism. However, the release of water vapor in final stoichiometry as In2O3+3H2O affects the entire mechanism of the process, wherein water releasing is generally deceleratory. So, overall kinetics can be described by the first-order kinetic equation, where the previous reaction step supports endothermic effect of entire process [32].
The values of ��S�� for both samples are all negative, indicating that the corresponding activated complex has a higher degree of arrangement (the lower entropy) than that in the initial state. Comparing the calculated values of ��S�� for the investigated reaction systems reveal that ��S�� for the mechanically activated sample is lower than that for the non-activated sample. This somewhat lower value of ��S�� for mechanically activated sample confirms that its activated complex in decomposition process possesses a higher degree of arrangement (more entropy) than initial state of solid reactant. However, this trend is reversed for non-activated sample. Based on activated complex theory, the higher value of ��S�� for non-activated sample makes its thermal decomposition slow, while mechanically activated sample decomposes quickly. This fact is fully confirmed by the above presented discussion. Meanwhile, the positive values of thermodynamic functions, ��H�� and ��G��, for the both systems, show that they are dependent on the heat introduced and possess the non-spontaneous decomposition reactions.
5 Conclusions
The isothermal kinetics of the decomposition process of chemically transformed ITO target-scrap powders into the indium (III) hydroxide powders was studied. Two types of powders were investigated, i.e., the non-activated and the mechanically activated powder samples. Both powder samples were subjected to the thermal heating regimes under the static (isothermal) conditions at four different operating temperatures (T= 333.15, 343.15, 353.15 and 363.15 K). The specific ��model-fitting�� and isoconversional (��model-free��) kinetic methods, together with DAEM approach were applied in order to determine the values of the kinetic parameters (the pre-exponential factor (A) and the apparent activation energy (Ea)) and detection of the real mechanistic scheme of both considered processes. It was found that in the conversion fraction range of 0.15�ܦ���0.80 for non-activated powder sample, the decomposition process occurs at the constant value of Ea, where as the process probably proceeds through the single-step reaction mechanism, where the following value of Ea was obtained: Ea=39.8 kJ/mol. On the other hand, for mechanically activated powder sample, it was found that in the conversion fraction range of 0.10�ܦ���0.85, the value of Ea is almost constant and amounts Ea=37.1 kJ/mol. It is found that in the case of activated powder sample, the shorter induction periods appear which permits the growth of smaller crystals, while in the case of non-activated powder sample, the long induction periods appear, characterized by the growth of large crystals. It was concluded that using the DAEM approach, the decomposition processes of non-activated and mechanically activated powder samples can be described with the contracting volume kinetic model R3 with a linear combination of two different density distribution functions of Ea (Gauss modified and Laplace density distributions), and with the first-order kinetic model (A1/F1) with a single symmetrical density distribution function of Ea (Pseudo- Voigt type 1 density distribution), respectively. It was established that the low values of the pre-exponential factors indicate a predominantly surface reactions. Results here can contribute to testing the thermal stability and kinetics of decomposition of untreated and mechanically treated powders, which are directly applicable to the industrial purposes.
Acknowledgments
This research work is partially supported by the Ministry of Science and Environmental Protection of Serbia under the Project 172015.
References
[1] PRAMANIK N C, DAS S, BISWAS P K. The effect of Sn(IV) on transformation of co-precipitated hydrated In(III) and Sn(IV) hydroxides to indium tin oxide (ITO) powder [J]. Materials Letters, 2002, 56: 671-679.
[2] BA J H, ROHLFING D F, FELDHOFF A, BREZESINSKI T, DJERDJ I, WARK M, NIEDERBERGER M. Nonaqueous synthesis of uniform indium tin oxide nanocrystals and their electrical conductivity in dependence of the tin oxide concentration [J]. Chemistry of Materials, 2006, 18: 2848-2854.
[3] HO W H, YEN S K. Preparation and characterization of indium oxide film by electrochemical deposition [J]. Thin Solid Films, 2006, 498(1-2): 80-84.
[4]  C, HERRERO J. Polycrystalline growth and recrystallization processes in sputtered ITO thin films [J]. Thin Solid Films, 2006, 510(1-2): 260-264.
[5] YANG C H, LEE S C, CHEN S C, LIN T C. The effect of annealing treatment on microstructure and properties of indium tin oxides films [J]. Materials Science and Engineering B, 2006, 129(1-3): 154-160.
[6] HU Ya-lan, DIAO Xun-gang, WANG Cong, HAO Wei-chang, WANG Tian-min. Effects of heat treatment on properties of ITO films prepared by rf magnetron sputtering [J]. Vacuum, 2004, 75(2): 183-188.
[7] MASLII A I, BELOBABA A G, VAIS A A. Electrolytic recovery of indium from concentrated sulfate solution [J]. Russian Journal of Applied Chemistry, 1999, 72: 1165-1169.
[8] ALFANTAZI A M, MOSKALYK R R. Processing of indium: A review [J]. Minerals Engineering, 2003, 16: 687-694.
[9] HAN K N, KONDOJU S, PARK K, KANG H M. Recovery of indium from indium/tin oxides scrap by chemical precipitation [J]. Geosystems Engineering, 2002, 5: 93-98.
[10] PARK J C. The removal of tin from ITO-scrap via ozonization [J]. Bulletin of the Korean Chemical Society, 2009, 30: 3141-3142.
[11] SHINDO Y, TAKEMOTO K. Method for collection of valuable metal from ITO scrap: US Patent, US 12/445.639 [P]. 2011-08-23.
[12] HASEGAWA H, RAHMAN I M M, EGAWA Y, SAWAI H, BEGUM Z A, MAKI T, MIZUTANI S. Recovery of indium from end-of-life liquid-crystal display panels using aminopolycarboxylate chelants with the aid of mechanochemical treatment [J]. Microchemical Journal, 2013, 106: 289-294.
[13]  Influence of mechanical activation on selectivity of acid leaching of arsenopyrite [J]. Hydrometallurgy, 2005, 77(1-2): 3-7.
[14] JIN H B, LI J T, CAO M S, AGATHOPOULOS S. Influence of mechanical activation on combustion synthesis of fine silicon carbide (SiC) powder [J]. Powder Technology, 2009, 196(2): 229-232.
[15] FILIMONOV V Y, KORCHAGIN M A, DIETENBERG I A, TYUMENTSEV A N, LYAKHOV N Z. High temperature synthesis of single-phase Ti3Al intermetallic compound in mechanically activated powder mixture [J]. Powder Technology, 2013, 235: 606-613.
[16] VYAZOVKIN S, WIGHT C A. Isothermal and non-isothermal kinetics of thermally stimulated reactions of solids [J]. International Reviews in Physical Chemistry, 1998, 17: 407-433.
[17] FRIEDMAN H L. Kinetics of thermal degradation of char-forming plastics from thermogravimetry: Application to a phenolic plastic [J]. Journal of Polymer Science C, 1964, 6(1): 183-195.
[18] VYAZOVKIN S, WIGHT C A. Model-free and model-fitting approaches to kinetic analysis of isothermal and non-isothermal data [J]. Thermochimica Acta, 1999, 340-341: 53-68.
[19] AVRAMI M. Kinetics of phase change. II: Transformation-time relations for random distribution of nuclei [J]. Journal of Chemical Physics, 1940, 8: 212-224.
[20] BAITALOW F, SCHMIDT H G, WOLF G. Formal kinetic analysis of processes in the solid state [J]. Thermochimica Acta, 1999, 337: 111-120.
[21] TANG T B, CHAUDRI M M. Analysis of isothermal kinetic data from solid state reactions [J]. Journal of Thermal Analysis and Calorimetry, 1979, 17: 359-370.
[22] NAHDI K, LLEWELLYN P,  J, ARIGUIB N K, AYEDI M T. Controlled rate thermal analysis of kaolinite dehydroxylation: Effect of water vapour pressure on the mechanism [J]. Thermochimica Acta, 2002, 390: 123-132.
[23]  J. The kinetic analysis of non-isothermal data [J]. Thermochimica Acta, 1992, 200: 257-269.
[24] SBIRRAZZUOLI N, GIRAULT Y,  L. The M��lek method in the kinetic study of polymerization by differential scanning calorimetry [J]. Thermochimica Acta, 1995, 249: 179-187.
[25] SHARP J H, BRINDLEY G W, NARAHARI ACHAR B N. Numerical data for some commonly used solid state reaction equations [J]. Journal of the American Ceramic Society, 1966, 49: 379-382.
[26] BURNHAM A K, BRAUN R L. Global kinetic analysis of complex materials [J]. Energy and Fuels, 1999, 13: 1-22.
[27] MIURA K. A new and simple method to estimate f(E) and ko(E) in the distributed activation energy model [J]. Energy and Fuels, 1995, 9: 302-307.
[28] SCOTT S A, DENNIS J S, DAVIDSON J F, HAYHURST A N. An algorithm for determining the kinetics of devolatilisation of complex solid fuels from thermogravimetric experiments [J]. Chemical Engineering Science, 2006, 61: 2339-2348.
[29] BOONCHOM B. Kinetics and thermodynamic properties of the thermal decomposition of manganese dihydrogenphosphate dehydrate [J]. Journal of Chemical and Engineering Data, 2008, 53: 1533-1538.
[30] VENKATESH M, RAVI P, TEWARI S P. Isoconversional kinetic analysis of decomposition of nitroimidazoles: Friedman method vs Flynn-Wall-Ozawa method [J]. Journal of the Physical Chemistry A, 2013, 117(40): 10162-10169.
[31] BUDRUGEAC P, SEGAL E. Some methodological problems concerning nonisothermal kinetic analysis of heterogeneous solid-gas reactions [J]. International Journal of Chemical Kinetics, 2001, 33: 564-573.
[32] BROWN M E, DOLLIMORE D, GALWEY A K. Reactions in the solid state [M]//Comprehensive Chemical Kinetics. Amsterdam: Elsevier, 1980: 45-60.
[33] KOGA N, KIMIZU T. Thermal decomposition of indium (III) hydroxide prepared by the microwave-assisted hydrothermal method [J]. Journal of the American Ceramic Society, 2008, 91(12): 4052-4058.
[34] OXTOBY D W. Nucleation of first-order phase transitions [J]. Accounts of Chemical Research, 1998, 31: 91-97.
[35] GILBERT B, ZHANG H Z, HUANG F, FINNEGAN M P, WAYCHUNAS G A, BANFIELD J F. Special phase transformation and crystal growth pathways observed in nanoparticles [J]. Geochemical Transactions, 2003, 4(4): 20-27.
[36] BARRIE P J. The mathematical origins of the kinetic compensation effect. 1: The effect of random experimental errors [J]. Physical Chemistry Chemical Physics, 2012, 14: 318-326.
[37] MEHTA N, KUMAR D, KUMAR A. Investigation of compensation effect for isothermal crystallization in glassy Se80-xTe20Mx(M=Cd, Ge, Sb) alloys [J]. Journal of Physics D: Applied Physics, 2005, 38: 3953-3958.
[38] Easyfit Software. Handbook of tools and fitting options: Mathwave��Data Analysis & Simulation [M]. Dnepropetrovsk: Topal-3, 2014.
[39] ROHRER G S. Influence of interface anisotropy on grain growth and coarsening [J]. Annual Review of Materials Research, 2005, 35: 99-126.
[40] VALDIVIESO F, BOUINEAU V, PIJOLAT M, SOUSTELLE M. Kinetic study of the dehydration of lithium sulphate monohydrate [J]. Solid State Ionics, 1997, 101-103: 1299-1303.
[41] BRUN C, VALDIVIESO F, PIJOLAT M, SOUSTELLE M. Reduction by hydrogen of U3O8 into UO2: Nucleation and growth, influence of hydration [J]. Physical Chemistry Chemical Physics, 1999, 1: 471-477.
[42] HELBERT C, TOUBOUL E, PERRIN S, CARRARO L, PIJOLAT M. Stochastic and deterministic models for nucleation and growth in non-isothermal and/or non-isobaric powder transformations [J]. Chemical Engineering Science, 2004, 59: 1393-1401.
[43] MAITRA S, MUKHERJEE S, SAHA N, PRAMANIK J. Non-isothermal decomposition kinetics of magnesite [J].  , 2007, 53: 284-287.
[44] LI Rui-di, YUAN Tie-chui, FAN Wen-bo, QIU Zi-li, SU Wen-jun, ZHONG Nan-qian. Recovery of indium by acid leaching waste ITO target based on neural network [J]. Transactions of Nonferrous Metals Society of China, 2014, 24(1): 257-262.
[45] PAUNOVIC M, SCHLESINGER M. Fundamentals of electrochemical deposition [M]. 2nd ed. New Jersey: John Wiley & Sons, Inc, 2005.
[46] ZHANG Yun-he, WU Gao-hui. Interface and thermal expansion of carbon fiber reinforced aluminum matrix composites [J]. Transactions of Nonferrous Metals Society of China, 2010, 20(9): 2148-2151.
�ü���Һ�����ķǻ�ͻ�е������������Ϸ�ĩ�ĵ����ȷ����о�����ֽ��ѧ
Department for Dynamics and Matter Structure, Faculty of Physical Chemistry, University of Belgrade, Belgrade 11001, Serbia
ժ Ҫ���о���������ת��Ϊ��������(III)��ĩ�ĵ��·ֽ���̡��Էǻ�ͻ�е������ַ�ĩ��Ʒ���з����������������������н϶̵��յ��ڣ����ڽ�С�����ߴ�ľ������������ǻ�������յ��ڽϳ��������������ڽϴ����ߴ�ľ���������DAEM����������ǻ�ͻ�е������ķֽ���̿ɷֱ��ñ��ۻ��(Ea)���ֲ�ͬ�ܶȷֲ�����������ϵ�����ģ�ͼ����е�һ�Գ��ܶȷֲ�����(Ea)��һ��ģ�ͽ�����������Ʒ���������Բ���Ӱ����ֽ���������Ҷ�������ѧ���ܲ�������Ӱ�졣
�ؼ��ʣ�������������е���ԣ���ѧ�Ʊ������磻�����ܣ��ֽ��ѧ
(Edited by Wei-ping CHEN)
Corresponding author: ; Tel: +381-11-2187-133; Fax: +381-11-2187-133; E-mail: bojanjan@ffh.bg.ac.rs
DOI: 10.1016/S1003-6326(15)63771-2
Abstract: Isothermal decomposition process of chemically transforming indium tin oxide (ITO) powders into indium (III) hydroxide powders was investigated. Two types of powders were analyzed, i.e., non-activated and mechanically activated. It has been found that in the case of activated sample, shorter induction periods appear, which permits growth of smaller crystals, while in the case of non-activated sample, long induction periods appear, characterized by the growth of larger crystals. DAEM approach has shown that decomposition processes of non-activated and mechanically activated samples can be described by contracting volume model with a linear combination of two different density distribution functions of apparent activation energies (Ea), and with first-order model, with a single symmetrical density distribution function of Ea, respectively. It was established that specific characteristics of particles not only affect the mechanism of decomposition processes, but also have the significant impact on thermodynamic properties.
