

J. Cent. South Univ. (2020) 27: 2068-2081
DOI: https://doi.org/10.1007/s11771-020-4431-x

Microstructural insight into permeability and water retention property of compacted binary silty clay
GAO Qian-feng(��Ǭ��)1, 2, SHI Zhen-ning(ʷ����)2, LUO Jin-tao(����)3, LIU Jie(����)4
1. Engineering Laboratory of Spatial Information Technology of Highway Geological Disaster Early Warning in Hunan Province, Changsha University of Science & Technology, Changsha 410114, China;
2. School of Traffic & Transportation Engineering, Changsha University of Science & Technology,Changsha 410114, China;
3. School of Civil Engineering, Changsha University of Science & Technology, Changsha 410114, China;
4. Laboratoire de G��nie Civil et g��o-Environnement, Universit�� de Lille, Universit�� de Lille,Lille 5900, France
 Central South University Press and Springer-Verlag GmbH Germany, part of Springer Nature 2020
Abstract:
The durability of silty clay embankments is partially controlled by the moisture migration, which depends on soil hydraulic properties. This paper presents an experimental study of hydraulic properties of compacted binary silty clay. Specimens with different mixing ratios and dry densities were prepared. Scanning electron microscopy and mercury intrusion porosimetry were used to characterise the microstructure of silty clay. Thereafter, falling-head permeability tests and water retention tests were conducted to study the permeability and water retention property, respectively. The results demonstrate that clay particles are dispersed and show preferred arrangements after compaction when the clay content is 100%. As the clay content decreases, the arrangement of clay particles is gradually disturbed because of the existence of silt particles, causing the formation of large pores around silt particles. When the dry density increases, the pores around silt particles significantly decrease. Moreover, the permeability of silty clay decreases but the water retention capacity increases with increasing clay content and dry density. This is because the silty clay with larger clay content and dry density has fewer large pores, which greatly restrains the flow of water. Both the permeability and water retention property of silty clay can be predicted from pore size distribution parameters.
Key words:
silty clay; microstructure; permeability; water retention property; scanning electron microscopy��
Cite this article as:
GAO Qian-feng, SHI Zhen-ning, LUO Jin-tao, LIU Jie. Microstructural insight into permeability and water retention property of compacted binary silty clay [J]. Journal of Central South University, 2020, 27(7): 2068-2081.
DOI:https://dx.doi.org/https://doi.org/10.1007/s11771-020-4431-x1 Introduction
Technically, silty clay is referred to as the fine-grained soil with a plasticity index between 10 and 17 in accordance with the Chinese standard (JTG C20 2011). It extensively occurs in river basins and coastal regions around the world [1]. Natural silty clay has relatively large compressibility, low strength, high water content and small permeability [2, 3]. However, it may possess desirable engineering performances after careful compaction, so compacted silty clay has been frequently utilized in civil engineering projects for economic considerations [4]. For example, compacted silty clay of low liquid limit is sometimes used to fill highway embankments when silty clay is encountered in large areas [2, 5, 6]. Plenty of engineering experiences have revealed that the moisture field of an embankment varies over time in the natural environment, which would cause the degradation of soil strength and resilient modulus and even instability of the embankment [7-10]. This raises the need to investigate the hydraulic properties of compacted silty clay.
The permeability and water retention capacity are two fundamental hydraulic properties, between which the permeability characterises how easily water is able to get through a soil, while the water retention capacity represents the ability of a soil to keep liquid water [11, 12]. To date, these two hydraulic properties have received much attention. Previous experimental studies have shown sufficient evidence that both the permeability and water retention capacity vary greatly from soil to soil [13-16]. It has also been reported that these two hydraulic properties considerably were affected by external conditions (e.g. pressure, deformation and temperature) [17, 18]. Recently, microscopic techniques such as mercury intrusion porosimetry (MIP), scanning electron microscopy (SEM), and computed tomography have been increasingly utilized to improve the understanding of the macroscopic behavior of soils [19-23]. With these advanced techniques, the influences of soil fabric (e.g. particle arrangement, contact and cementation) and pore structural parameters (i.e. pore size distribution, pore connectivity, porosity, pore channel tortuosity, and pore shape parameters) on hydraulic properties were recognized [15, 16, 24, 25]. On this basis, many empirical and semi-theoretical equations were developed to estimate the water retention property and permeability of granular soils from easy-to- measure parameters.
The above research has contributed to a better understanding of the permeability and water retention capacity of granular soils, while less attention has been paid to compacted silty clay. Furthermore, many existing experimental studies of silty clay used natural clayey soil or industrial clay with a single component [14, 18, 21, 26]. However, the composition and structure of natural clayey soil are too complicated, so it is inconvenient to study the mechanism of its hydraulic behavior. On the other hand, the findings derived from the tests on pure clay have narrow applicability. Therefore, some researchers proposed to study the hydraulic properties of soil using mixtures of multiple known compositions [27, 28]. This simplification enables to better reveal the mechanism behind the phenomena associated with the permeability and water retention property when incorporated with microscopic techniques.
This study aims to investigate the permeability and water retention property as well as the underlying mechanism of compacted silty clay. A series of binary silty clay specimens with different mixing ratios and dry densities were prepared. Then, SEM observations and MIP tests were performed to examine the morphology, void ratio and pore size distribution. Afterwards, falling-head permeability tests and water retention tests were conducted to analyze the permeability and water retention property of silty clay. Finally, both the microscopic and macroscopic data were analyzed. The results would help civil engineers to better design durable highway embankments in areas rich in silty clay.
2 Material properties
Silty clay contains both clay fraction and silt fraction. For simplification, the clay fraction and silt fraction were simulated by a commercial pure kaolin and a fine quartz sand, respectively. The particle sizes of these two soil components were analyzed using a laser granulometer, and the results are shown in Figure 1. Different kaolin contents (i.e. the ratio of kaolin mass to total soil mass=100%, 85%, 75%, 65% and 50%, respectively) were taken into account. The main physical properties of the binary mixtures of different kaolin contents are listed in Table 1. Referring to the international standard (ASTM D2487 2017), M100 was classified as lean clay (CL), while the rest mixtures were classified as silt (ML). In addition, in accordance to the Chinese standard (JTG C20 2011), M100 was classified as clay; M50 was classified as silt; and the remaining mixtures (i.e. M85, M75 and M65) were classified as silty clay. Because the liquid limits of M85, M75 and M65 were less than 50%, they could be termed low-liquid-limit silty clay.
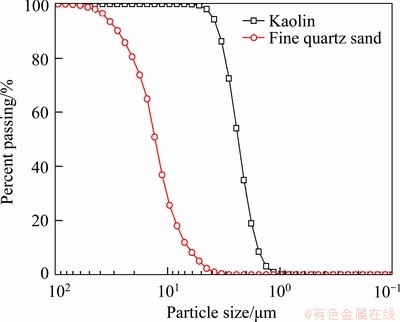
Figure 1 Particle size distribution curves of kaolin and fine quartz sand
3 Experimental program
3.1 Specimen preparation
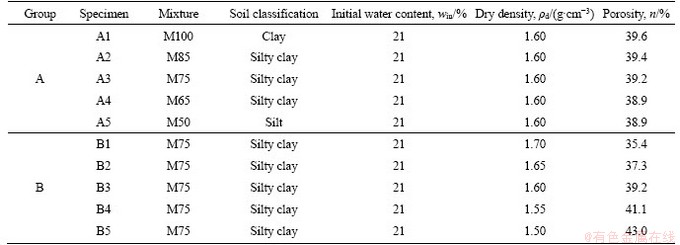
Since the mixing ratio and dry density were two important factors for the behavior of binary silty clay, two groups of specimens were prepared at the optimum water content (i.e. 21%) of M75 silty clay, as given in Table 2. In the first group (i.e. A1-A5), the specimens were prepared at different kaolin contents (i.e. 100%, 85%, 75%, 65% and 50%) and a constant dry density (i.e. 1.60 g/cm3). This dry density enabled the degree of compaction of A3 specimen (i.e. M75 silty clay) to reach 94%, which is a common value for the compaction of highway embankments. For comparison purposes, the kaolin contents of 100% and 50% corresponding to clay (M100) and silt (M50) were taken into account. In the second group (i.e. B1-B5), several M75 silty clay specimens of different dry densities between 1.50 and 1.70 g/cm3 were remoulded. Note that specimens A3 and B3 were actually the same specimen since they had similar test conditions.
The procedure for specimen preparations was as follows: 1) the oven-dried clay (i.e. kaolin) powder and silt (i.e. fine quartz sand) powder were mixed together according to the desired mixing ratio (Table 2); 2) distilled water was mixed with the soil to bring its water content to 21%; 3) the wet soil was stored in an airtight container for over 2 d to reach a good water equilibrium; 4) the cured soil was filled into a cylindrical mould in three layers of approximately equal thickness and then compressed to the desired dry density (Table 2) using the static compaction method; 5) once the compaction procedure was completed, the soil specimen was carefully removed from the mould.
Table 1 Main physical properties of binary mixtures
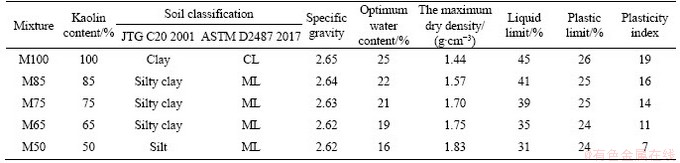
Table 2 Summary of soil specimens used in the tests
3.2 Microscopic test
3.2.1 Preparation of small samples
After the preparation of cylindrical specimens, two cuboids with dimensions of 20 mm��10 mm�� 10 mm were extracted from the core of each specimen with a sharp blade (Figure 2). The longitudinal directions of the cuboids were parallel or perpendicular to the axial direction of the cylindrical specimen. This method for small sample extractions is similar to that presented in GAO et al [26]. The extracted cuboids were then dehydrated using the freeze-drying method (i.e. lyophilization) since both the SEM and MIP techniques need the use of fully dried samples. Small samples were obtained by cutting the cuboids in the middle cross-sections during the freezing phase. This step allowed preserving the soil fabric well when producing fresh planes for SEM observations [21].
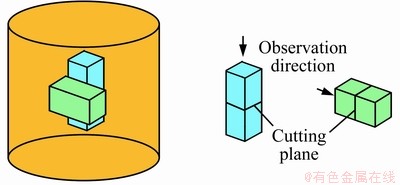
Figure 2 Extraction of small samples for microscopic tests
3.2.2 SEM observation
SEM is a direct method for observing the microstructure of soils from the aggregate scale down to the particle scale or even smaller. Prior to SEM observations, the created fresh planes of small samples were coated with thin layers of gold under vacuum using the 108 auto sputter coater (Cressington Scientific Instruments, UK). Subsequently, the small samples were mounted on a sample holder, fixed with silver glue and then positioned in the electron chamber of the JEOL JSM-6490LV microscope (JEOL, Japan). During the observation, a series of SEM images of different magnifications were randomly taken at various points of the observation plane. Note that for each cylindrical specimen, a horizontal plane and a vertical plane were observed (Figure 2).
3.2.3 MIP test
The MIP technique is a useful approach to characterise the microstructure of porous media. MIP was developed upon the fact that mercury can intrude the pore space of a medium only if the applied pressure is sufficiently high. The cumulative volume (VHg)-pore diameter (D) curve and the differential volume (Vdiff) -pore diameter (D) curve are the basic results of the MIP tests. The shape of a pore size distribution curve (i.e. normalised Vdiff-D curve) can be characterised by probabilistic parameters [16]:
 (1)
(1)
 (2)
(2)
 (3)
(3)
where �� and �� are the expected value and standard deviation of logarithmic pore diameters, respectively; f (lgDi) is the probability function of logarithmic pore diameters; Di is the median diameter of the i-th pore class; N is the pore class number; and De is the expected pore diameter.
Based on the test results, the micro-void ratio of soil is calculated by:
 (4)
(4)
where eMIP is the micro-void ratio; ��s is the mass density of the soil solid.
3.3 Macroscopic test
3.3.1 Permeability test
Falling-head permeability tests were carried out to examine the effects of kaolin content and dry density on the permeability of silty clay. The specimens for permeability tests had a height of 40 mm and a diameter of 61.8 mm. The permeability test involved the migration of water in a specimen that is connected to a standpipe. The latter can provide water head and enable to measure the volume of water flowing through the specimen. Prior to testing, the specimen was fully saturated and de-aired water was injected into the standpipe until a certain high level. Thereafter, the test was started by allowing water to flow through the specimen. It was stopped when the water in the standpipe reached a desired lower level. In the test, the duration of water migration was recorded. Thus, the coefficient of permeability of the specimen could be calculated by (ASTM D5084 2016):
 (5)
(5)
where k is the coefficient of permeability; Sp is the cross-sectional area of the standpipe; L is the specimen height; S is the specimen cross-sectional area; ��t is the water migration duration; Hu is the upper water level; Hl is the lower water level.
3.3.2 Water retention test
The water retention curves of the soil specimens were tested using the pressure plate apparatus (Soilmoisture) on drying paths. The specimens were 61.8 mm in diameter and 20 mm in height. They were first fully saturated via the vacuum saturation method, and then their masses were measured. Afterwards, the specimens were placed into the test chamber at desired matric suctions (i.e. 10-1500 kPa). During the test, the flow of water from the specimens into burettes was monitored. When the equilibrium was reached, the specimens were removed from the pressure plate apparatus. Thereafter, they were quickly weighed and then placed back into the pressure plate apparatus at a higher matric suction. The variation of water contents during the test was deduced from burette readings. After the test, the specimens were weighed before and after oven-drying, so the final water content was determined. It should be noted that all water contents mentioned in this paper refers to the gravimetric water content.
4 Results and discussion
4.1 Morphological analyses
The SEM images of the horizontal and vertical planes of three representative specimens (i.e. A1, A3 and A5) with different kaolin contents are presented in Figure 3, in which white arrows represent clay (kaolin) particles and black arrows represent silt (fine quartz sand) particles. It is observed that clay particles are not gathered to form aggregates but well dispersed when the kaolin content is 100% (Figures 3(a) and (b)). Clay particles are mainly arranged in a face-to-face form because of compaction, so the pores are quite small (less than the average size of clay particles). As the kaolin content decreases, the face-to-face arrangement of clay particles is gradually disturbed because of the presence of silt particles. This leads to the formation of some relatively large pores around silt particles. The size of these pores generally approximates those of clay particles. However, one can note that at a kaolin content of 75%, most of silt particles float in clay particles. As the kaolin content decreases to 50%, more silt particles appear, and thus the preferred arrangement of clay particles by compaction seems completely destroyed. Furthermore, some silt particles get into contact with each other, leading to the presence of more large pores around silt particles.
Previous studies have shown that as the coarse grain content increases, a binary mixture can be divided into three states: 1) coarse grain floating state, 2) transitional state, and 3) coarse grain contact state [29]. Specifically, CHANG et al [30] stated that when the fines content is larger than 35%, most of coarse grains are dispersed in the mixture, and thus the soil behaviour is mainly controlled by fine grains. In this study, the kaolin content is larger than 50%, so the majority of silt particles float in clay particles, which is consistent with the findings reported by CHANG et al [30].
Figure 4 presents the SEM images of the horizontal and vertical planes of three representative silty clay specimens (i.e. B1, B3 and B5). Similarly, white arrows in Figure 4 represent clay (kaolin) particles and black arrows represent silt (fine quartz sand) particles. One can note that as the dry density increases, the pores around silt particles significantly decrease. Particularly, when the dry density of the specimen approaches 1.70 g/cm3 (i.e. the maximum dry density), clay particles fill well the gaps among silt particles, so there are very few pores larger than 1 ��m in both the horizontal and vertical planes. In this case, the M75 silty clay reaches the densest state, which is in line with the compaction test results.
4.2 Pore size distribution
The MIP test results of three representative specimens with different kaolin contents are depicted in Figure 5. It is observed that all cumulative volume-pore diameter curves show S-shaped forms and most of pore diameters fall into the range between 0.01 and 10 ��m. On the other hand, the shape of the differential volume-pore diameter curve varies from a unimodal type to a bimodal type with decreasing kaolin content.
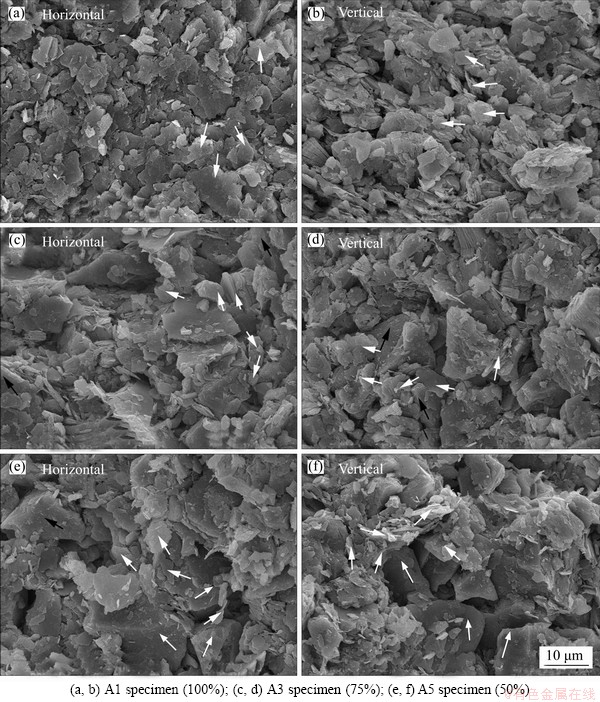
Figure 3 SEM images of three specimens of different kaolin contents:
However, even though the kaolin content approaches 50%, the large size mode is not very significant (Figure 5(b)). This indicates that there are a few large pores (with sizes of several micrometers) in A5 specimen, which confirms the results observed from SEM images (Figure 3). It also shows that the dominant pore diameter (which has the largest frequency) increases from 0.284 to 0.553 ��m and the expected pore diameter gets a rise from 0.319 to 0.617 ��m as the kaolin content decreases from 100% to 50%. Meanwhile, both the �� and �� values show obvious growths.
Figure 6 shows the results of the MIP tests on the specimens with different dry densities. One can note that all cumulative volume-pore diameter curves also present S-shaped forms and most of pore diameters fall into the range between 0.01 and 10 ��m. When the dry density of the specimen increases from 1.50 to 1.70 g/cm3, the dominant pore diameter does not clearly change, but all probabilistic parameters (i.e. De, �� and �� ) generally show decreasing trends. Moreover, it is noted that the number of pores larger than the dominant pore diameter (i.e. 0.350 ��m) is greatly reduced with increasing dry density. As a result, the shape of the differential volume-pore diameter curve varies from a slight bimodal form to a unimodal form.
The relationship between the micro-void ratios measured by the MIP tests and the macro-void ratios (e) determined by conventional laboratory tests is presented in Figure 7. It is noted that the micro-void ratio is linearly correlated with the macro-void ratio. Generally, the values of eMIP are approximately 88% of e, which is broadly in line with the finding of GAO et al [26]. Actually, the result that the values of eMIP are slightly less than e, is reasonable since the MIP technique cannot take the closed, isolated pores into account.
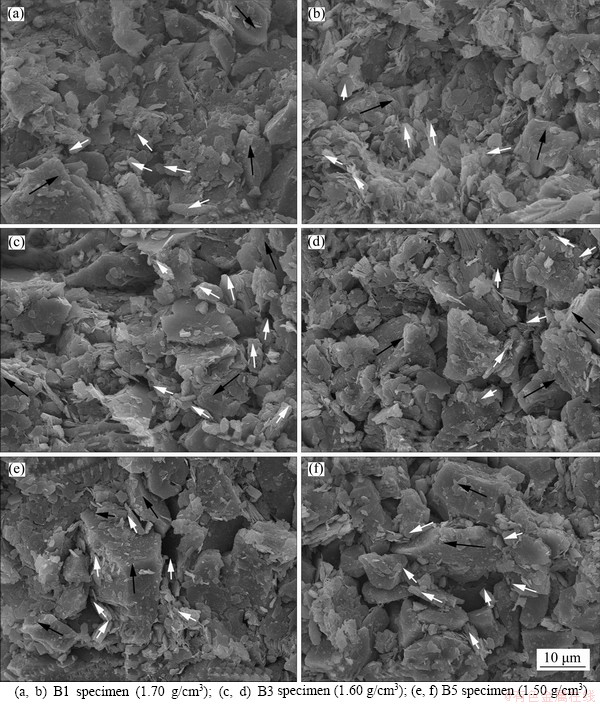
Figure 4 SEM images of three specimens of different dry densities:
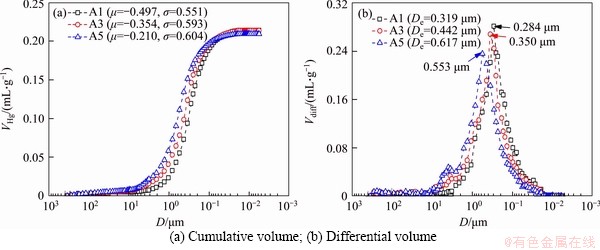
Figure 5 MIP test results of three specimens with different kaolin contents (A1-100%; A3-75%; A5-50%):
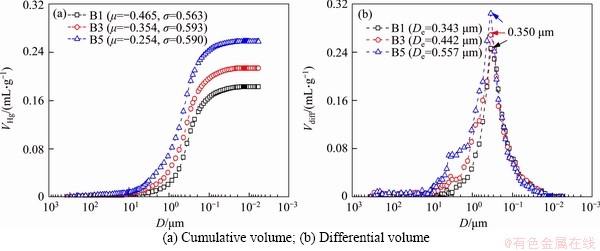
Figure 6 MIP test results of three specimens with different dry densities (B1-1.70 g/cm3; B3-1.60 g/cm3; B5-1.50 g/cm3):
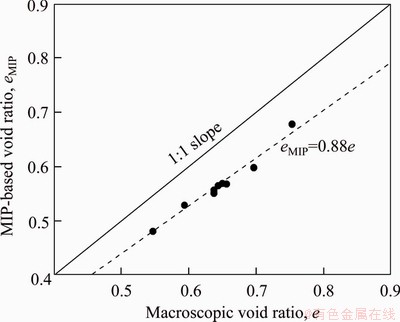
Figure 7 Relationship between micro-void ratios and macro-void ratios
4.3 Soil permeability
4.3.1 Test results and microscopic mechanism
Figure 8 depicts the coefficients of permeability of all soil specimens affected by kaolin content and dry density. It shows that as the kaolin content changes from 50% to 100%, the coefficient of permeability exhibits a rapid decrease followed by a slow decrease. Particularly, the coefficients of permeability of the specimens (i.e. A5 and A1) with kaolin contents of 50% and 100% are 1.48��10-6 cm/s and 3.73��10-7 cm/s, respectively. The possible reason is that although A1 specimen has relatively large porosity (Table 2), its pores are very fine and pore connectivity is bad (Figures 3 and 5), which is not conducive to the flow of water. By contrast, there are large pores around silt particles in A5 specimen (Figure 3), this causes the specimen to have a larger coefficient of permeability. Furthermore, one can note that the coefficient of permeability considerably increases from 5.23��10-7 to 1.44��10-6 cm/s when the dry density changes from 1.70 to 1.50 g/cm3. This is understandable because the larger the dry density is, the smaller the porosity is (Table 2). Moreover, the specimen with a larger dry density has a smaller average pore size compared to the specimen with a smaller dry density (Figures 4 and 6). The order of magnitude of the coefficients of permeability of silty clay specimens is consistent with the results of KONRAD et al [31].
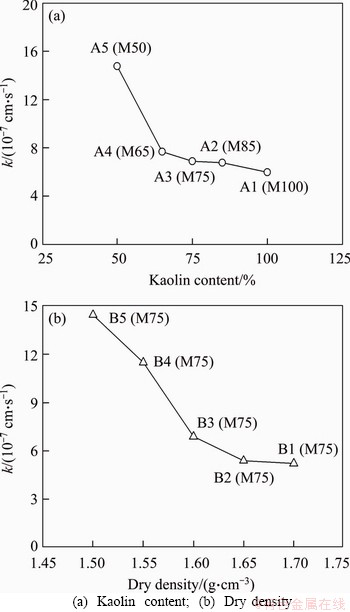
Figure 8 Coefficients of permeability of silty clay specimens affected by:
4.3.2 Permeability equations
1) Permeability versus void ratio
As presented previously, the permeability of silty clay is affected by the void ratio (or dry density) and kaolin content. The aim of this section is thus to quantify their influences on the permeability.
Figure 9(a) depicts the relationship between void ratios and coefficients of permeability of the soil with various kaolin contents and dry densities. It shows that the relationship between void ratios and coefficients of permeability in a logarithmic scale can broadly be characterized by a linear function. However, the fitting effect is relatively bad (R2=0.515), which indicates that the permeability of the studied soil cannot be expressed by the void ratio alone. Thus, the influence of kaolin content needs to be incorporated into the permeability equation. For this reason, the effective porosity that takes both the porosity and kaolin content into consideration is introduced. The effective porosity has the following form [15]:
 (6)
(6)
where neff is the effective porosity; F is the kaolin content; c is a constant with a recommended value of 0.2.
Therefore, the effective void ratio is expressed by eeff=neff/(1-neff). Figure 9(b) illustrates the relationship between the coefficient of permeability and the effective void ratio, which can be characterised by:
 (7)
(7)
where k is the coefficient of permeability; A and B are fitting constants.
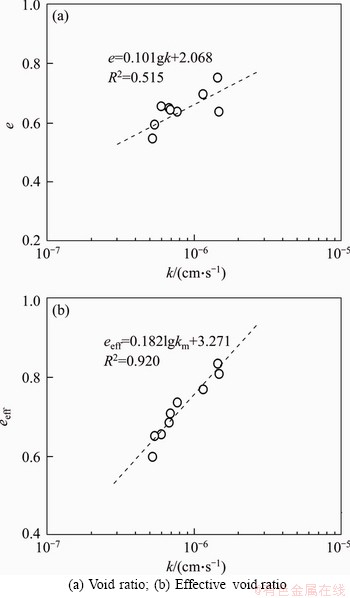
Figure 9 Relationship between coefficient of permeability and void ratio:
One can note that the fitting effect has been significantly improved (Figure 9). This means that Eq. (7) is capable of estimating the coefficient of permeability of silty clay.
2) Permeability based on pore size distribution
It is noted that although Eq. (7) can well characterise the permeability of silty clay, it fails to reflect the influences of pore sizes and pore size distribution. In this section, a microscopic permeability model developed for clay based on the pore size distribution is used to estimate the coefficient of permeability of silty clay. This permeability model has the following expression [16]:
 (8)
(8)
where ��w is the specific weight of water; m=0.18 is the model constant; ��w is the dynamic viscosity of water.
Figure 10 compares the coefficients of permeability calculated by Eq. (8) based on the MIP data (i.e. probabilistic parameters) and the measured results. It shows that the MIP data are useful to quantify the coefficient of permeability of silty clay.
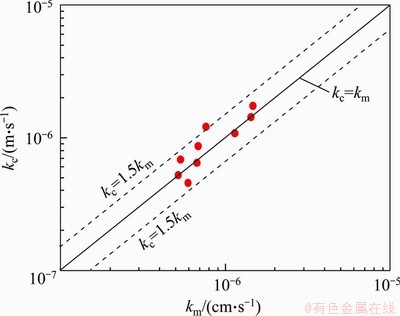
Figure 10 Relationship between calculated (kc) and measured (km) coefficients of permeability
4.4 Soil water retention property
4.4.1 Test results and microscopic mechanism
Figure 11 presents the soil water retention curves (i.e. water content-matric suction curves) of several representative soil specimens measured using the pressure plate apparatus. One can note that the saturated water contents of the specimens in the first group are about 25%, which are larger than the initial water contents (21%) used in specimen preparations. On the drying path, the water content shows a slight reduction first and then a rapid reduction with increasing matric suction. Moreover, the smaller the kaolin content is, the faster the reduction of water content is, and thus the lower the water retention curve is. This indicates that the soil specimen with a higher kaolin content has a larger water retention capacity. The result can be explained by the fact that the soil specimen with a higher kaolin content has very small pores (Figures 3 and 5), which greatly restrains the drainage of water. In addition, the greater the dry density is, the lower the saturated water content is. The specimen with a greater dry density shows a fewer reduction in water content, so the corresponding water retention curve is relatively flatter. This suggests that the specimen of a larger dry density is less likely to lose water. The finding is reasonable because the dominant pores and porosity of the specimen with a larger dry density are much smaller (Figures 4 and 6).
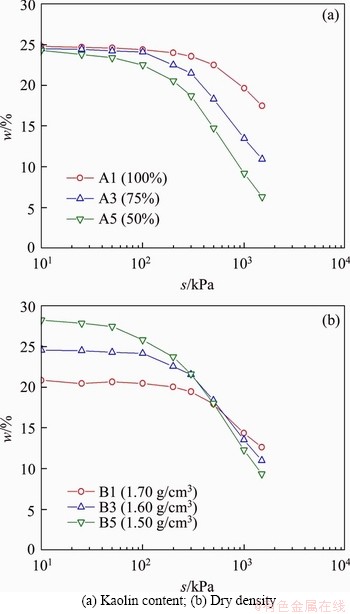
Figure 11 Water retention curves of silty clay specimens affected by:
4.4.2 Soil water retention equations
1) Empirical equation
Many soil water retention models were proposed in the literature, but the most frequently- used one is the van Genuchten model, which is expressed by [32]:
 (9)
(9)
where ws is the saturated water content; s is the matric suction; a and b are fitting constants.
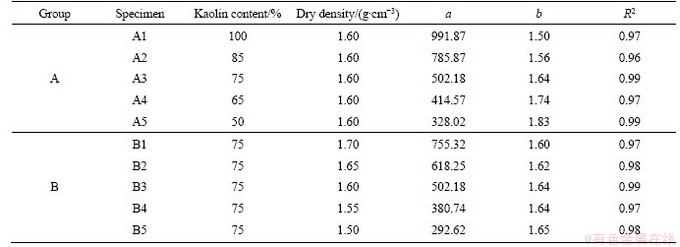
The measured water retention curves of the soil with various kaolin contents and dry densities were fitted with the van Genuchten model. Table 3 gives the fitting constants of this study. One can note that the a value significantly reduces with the decrease in kaolin content and dry density. On the other hand, the b value slightly increases with decreasing kaolin content and dry density. Thus, the fitting parameters of van Genuchten model can be defined as functions of the kaolin content and dry density:
 (10)
(10)
 (11)
(11)
where ��, ��, p, q, r and t are fitting constants (Figure 12).
Table 3 Fitting parameters of van Genuchten model for different specimens
Therefore, a modified van Genuchten model that can consider the influences of kaolin content and dry density is obtained for silty clay by substituting Eqs. (10) and (11) into Eq. (9). As discussed in Section 4.4.1, the soil water retention curves of silty clay highly depends on the pore size. For this reason, the fitting constants a and b are correlated with the expected pore diameter (De) by a linear function, as depicted in Figure 13. This indicates that the water retention curves of silty clay with different kaolin contents and dry densities can also be estimated based on the expected pore diameter.
2) Equation based on pore size distribution
The previous results show that the water retention property of silty clay is closely related to its pore structure. Hence, it is necessary to characterize the relationship between the water retention property and pore size distribution. For this purpose, the equations developed by KONG et al [24] were employed to estimate the soil water retention curves of silty clay:
 (12)
(12)
 (13)
(13)
where (ua-uw)i is the matric suction corresponding to Di; Ts is the water surface tension; V(Di) is the cumulative volume of pores less than Di; ��w is the water density.
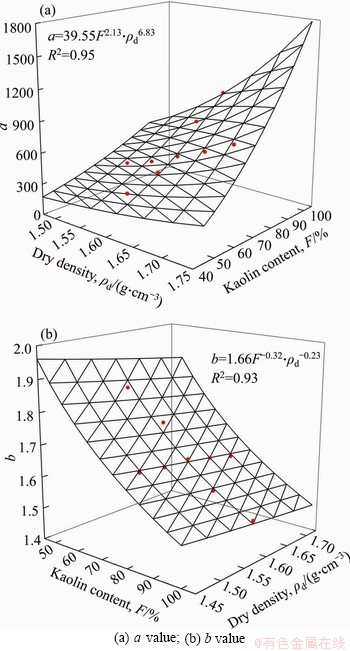
Figure 12 Fitting parameters of van Genuchten model as functions of kaolin content and dry density:
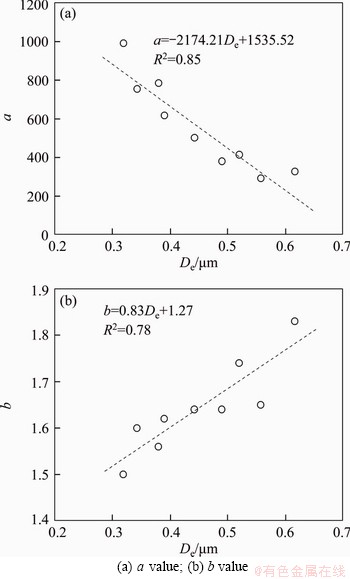
Figure 13 Fitting parameters of van Genuchten model as functions of expected pore diameter:
The estimated water retention curves of different silty clay specimens via Eqs. (12) and (13) are plotted in Figure 14. One can note that the estimated water retention curves show almost similar trends as the measured data (Figure 11). Nevertheless, the predicted curves are generally lower than the measured curves. This is because the determination of water content by Eq. (13) is based on the MIP results, which do not take the isolated pores into consideration.
5 Conclusions
The microstructure of binary silty clay was examined by SEM observations and MIP tests. Subsequently, the coefficient of permeability and water retention property were studied by falling-head permeability tests and water retention tests. Finally, the hydraulic properties of silty clay were analyzed from a microscopic point of view. The following conclusions can be drawn:
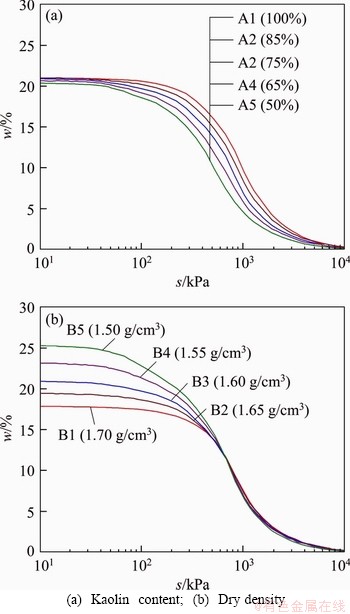
Figure 14 Estimated water retention curves of silty clay specimens affected by:
1) Clay particles are well dispersed and show preferred orientation after compaction when the kaolin content is 100%. As the kaolin content decreases, the preferred arrangement of clay particles is gradually disturbed because of the existence of silt particles, leading to the formation of large pores around silt particles. Meanwhile, the number of pores around silt particles is significantly reduced with increasing dry density increases.
2) The permeability of silty clay considerably decreases with increasing kaolin content and dry density. This is because the specimen with a smaller kaolin content or dry density possesses more large pores around silt particles, which greatly contribute to the flow of water. Thus, the coefficient of permeability of silty clay can be estimated from the effective void ratio or probabilistic parameters of pore size distributions.
3) The larger the dry density or kaolin content is, the fewer the reduction of water content is, and thus the larger the water retention capacity is. The reason is probably that the specimen with a higher kaolin content or dry density has very fine pores, which highly restrains the drainage of water. The water retention curves of the specimens with different kaolin contents and dry densities can be characterised by the modified van Genuchten model and pore parameters-based equations.
4) The above results could provide a new insight regarding the mechanism underlying the hydraulic behaviour of silty clay. Further work could focus on quantifying the microstructure of silty clay in the aspect of particle arrangement and linking the evolution of hydraulic properties of silty clay to the stability of highway embankments.
References
[1] YE Y. Marine geo-hazards in China [M]. Rotterdam, Netherlands: Elsevier Science, 2017.
[2] ZHANG C, JIANG G, LIU X, WANG Z. Lateral displacement of silty clay under cement-fly ash-gravel pile-supported embankments: Analytical consideration and field evidence [J]. Journal of Central South University, 2015, 22(4): 1477-1489. DOI: 10.1007/s11771-015-2665-9.
[3] XU X, WANG B, FAN C, ZHANG W. Strength and deformation characteristics of silty clay under frozen and unfrozen states [J]. Cold Regions Science and Technology, 2020, 172: 102982. DOI: 10.1016/j.coldregions.2019. 102982.
[4] ZHANG J, PENG J, ZENG L, LI J, LI F. Rapid estimation of resilient modulus of subgrade soils using performance- related soil properties [J]. International Journal of Pavement Engineering, 2020. DOI: 10.1080/10298436.2019.1643022.
[5] SAKAI A, SAMANG L, MIURA N. Partially-drained cyclic behavior and its application to the settlement of a low embankment road on silty-clay [J]. Soils and Foundations, 2003, 43(1): 33-46. DOI: 10.3208/sandf.43.33.
[6] ZHANG Jun-hui, LI Feng, ZENG Ling, PENG Jun-hui, LI Jue. Numerical simulation of the moisture migration of unsaturated clay embankments in southern China considering stress state [J]. Bulletin of Engineering Geology and the Environment, 2020. DOI: 10.1007/s10064-020-01916-6.
[7] CHENG Y, HUANG X, LI C, LI L. Soil-atmosphere interaction as triggering factors of openings between embankment and pavement [J]. KSCE Journal of Civil Engineering, 2018, 22(5): 1642-1650. DOI: 10.1007/ s12205-017-0679-6.
[8] ZHANG J, PENG J, LIU W, LU W. Predicting resilient modulus of fine-grained subgrade soils considering relative compaction and matric suction [J]. Road Materials and Pavement, 2020. DOI: 10.1080/14680629. 2019.1651756.
[9] ZHANG J, DING L, LI F, PENG J. Recycled aggregates from construction and demolition wastes as alternative filling materials for highway subgrades in China [J]. Journal of Cleaner Production, 2020, 255: 120223. DOI: 10.1016/ j.jclepro.2020.120223.
[10] ZENG Ling, YAO Xiao-fei, ZHANG Jun-hui, GAO Qian-feng, CHEN Jing-cheng, GUI Yu-tong. Ponded infiltration and spatial-temporal prediction of the water content of silty mudstone [J]. Bulletin of Engineering Geology and the Environment, 2020: 1-13. DOI: 10.1007/ s10064-020-01880-1.
[11] DONG H, HUANG R, GAO Q F. Rainfall infiltration performance and its relation to mesoscopic structural properties of a gravelly soil slope [J]. Engineering Geology, 2017, 230: 1-10. DOI: 10.1016/j.enggeo.2017.09.005.
[12] FREDLUND D G. State of practice for use of the soil-water characteristic curve (SWCC) in geotechnical engineering [J]. Canadian Geotechnical Journal, 2019, 56(8): 1059-1069. DOI: 10.1139/cgj-2018-0434.
[13] KIM W S, BORDEN R H. Influence of soil type and stress state on predicting shear strength of unsaturated soils using the soil-water characteristic curve [J]. Canadian Geotechnical Journal, 2011, 48(12): 1886-1900. DOI: 10.1139/t11-082.
[14] DIEUDONNE A C, DELLA VECCHIA G, CHARLIER R. Water retention model for compacted bentonites [J]. Canadian Geotechnical Journal, 2017, 54(7): 915-925. DOI: 10.1139/cgj-2016-0297.
[15] GAO Q F, DONG H, HUANG R, LI Z F. Structural characteristics and hydraulic conductivity of an eluvial-colluvial gravelly soil [J]. Bulletin of Engineering Geology and the Environment, 2019, 78(7): 5011-5028. DOI: 10.1007/s10064-018-01455-1.
[16] GAO Q F, ZHAO D, ZENG L, DONG H. A pore size distribution-based microscopic model for evaluating the permeability of clay [J]. KSCE Journal of Civil Engineering, 2019, 23(12): 5002-5011. DOI: 10.1007/s12205-019- 2219-z.
[17] REN J, SHEN Z Z, YANG J, ZHAO J, YIN J. Effects of temperature and dry density on hydraulic conductivity of silty clay under infiltration of low-temperature water [J]. Arabian Journal for Science and Engineering, 2014, 39(1): 461-466. DOI: 10.1007/s13369-013-0849-x.
[18] AL-DAKHEELI H, BULUT R. Interrelationship between elastic deformation and soil-water characteristic curve of expansive soils [J]. Journal of Geotechnical and Geoenvironmental Engineering, 2019, 145(4): 04019005. DOI: 10.1061/(ASCE)GT.1943-5606.0002020.
[19] SUN Y, TANG L. Use of X-ray computed tomography to study structures and particle contacts of granite residual soil [J]. Journal of Central South University, 2019, 26(4): 938-954. DOI: 10.1007/s11771-019-4062-2.
[20] ZENG L, YAO X, GAO Q F, BIAN H. Use of nanosilica and cement in improving the mechanical behavior of disintegrated carbonaceous mudstone [J]. Journal of Nanoscience and Nanotechnology, 2020, 20(8): 4807-4814. DOI: 10.1166/jnn.2020.18483.
[21] GAO Q F, HATTAB M, JRAD M, FLEUREAU J M, HICHER P Y. Microstructural organization of remoulded clays in relation with dilatancy/contractancy phenomena [J]. Acta Geotechnica, 2020, 15(1): 223-243. DOI: 10.1007/ s11440-019-00876-w.
[22] ZIDAN A F, ABOUKHADRA A A, GABER Y. Enhancement of resilient modulus of cohesive soil using an enzymatic preparation [J]. Journal of Central South University, 2019, 26(9): 2596-2608. DOI: 10.1007/s11771-019-4197-1.
[23] ZENG L, XIAO L, ZHANG J, FU H. The role of nanotechnology in subgrade and pavement engineering: A review [J]. Journal of Nanoscience and Nanotechnology, 2020, 20(8): 4607-4618. DOI: 10.1166/jnn.2020.18491.
[24] KONG L W, TAN L R. A simple method of determining the soil-water characteristic curve indirectly [C]//Proceedings of Unsaturated Soils for Asia. Singapore, 2000: 314-345.
[25] VERVOORT R W, CATTLE S R. Linking hydraulic conductivity and tortuosity parameters to pore space geometry and pore-size distribution [J]. Journal of Hydrology, 2003, 272(1-4): 36-49. DOI: 10.1016/S0022-1694(02) 00253-6.
[26] GAO Q F, JRAD M, HATTAB M, FLEUREAU J M. Pore morphology, porosity and pore size distribution in kaolinitic remoulded clays under triaxial loading [J]. International Journal of Geomechanics, 2020, 20(6): 04020057. DOI: 10.1061/(ASCE)GM.1943-5622. 0001682.
[27] KONRAD J M, SAMSON M. Hydraulic conductivity of kaolinite-silt mixtures subjected to closed-system freezing and thaw consolidation [J]. Canadian Geotechnical Journal, 2000, 37(4): 857-869. DOI: 10.1139/t00-003.
[28] PAYAN M, KHOSHINI M, JAMSHIDI CHENARI R. Elastic dynamic Young��s modulus and Poisson��s ratio of sand-silt mixtures [J]. Journal of Materials in Civil Engineering, 2020, 32(1): 04019314. DOI: 10.1061/(ASCE) MT.1943-5533.0002991.
[29] ZHOU W, XU K, MA G, YANG L, CHANG X. Effects of particle size ratio on the macro-and microscopic behaviors of binary mixtures at the maximum packing efficiency state [J]. Granular Matter, 2016, 18(4): 81. DOI: 10.1007/s10035- 016-0678-1.
[30] CHANG C S, MEIDANI M. Dominant grains network and behavior of sand�Csilt mixtures: stress�Cstrain modeling [J]. International Journal for Numerical and Analytical Methods in Geomechanics, 2013, 37(15): 2563-2589. DOI: 10.1002/nag.2152.
[31] KONRAD J M, SAMSON M. Influence of freezing temperature on hydraulic conductivity of silty clay [J]. Journal of Geotechnical and Geoenvironmental Engineering, 2000, 126(2): 180-187. DOI: 10.1061/(ASCE)1090- 0241(2000)126:2(180).
[32] van GENUCHTEN M T. A closed-form equation for predicting the hydraulic conductivity of unsaturated soils 1 [J]. Soil Science Society of America Journal, 1980, 44(5): 892-898. DOI: 10.2136/sssaj1980.0361599500440005000 2x.
(Edited by ZHENG Yu-tong)
���ĵ���
�����۽ṹ��ѹʵ��Ԫ������������ˮ����
ժҪ���������·�̵��;�����һ���̶�����ˮ��Ǩ�ƿ��ƣ�������ȡ��������ˮ�����ԡ������о���ѹʵ��Ԫ���������ˮ�����ԡ����ȣ�����ͬ��ϱȺ��ܶ��Ʊ��˵Ķ�Ԫ�������������������ɨ��羵��ѹ���Ƿ����˷���������۽ṹ��Ȼ��ͨ����ˮͷ������ͳ�ˮ�����飬�о��˷�����������Ժͳ�ˮ�ԡ�������������������Ϊ100%ʱ��ѹʵ�����������ɢ�����ã������ֶ���������������������������ͣ���������Ķ����������ܵ��������ڵĸ��ţ����·�����Χ�γ�������϶����������Χ��϶���������Ÿ��ܶȵ��������Լ�С�����ң���������������ܶȵ����ӣ�������������Խ��Ͷ���ˮ����ǿ������������ܶ�Խ��������еĿ�϶Խ�٣���ˮ���������谭Խǿ����������������ˮ���Ծ���ͨ�����ֲ�������������Ԥ�⡣
�ؼ��ʣ�����������۽ṹ�����ԣ���ˮ�ԣ�ɨ��羵
Foundation item: Projects(51908069, 51908073, 51838001, 51878070) supported by the National Natural Science Foundation of China; Project(2019SK2171) supported by the Key Research and Development Program of Hunan Province, China; Project(kfj190605) supported by the Open Fund of Engineering Laboratory of Spatial Information Technology of Highway Geological Disaster Early Warning in Hunan Province (Changsha University of Science & Technology), China; Project(2019IC04) supported by the Double First-Class Scientific Research International Cooperation Expansion Project of Changsha University of Science & Technology, China; Project(kq1905043) supported by the Training Program for Excellent Young Innovators of Changsha, China
Received date: 2020-03-21; Accepted date: 2020-04-08
Corresponding author: SHI Zhen-ning, PhD, Lecturer; Tel: +86-15111272734; E-mail: shizhenning@126.com; ORCID: 0000-0001- 8580-0098
Abstract: The durability of silty clay embankments is partially controlled by the moisture migration, which depends on soil hydraulic properties. This paper presents an experimental study of hydraulic properties of compacted binary silty clay. Specimens with different mixing ratios and dry densities were prepared. Scanning electron microscopy and mercury intrusion porosimetry were used to characterise the microstructure of silty clay. Thereafter, falling-head permeability tests and water retention tests were conducted to study the permeability and water retention property, respectively. The results demonstrate that clay particles are dispersed and show preferred arrangements after compaction when the clay content is 100%. As the clay content decreases, the arrangement of clay particles is gradually disturbed because of the existence of silt particles, causing the formation of large pores around silt particles. When the dry density increases, the pores around silt particles significantly decrease. Moreover, the permeability of silty clay decreases but the water retention capacity increases with increasing clay content and dry density. This is because the silty clay with larger clay content and dry density has fewer large pores, which greatly restrains the flow of water. Both the permeability and water retention property of silty clay can be predicted from pore size distribution parameters.
