
J. Cent. South Univ. (2012) 19: 1980-1987
DOI: 10.1007/s11771-012-1235-7![]()
Nonlinear flow numerical simulation of low-permeability reservoir
YU Rong-ze(������)1, BIAN Ya-nan(������)1, ZHOU Shu(����)2, WANG Kai-jun(������)3,
L? Qi(����)4, CHEN Zhao-hui(�³���)5
1. PetroChina Research Institute of Petroleum Exploration & Development-Langfang, Langfang 065007, China;
2. Special Oil Development Company of Liaohe Oilfield Company, Panjin 124010, China;
3. Down-hole Service Company of Xinjiang Oilfield Company, Kelamayi 834000, China;
4. Geological Scientific Research Institute of Shengli Oilfield Company, Dongying 257015, China;
5. CNOOC Energy Technology & Service-Oilfield Engineering Research Institute, Tianjin 300452, China
? Central South University Press and Springer-Verlag Berlin Heidelberg 2012
Abstract:
A nonlinear flow reservoir mathematical model was established based on the flow characteristic of low-permeability reservoir. The well-grid equations were deduced and the dimensionless permeability coefficient was introduced to describe the permeability variation of nonlinear flow. The nonlinear flow numerical simulation program was compiled based on black-oil model. A quarter of five-spot well unit was simulated to study the effect of nonlinear flow on the exploitation of low-permeability reservoir. The comprehensive comparison and analysis of the simulation results of Darcy flow, quasi-linear flow and nonlinear flow were provided. The dimensionless permeability coefficient distribution was gained to describe the nonlinear flow degree. The result shows that compared with the results of Darcy flow, when considering nonlinear flow, the oil production is low, and production decline is rapid. The fluid flow in reservoir consumes more driving energy, which reduces the water flooding efficiency. Darcy flow model overstates the reservoir flow capability, and quasi-linear flow model overstates the reservoir flow resistance. The flow ability of the formation near the well and artificial fracture is strong while the flow ability of the formation far away from the main streamline is weak. The nonlinear flow area is much larger than that of quasi-linear flow during the fluid flow in low-permeability reservoir. The water propelling speed of nonlinear flow is greatly slower than that of Darcy flow in the vertical direction of artificial fracture, and the nonlinear flow should be taken into account in the well pattern arrangement of low-permeability reservoir.
Key words:
low-permeability reservoir; nonlinear flow; mathematical model; numerical simulation��
1 Introduction
For many years, Darcy��s law has been considered a fundamental equation that governs fluid flow in porous media. In 1869, KING [1] firstly detected the nonlinear fluid flow characteristic in low-permeability porous media. In the chemical engineering, some authors [2-3] have also noted that there may be departures from Darcy��s law at low-velocity fluid flow. BASAK [4] identified the low pressure gradient and low-velocity fluid flow as ��pre-Darcy flow��, where the increase of fluid flow velocity can be greater than that proportional to the increase of fluid pressure gradient. Since then, many scholars [5-8] have confirmed the nonlinear fluid flow characteristic in low-permeability porous media. In recent years, the petroleum industry has shown a renovated interest in nonlinear flow [9-13], in order to better understand reservoir performance. Nonlinear flow is typically observed in low-permeability reservoir. In a consequence, pressure drop cannot be estimated from the classic Darcy equation, where the pressure gradient is a linear function of the flow velocity. In that case, in fact, the use of conventional reservoir numerical simulation software based on Darcy equation will lead to inaccurate production performances evaluation. Figure 1 presents the typical nonlinear flow curve [14-15], where the flow velocity increases nonlinearly with the driving pressure gradient. There are two specific points on the non-Darcy flow curve. Point A is the intersection point between the non-Darcy flow curve and x axis, and the corresponding pressure gradient is defined as the minimum starting pressure gradient. The fluid flow only happens when the driving pressure gradient exceeds the minimum pressure gradient. Point C is the critical point where the non-Darcy flow turns into quasi-linear flow, and the corresponding pressure gradient is known as critical pressure gradient. OA is the inert segment; AC is the nonlinear flow segment; CD is the quasi-linear segment. The fluid flow curve of low-permeability consists of nonlinear flow segment and quasi-linear flow segment. Point B is a hypothetical point between the extended line of DC and x axis, and the corresponding pressure gradient is defined as quasi-linear starting pressure gradient. At present, there are many flow models to describe the nonlinear flow law in low-permeability reservoir, which can be easily divided into quasi-linear flow and nonlinear flow models.
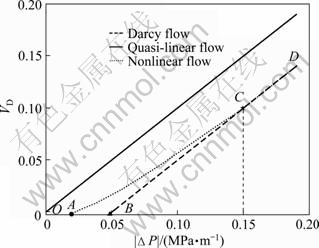
Fig. 1 Nonlinear flow curve of low-permeability reservoir
The quasi-linear flow model [16-17] takes the starting pressure gradient as a constant by extending the quasi-linear flow segment and neglecting the nonlinear flow segment. Due to the introduction of a constant in Darcy equation, the quasi-linear flow model is widely used in reservoir engineering, well test analysis and reservoir numerical simulation. CHENG and HAN [18-19] developed a two-dimensional and two-phase non-Darcy flow numerical simulator based on quasi-linear flow model. ZHAO [20] implemented the three-dimensional and three-phase quasi-linear flow numerical simulator which takes the starting pressure as a variable. YUAN and HAN [21] also contributed to the development of quasi-linear flow numerical simulation. However, the quasi-linear flow model does not take the nonlinear flow segment into consideration. The fluid flow only happens when the driving pressure gradient exceeds the quasi-linear starting pressure gradient, which shortens the flow range of low-permeability reservoir. There will be evident deviation between the field production and the theoretical analysis based on quasi-linear flow model, and a low economic and technical index will also be gained based on this flow model. Therefore, the quasi-linear flow model also has limitations in field application.
The nonlinear flow model [22] which takes both the nonlinear flow segment and the quasi-linear flow segment into consideration could describe the nonlinear flow law accurately. LONG [23] achieved the numerical simulation based on nonlinear flow model and developed the corresponding numerical simulator. This simulator which only establishes the relationship between the driving pressure gradient and permeability does not provide a smooth flow model and a complete reservoir mathematical model. Because of the function complexity and nonlinearity, there are not sufficient researches on the reservoir numerical simulation based on the nonlinear flow model. Therefore, it is of great necessity to include the nonlinear flow into low-permeability reservoir numerical simulation.
In this work, a nonlinear flow reservoir mathematical model is established based on the flow characteristic of low-permeability reservoir. The well-grid equations were deduced and the dimensionless permeability coefficient was introduced to describe the permeability variation. The nonlinear flow numerical simulation program was complied. A quarter of a five-spot well pattern unit geological model was simulated to study the effect of nonlinear flow on the exploitation of low-permeability reservoir. The oil production, water cut, reservoir pressure distribution and reservoir pressure gradient distribution under Darcy flow model, quasi-linear flow model and nonlinear flow model were provided. At last, the dimensionless permeability coefficient distribution was gained to describe the nonlinear flow degree.
2 Reservoir mathematical model
2.1 Basic assumptions
The assumptions for the nonlinear flow reservoir mathematical model are as follows. Firstly, the flow in low-permeability reservoir is isothermal flow. Secondly, there are at most three components in reservoir; the liquid component exists in the liquid phase completely; the gas component can exist in the gas phase as free gas, or exist in the liquid phase as dissolved gas; the liquid phase and the gas phase can achieve the phase equilibrium state instantaneously. Thirdly, the liquid phase and the gas phase are miscible. Fourthly, the liquid phase follows nonlinear flow law and the gas phase follows Darcy equation. Fifthly, the liquid permeability is the function of formation pressure gradient.
2.2 Mathematical equations
The motion equation:
 (1)
(1)
The state equation:
![]() (2)
(2)
 (3)
(3)
The continuity equation:
![]() (4)
(4)
![]() (5)
(5)
The auxiliary equation:
 (6)
(6)
where V is flow velocity, cm/s; K is absolute permeability, 10-3 ��m2; Kr is relative permeability; �� is phase viscosity, mPa��s; �� is density, g/cm3; P is pressure, MPa; S is the saturation; Pcgl is the capillary pressure of gas/liquid interface, MPa; �� is porosity; B is volume factor, m3/m3; q is mass rate of injection (or production, if negative), g/(cm3��s3); a is the dimensionless nonlinear parameter; b is nonlinear parameter, m/MPa. Subscripts ��l�� is liquid phase and ��g�� is gas phase.
Two nonlinear parameters are focused: a is an affecting factor that influences the nonlinear flow concave curve segment; b is equivalent to the reciprocal of the quasi-linear starting pressure gradient in the quasi-linear flow model. The second part of the permeability state equation reflects the loss of liquid permeability, resulting in nonlinear flow.
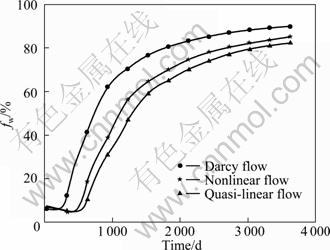
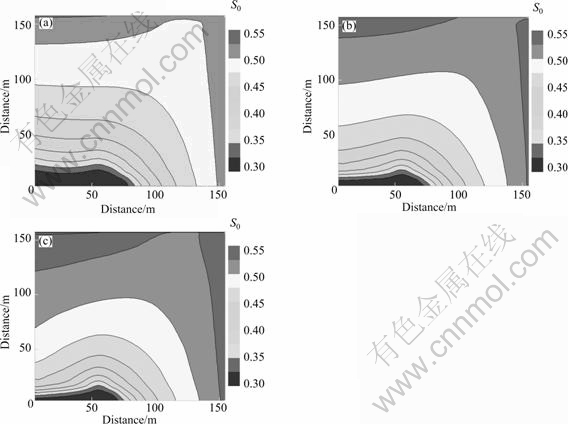
1) When 0 2) When a��1, the nonlinear flow curve is zero-axial, and the minimum starting pressure gradient is zero. The model is applicable to the low permeability porous media whose minimum starting pressure gradient is zero. 3) When a=0, the nonlinear flow model turns into quasi-linear flow model, and 1/b is the quasi-linear starting pressure gradient. 4) When the value of b is infinitely large, the acting force between the fluid and the rock is very small. The fluid flow follows Darcy��s law. The model is applicable to the medium and high permeability porous media. To sum up, the nonlinear flow mathematical model can describe different types of flow curve very well, and it is more suitable to be applied to the low-permeability reservoir. Figure 2 provides flow curves with different nonlinear flow parameters. Fig. 2 Nonlinear flow curves with different parameters of a and b 2.3 Boundary conditions 2.3.1 Outer boundary condition There are three kinds of outer boundary conditions: 1) The outer boundary pressure is known, where G is the boundary: 2) The outer boundary flow rate is known: 3) Mixed boundary condition: 2.3.2 Inner boundary condition There are two kinds of inner boundary conditions: 1) Fixed flow rate condition, where the flow rate of inner boundary is known: 2) Fixed pressure condition, where the pressure of inner boundary is known: 2.4 Initial conditions 1) Initial pressure distribution: 2) Initial saturation distribution: 3 Numerical solution The block-centered seven-point finite difference was used to discrete the nonlinear flow reservoir mathematical model, and the dimensionless permeability coefficient (the ratio of measured instantaneous permeability to the absolute permeability in the range of [0, 1]) was introduced to achieve the nonlinear flow process by correcting the absolute permeability in every time step. The dimensionless permeability coefficient reflects the relative value of effective permeability, and the instantaneous effective permeability increases with the increase of dimensionless permeability coefficient. Equations (7) and (8) present the difference equations of the liquid phase and gas phase. The liquid phase: The gas phase: 3.1 Well-grid equation 3.1.1 Grid equation The discrete grid system is composed of hexahedrons unit, and i, j, k are the numbers of x, y, z directions. The x direction is taken as an example to establish the flow equation. Following the processing method of permeability in black-oil model, the harmonic mean method is used to weight the nonlinear flow parameters of adjacent grids in flow equations. The dimensionless permeability coefficient is introduced. Equation (9) is the general grid flow equation, and Eq. (10) is the expression of dimensionless permeability coefficient, where �� is the dimensionless permeability coefficient; T is finite-difference transmissibility, i, j, k are the grid point subscripts. where 3.1.2 Processing of well For the inner boundary condition with wells, the quasi-linear flow processing method is used because of the high formation pressure gradient near the well during practical production process. Equations (11) and (12) are the dimensionless permeability coefficient and flow equation of well grid: 3.2 Solution The nonlinear flow numerical simulation program of three-dimension and three-phase in low permeability reservoir is compiled on the basis of black-oil mode. The alternate iteration method was selected to achieve the fully-implicit numerical solution, which can avoid the fluctuation of results due to the introduction of nonlinear flow model. At the same time, the mature discretization method of black oil model is inherited to actualize the fully implicit solution process. The nonlinear flow process can be perceived as the variation of effective permeability and the pseudo-permeability method could predict the nonlinear fluid flow in low permeability reservoir more accurately. 4 Calculation instance The nonlinear flow numerical simulation program is used to study the effect of nonlinear flow on the exploitation of low-permeability reservoir. The reservoir geological model is a quarter of a five-spot well pattern unit whose well spacing is 300 m. There are a production well and a water injection well in the model. The reservoir absolute permeability is 1.40��10-3 ��m2; the porosity is 10.57%. The bottom hole pressures of production well and water injection well are kept constant during the reservoir numerical simulation. The simulation results under Darcy flow model, nonlinear flow model (a=0.5, b=25) and quasi-linear flow model (a=0, b=25) (Fig. 2) are compared and analyzed to study the effect of nonlinear flow on the exploitation of low-permeability reservoir. At last, the dimensionless permeability coefficient distribution is gained to describe the reservoir nonlinear flow degree. Figures 3 and 4 give the oil production and water cut under different flow models. They indicate that the oil production of Darcy flow model is the highest one under the same injection-production pressure difference. The oil production of nonlinear flow model is lower and descends more rapidly. Due to neglecting the nonlinear flow segment, the oil production of the quasi-linear flow model is the lowest. The water breakthrough time of nonlinear flow and quasi-linear flow lags behind that of Darcy flow, and so does the water cut escalating rate. Figure 5 illustrates the reservoir pressure and pressure gradient distribution in ten years, which indicates that the pressure contour of nonlinear flow model is more intensive than that of Darcy flow in the formation far away from the wells, and the pressure contour of quasi-linear flow is the most intensive one among three flow models. The pressure gradient of the formation near the wells is high, while the pressure gradient of the formation far away from the wells is relatively low. The pressure gradient of nonlinear flow model in the formation far away from the wells is higher than that of Darcy flow, which proves that the nonlinear flow in the reservoir consumes more driving energy. The pressure gradient of quasi-linear flow model in the formation far away from the wells is the highest one in the simulation results of different flow models. The pressure gradient distribution also illustrates that during the exploitation of low-permeability reservoir, Darcy flow model overstates the reservoir flow capability, and quasi-linear flow model overstates the reservoir flow resistance. Fig. 3 Oil production under different flow models Fig. 4 Water cut under different flow models Figure 6 shows the comparison of oil saturation distribution under different flow models. It is demonstrated that the oil saturation of Darcy flow model is the lowest one, and the oil saturation of quasi-linear flow model is the highest one under the same injection-production pressure difference. The nonlinear flow reduces the water flooding efficiency of low-permeability reservoir. It is also indicated that the propelling speed of nonlinear flow model is much less than that of Darcy flow in the vertical direction of artificial fracture. Therefore, the nonlinear flow characteristic should be taken into consideration in the well pattern arrangement of low-permeability reservoir. The dimensionless permeability coefficient reflects the reservoir producing degree and the nonlinear flow degree. The nonlinear flow degree becomes strong and the reservoir producing degree decreases with the decrease of the dimensionless permeability coefficient. When the dimensionless permeability coefficient is 1.0, the fluid flow follows quasi-linear flow. When the dimensionless permeability coefficient is zero, the fluid does not flow. Figure 7 provides the plane dimensionless permeability coefficient of nonlinear flow model in ten years. It is indicated that the dimensionless permeability coefficients near the wells and artificial fractures are 1.0 because of the high formation pressure gradient, and both the flow capability and the producing degree in this area are high. The fluid flow follows quasi-linear flow in this area. The producing degree and flow capability are weak in the area far away from the main streamline and is also the remaining oil-enriched area. The fluid flow follows nonlinear flow in this area. The quasi-linear flow only happens in the area near the wells and artificial fractures. It is clear that the nonlinear flow area is extremely larger than that of quasi-linear flow, which verifies the necessity of taking the nonlinear flow into account during the exploitation of low-permeability reservoir. Fig. 5 Reservoir pressure ((a)-(c)) and pressure gradient ((a��)-(c��)) distributions of different flow models in ten years: (a), (a��) Darcy flow; (b), (b��) Nonlinear flow; (c), (c��) Quasi-linear flow Fig. 6 Oil saturation distribution of different flow models in ten years: (a) Darcy flow; (b) Nonlinear flow; (c) Quasi-linear flow Fig. 7 Dimensionless permeability coefficient distribution of nonlinear flow model in ten years: (a) ��x; (b) ��y 5 Conclusions 1) A nonlinear flow reservoir mathematical model is established to describe the fluid flow in low-permeability reservoir. The well-grid equations are deduced and the dimensionless permeability coefficient is introduced to describe the permeability variation of nonlinear flow. 2) The nonlinear flow numerical simulation program is complied based on black-oil model. A quarter of a five-spot well pattern unit is simulated to study the effect of nonlinear flow on the exploitation of low-permeability reservoir. The simulation results of nonlinear flow model are between the simulation results of Darcy flow and quasi-linear flow. Darcy flow model overstates the reservoir flow capability, and quasi-linear flow model overstates the reservoir flow resistance. Compared with the simulation results of Darcy flow, when considering nonlinear flow, the oil production is low, and production decline is rapid; the fluid flow in reservoir consumes more driving energy which reduces the water flooding efficiency. The water propelling speed of nonlinear flow is greatly slower than that of Darcy flow in the vertical direction of artificial fracture, and the nonlinear flow should be considered in the well pattern arrangement of low-permeability reservoir. 3) The flow capability of the formation near the well and artificial fracture is strong while the flow ability of the formation far away from the main streamline is weak. The quasi-linear flow only happens in the area near the wells and artificial fractures. It is clear that the nonlinear flow area is extremely larger than that of quasi-linear flow, which verifies the necessity of taking the nonlinear flow into account during the exploitation of low-permeability reservoir. References [1] KING F H. Principles and conditions of the movements of ground water [R]. Washington: Government Printing Office, 1899: 59. [2] FAND R M, KIM B Y K, LAM A C C, PHAN R T. Resistance to the flow of fluids through simple and complex porous media whose matrices are composed of randomly packed spheres [J]. Journal of Fluids Engineering, 1987, 109(3): 268-273. [3] LIU Shi-jie, MASLIYAH J H. Single fluid flow in porous media [J]. Chemical Engineering Communications, 1996, 148(1): 653-732. [4] BASAK P. Non-Darcy flow and its implications to seepage problems [J]. Journal of the Irrigation and Drainage Division, 1977, 103(4): 459-473. [5] MILLER R J, LOW P F. Threshold gradient for water flow in clay systems [J]. Soil Science Society of American Journal, 1963, 27(6): 605-609. [6] NEUZIL C E. Ground water flow in low-permeability environments [J]. Water Resources Research, 1986, 22(8): 1163-1195. [7] YAN Qing-lai, HE Qiu-xuan, WEI Li-gang, QU Zhan, REN Xiao-juan. A laboratory study on percolation characteristics of single phase flow in low-permeability reservoirs [J]. Journal of Xi��an Shiyou University, 1990, 5(2): 1-6. (in Chinese) [8] LI Dao-pin. The development of the low-permeability sandstone oil field [M]. Beijing: Petroleum Industry Press, 1997: 114-152. (in Chinese) [9] TAHERI A, SAJJADIAN V A. WAG performance in a low porosity and low-permeability reservoir, Sirri-A field, Iran [C]// SPE Asia Pacific Oil & Gas Conference and Exhibition. Adelaide, Australia: 2006, SPE 100212. [10] YANG Xiao-li, HUANG Fu. Influence of strain softening and seepage on elastic and plastic solutions of circular opening in nonlinear rock masses [J]. Journal of Central South University of Technology, 2010, 17(3): 621-627. [11] LEI Qun, XIONG Wei, YUAN Jiang-ru, GAO Shu-sheng, WU Yu-shu. Behavior of flow through low-permeability reservoirs [C]// Europe/EAGE Conference and Exhibition. Rome, Italy: 2008, SPE 113144. [12] LIU Shun, HAN Feng-rui, ZHANG Kai, TANG Ze-wei. Well test interpretation model on power-law non-linear percolation pattern in low-permeability reservoir [C]// International Oil and Gas Conference and Exhibition in China. Beijing, China: 2010, SPE 132271. [13] BLASINGAME T A. The characteristics flow behavior of low-permeability reservoir systems [C]// SPE Unconventional Reservoirs Conference. Keystone, Colorado, USA: 2008, SPE 114168. [14] SHI Yu, YANG Zheng-ming, HUANG Yan-zhang. Study on non-linear seepage flow model for low-permeability reservoir [J]. Acta Petrolei Sinica, 2009, 30(5): 731-734. (in Chinese) [15] HUANG Yan-zhang. Seepage mechanism in low-permeability reservoir [M]. Beijing: Petroleum Industry Press, 1993: 80-101. (in Chinese) [16] XIONG Wei, LEI Qun, LIU Xian-gui, GAO Shu-sheng, HU Zhi-ming, XUE Hui. Pseudo threshold pressure gradient to flow for low permeability reservoirs [J]. Petroleum Exploration and Development, 2009, 36(2): 232-235. (in Chinese) [17] JI Bing-yu, WANG Chun-yan, LI Li, HE Ying-fu. Calculation method for production rate of rectangular well pattern and fracturing integration production mode in low-permeability reservoir [J]. Acta Petrolei Sinica, 2009, 30(4): 578-572. (in Chinese) [18] CHENG Shi-qing, HAN Hong-bao. Numerical simulation of two-dimensional two-phase slow flow [J]. Petroleum Exploration and Development, 1998, 25(1): 41-43. (in Chinese) [19] HAN Hong-bao, CHENG Shi-qing. Physical simulation and numerical simulation of ultra-low permeability reservoir in consideration of starting pressure gradient [J]. Journal of University of Petroleum, 2004, 28(6): 49-53. (in Chinese) [20] ZHAO Guo-zhong. Numerical simulation of 3D and three-phase flow with variable start-up pressure gradient [J]. Acta Petrolei Sinica, 2006, 27(1): 119-128. (in Chinese) [21] YUAN Yi-rang, HAN Yu-ji. Numerical simulation and application of three-dimensional oil resources migration-accumulation of fluid dynamics in porous media [J]. Science in China Series G: Physics Mechanics and Astronomy, 2008, 51(8): 1144-1163. [22] YANG Zheng-ming, YU Rong-ze, SU Zhi-xin, ZHANG Yan-feng, CUI Da-yong. Numerical simulation of the nonlinear flow in ultra-low permeability reservoirs [J]. Petroleum Exploration and Development, 2010, 37(1): 94-98. (in Chinese) [23] LONG Teng. Development of numerical simulation system for non-Darcy flow in low-permeability reservoir [D]. Beijing: Tsinghua University Department of Hydraulic and Hydropower Engineering, 2005. (in Chinese) (Edited by YANG Bing) Foundation item: Project(10672187) supported by the National Natural Science Foundation of China, Project(2008ZX05000-013-02) supported by the National Science and Technology Major Program of China Received date: 2011-04-29; Accepted date: 2011-06-30 Corresponding author: YU Rong-ze, PhD; Tel: +86-10-69213294; E-mail: yurongze2011@163.com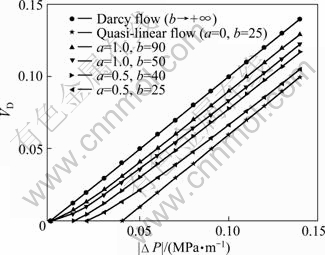
![]()
![]()
![]()
![]()
![]()
![]() is known.
is known.![]() is known.
is known.![]()
 (7)
(7)![]()

 (8)
(8)![]() (9)
(9) (10)
(10)

 (11)
(11) (12)
(12)


Abstract: A nonlinear flow reservoir mathematical model was established based on the flow characteristic of low-permeability reservoir. The well-grid equations were deduced and the dimensionless permeability coefficient was introduced to describe the permeability variation of nonlinear flow. The nonlinear flow numerical simulation program was compiled based on black-oil model. A quarter of five-spot well unit was simulated to study the effect of nonlinear flow on the exploitation of low-permeability reservoir. The comprehensive comparison and analysis of the simulation results of Darcy flow, quasi-linear flow and nonlinear flow were provided. The dimensionless permeability coefficient distribution was gained to describe the nonlinear flow degree. The result shows that compared with the results of Darcy flow, when considering nonlinear flow, the oil production is low, and production decline is rapid. The fluid flow in reservoir consumes more driving energy, which reduces the water flooding efficiency. Darcy flow model overstates the reservoir flow capability, and quasi-linear flow model overstates the reservoir flow resistance. The flow ability of the formation near the well and artificial fracture is strong while the flow ability of the formation far away from the main streamline is weak. The nonlinear flow area is much larger than that of quasi-linear flow during the fluid flow in low-permeability reservoir. The water propelling speed of nonlinear flow is greatly slower than that of Darcy flow in the vertical direction of artificial fracture, and the nonlinear flow should be taken into account in the well pattern arrangement of low-permeability reservoir.
