

J. Cent. South Univ. (2018) 25: 2567-2577
DOI: https://doi.org/10.1007/s11771-018-3936-z

Failure simulation in resistance spot-welded lap-joints using cohesive zone modeling
Mohammad Ali Saeimi SADIGH1, Gholamreza MARAMI2, Bahman PAYGOZAR2
1. Department of Mechanical Engineering, Azarbaijan Shahid Madani University, Tabriz, Iran;
2. Department of Mechanical Engineering, University of Tabriz, Tabriz, Iran
 Central South University Press and Springer-Verlag GmbH Germany, part of Springer Nature 2018
Abstract:
This paper concentrates on simulating fracture in thin walled single-lap joints connected by resistance spot-welding (RSW) process which were subjected to tensile loading. For this purpose, three sets of lap-joints with different spot configurations were tested to achieve the joints�� tensile behavior. To simulate the joints tensile behavior, firstly a 2D axisymmetric finite element (FE) model was used to calculate residual stresses induced during the welding process. Then the results were transferred to 3D models as pre-stress. In this step, cohesive zone model (CZM) technique was used to simulate fracture in the models under tensile load. Cohesive zone parameters were extracted using coach-peel and shear lap specimens. The results were employed to simulate deformation and failure in single lap spot weld samples. It has been shown that considering the residual stresses in simulating deformation and fracture load enables quite accurate predictions.
Key words:
spot-welding; fracture; residual stress; cohesive zone model (CZM)��
Cite this article as:
Mohammad Ali Saeimi SADIGH, Gholamreza MARAMI, Bahman PAYGOZAR. Failure simulation in resistance spot-welded lap-joints using cohesive zone modeling [J]. Journal of Central South University, 2018, 25(11): 2567�C2577.
DOI:https://dx.doi.org/https://doi.org/10.1007/s11771-018-3936-z1 Introduction
Many engineering structures are joined using resistance spot-wilding (RSW) procedure. It is a widely applied method of joining both similar and dissimilar materials. RSW includes localized melting in the contact region beneath electrode which supplies electric current. A comprehensive study of mechanical behavior of instruments joined by this method would enable designers to make better predictions of their response under different loading conditions. Accordingly, numerical analysis can efficiently be applied to estimate induced stresses, deformations and failure-load. Obtaining stress distribution in the components can be used to determine the locations likely to fracture. In this regard, a number of researchers have used FE based numerical methods to investigate failure behavior of these joints considering the effective welding- process parameters, such as residual stress, nugget size and welding schedule [1, 2]. It is noted that stress analysis demonstrates regions with high risk of failure but does not provide the load at which failure occurs. Therefore, suitable failure criteria in addition to stress analyses are required to predict ultimate failure load in the joints under static loads [3�C5]. Other researchers used stress analysis along with fatigue criteria to predict fatigue-life in the welded-joints subjected to varying loads. This allows making more accurate predictions of durability of the joints subjected to multi-axial stress conditions [6�C8].
It should be highlighted that the aforementioned references have used strength-based method to predict failure and they would reveal accurate results if the geometry of the joint is remained constant. In the case of a significant change in geometry, a crucial change of stress levels may occur at the joint region. This may affect average stress under which the failure occurs. In this regard, employing energy based criteria as a promising method of fracture simulation and failure-load prediction in the joints has been proposed [9]. The application of these criteria along with the strength criterion enables the analysis of the structures undergone severe plastic deformations prior to fracture. As a well-known method of fracture simulation, CZM technique with the above-mentioned capability has been successfully adopted in the field of strength prediction of the adhesively bonded joints [10, 11]. Accordingly, CAVALLI et al have been the first ones using this approach to analyze the deformation and fracture in the RSW joints [12]. They have shown that this technique can be used to predict the failure load in the RSW joints with an acceptable level of accuracy. However, they did not consider the effects of residual stresses in order to simplify the calculations.
Previous researchers ignored the effects of residual stresses in their simulations. This research accommodates the effect of residual stresses on the tensile behavior of lap-shear joints. Hence, a comprehensive analysis was undertaken to evaluate the induced residual stresses in the substrates. Then FE models with ability of fracture and plastic behavior simulation were employed to demonstrate the deformation and failure of the samples under tension and then the obtained results were verified with experimental results.
2 Experimental work
In this work, a stainless steel SUS-304 sheet with a thickness of 1 mm was chosen to fabricate specimens. The specimens were prepared in two classes of single-spot and multi-spot welds. Multi- spot welds were prepared in three different spot arrangements. Figure 1 depicts the geometry and configuration of the case studies. Welding conditions were adopted from Ref. [13] to avoid additional tests which are necessary to validate the results of the first section. First section simulated the thermo-mechanical response of the joints after accomplishment of the welding process. The welding operation was conducted using a 150 kVA-Ac pedestal type resistance welding machine using a cone-electrode with 7 mm in diameter and electrode force of 5.4 kN.
It is known that parameters of the welding process such as welding-time, welding-current and electrode force have significant impact on the overall performance of the joints [14]. Literature review shows that comprehensive studies have been accomplished to characterize the effects of these parameters on the nugget size or residual stress formation [15, 16]. Therefore, in this study, the welding process parameters were kept constant to obtain identical quality level in the specimens and therefore attempts were focused on the numerical simulation of failure in the joints. In the multi-spot welded joints, a phenomenon called shunting effect arises, which influences the quality of the spots made after the first one. This problem cannot completely be avoided in the multiple welds; however, this effect can be mitigated. In the joints with thin substrates manufactured under a high amount of electrode force this effect can be considered almost negligible [17].
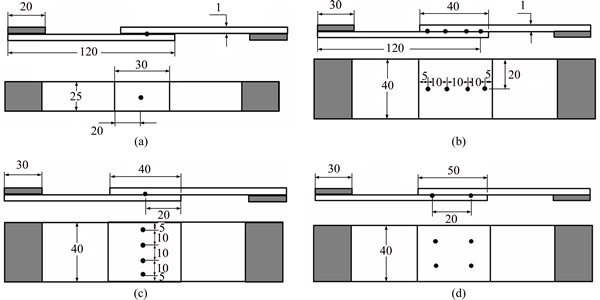
Figure 1 Geometry and configurations of case studies (Unit: mm)
Cohesive zone model (CZM) properties for the nugget were obtained experimentally based on the method fully described in Ref. [12]. In this method, two sets of specimens, including coach-peel and lap-shear were used to deduce mode I and mode II fracture properties, respectively (see Figure 2). The samples were spot-welded under the same conditions which were used to prepare the abovementioned case studies. It should be noted that the coach-peel and shear-lap joints were made from sheets of 2 mm thickness to increase the flexural rigidity of the joints and ensure mode-I and mode-II fractures. In addition, coach-peel and lap-shear samples underwent an additional thermal treatment to release the residual stresses. The samples were heat treated for 1.5 h at 375 ��C. This process was carried out to eliminate the effect of strain hardening occurring due to the thermal heating and cooling during welding procedure. Hence, the obtained CZM properties were independent of residual stress.
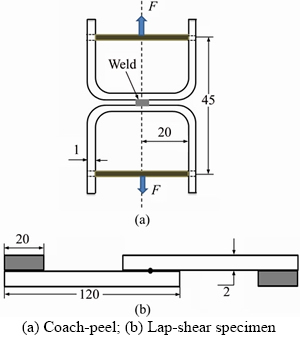
Figure 2 Geometry and dimensions (Unit: mm):
The coach-peel specimens were subjected to a tensile test to record load�Cdisplacement response. Load was measured directly using a load-cell device with the accuracy of 0.01 N. Displacements were measured using image processing technique. In this procedure, two spots were located in specific locations to capture elongations during the loading. These two spots were adjusted on the load application axis and on the plane of the nugget, center-line of the adherends edges, for the coach-peel and lap-shear specimens, respectively. A digital camera capable of recording 30 frames per second was used for the image recording purpose. The distance between the centers of the spots during elongation was measured using MATLAB software image processing tools. An inverse fitting method as fully described in Ref. [12] was employed to estimate the CZM properties.
Tensile tests were carried out using uniaxial Zwick tensile testing machine. Tests were conducted at room temperature with constant cross-head speed of 1 mm/min. The deformations and failure loads of the samples were recorded for further applications in the numerical section.
3 Modeling RSW
Passing a huge electrode current through the workpieces generates noticeable heat at the vicinity of the electrode to plate in contact region. The generated heat in the domain and contact region can be calculated by Joule��s law:
 (1)
(1)
where q is the volumetric heat; R is the electrical resistance and �� is the electrical potential.
Considering axisymmetric nature of the problem, governing equation for transient heat transfer is as follows:
 (2)
(2)
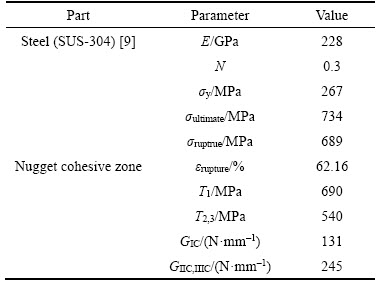
where ��, c and k are the density, the specific heat and the thermal conductivity, respectively.In this equation q can be substituted from Eq. (1). The effect of phase change in the thermal analysis was modeled by increasing the specific heat in the temperature range of the phase change. Transient heat transfer analysis was solved using FE solution and the results were incrementally defined as the initial conditions for the structural model to perform a stress�Cstrain analysis. Temperature-dependent physical and mechanical properties of the SUS-304 and copper electrode are given in Tables 1 and 2.
Temperature-dependent convection heat transfer boundary condition (h) was defined using an empirical-based equation during heating and cooling stages, which is as follows [18]:
 (3)
(3)
To reduce the calculation time, a fully-coupled two-dimensional axisymmetric FE model was generated (see Figure 3). In the analysis, contact resistance between substrates was considered to be 108 �� and also its amount between electrode and workpiece was assumed negligible.
In the FE simulation, firstly a mechanical analysis was performed to capture initial deformation of the samples during the squeezing step. The results were read as the initial conditions of the electric-thermal model. In the electric- thermal model, the temperature distributions during the welding and cooling steps were obtained. In fully coupled models, the results are exchanged in every increment between domains to incorporate mutual effects of thermal, electrical and mechanical effects.
4 Failure modeling
In the previous section, a two-dimensional model was used to calculate the residual stresses. However, to simulate failure in a spot-welded specimen subjected to a uniaxial load, adopting a three-dimensional model is required. Figure 4 shows the model consisted of two substrates meshed using C3D8R break elements and cohesive elements of type COH3D8 in the nugget region. To simulate the failure, CZM technique was employed in order to simulate the elastic region, damage initiation phase and also further damage propagation during the loading stage. The CZM simulates the elastic response and subsequent softening stages in the material, based on a relationship between stress components and relative displacements. Indeed, in this process, linear behavior up to the peak normal or shear traction and later the crack initiation and propagation stage followed by complete failure are adjusted to conform the material behavior in the connecting region. The application of a simple traction- separation law along with the placement of cohesive elements in the connecting region characterizes the elastic behavior by adopting an elastic constitutive matrix which relates the stress and strain components across the interface. In this relation, the matrix K contains the stiffness parameters of the nugget and is approximated as:
 (4)
(4)
where Knn=E, Kss=G and Kns=0; E and G are longitudinal and transverse elastic moduli.
Table 1 Physical and mechanical properties of sus-304 [19]
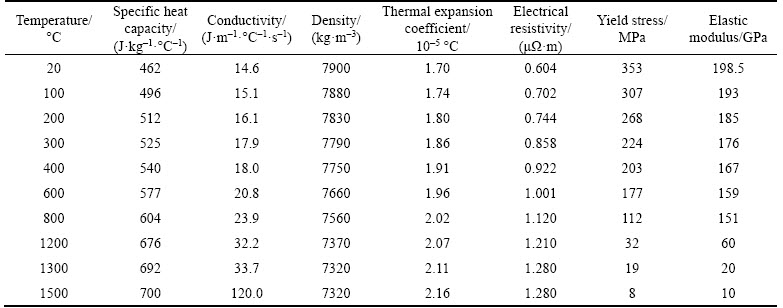
Table 2 Physical and mechanical properties of cupper electrode [19]
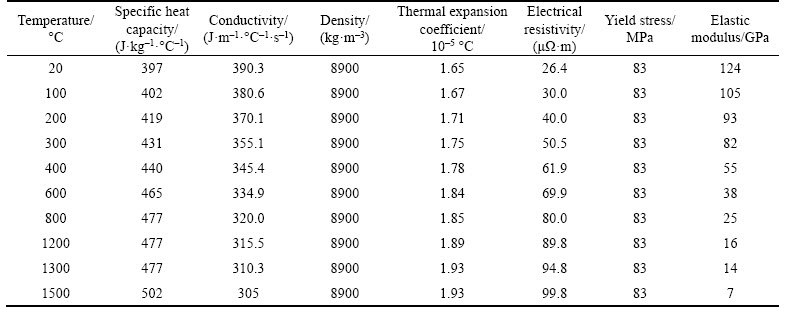
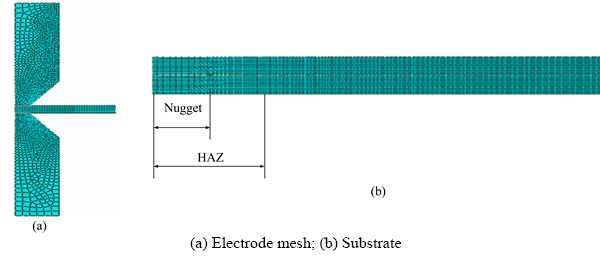
Figure 3 Two-dimensional finite element model:
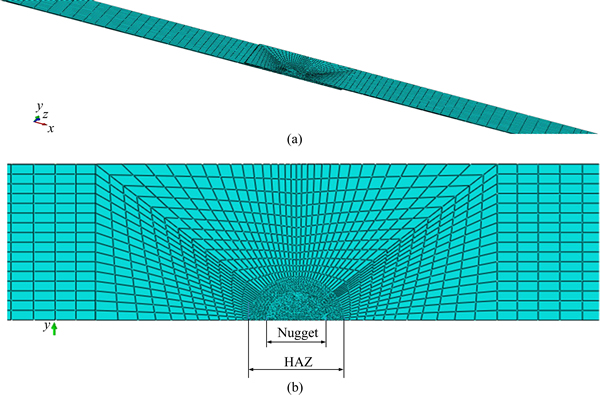
Figure 4 Three-dimensional finite element model of single-spot welded joint
The softening initiation stage is characterized by defining the maximum nominal stress criterion, in which element degradation occurs as the peel or shear traction values exceed the critical value:
 (5)
(5)
where tn and ts are the normal and shear tractions and also T1, T2 and T3 are the maximum values of tn and ts, respectively. Macaulay bracket (< >) implies that compressive stresses do not initiate damage. In the last stage, material degradation eventuates in complete failure and it means that the material no-longer endures the loading. This is characterized by a mixed-mode failure criterion which is as follows:
 (6)
(6)
In this criterion, the work is done by the traction and corresponding relative displacement in the normal and shear directions and all of them are subsequently compared to the energy release rates in each mode (GIC, GIIC and GIIIC). In the cohesive region, any element which meets the criterion is assumed to be completely failed.
Coach-peel samples were tested to obtain mode-I CZM parameters. The load�Cdisplacement curve together with an inverse fitting method was used to assess the CZM parameters. This method has been fully described in Ref. [12]. In this method, material��s maximum true tensile strength was defined as the mode-I cohesive strength (T1) of the nugget. Therefore, the best fit could be accomplished by defining mode-I toughness. Triangle traction separation law was adopted in this work to simulate damage initiation and softening stages. The area under the triangle which represents the traction separation model, corresponds to mode-I toughness (GIC). The value of GIC was achieved by trial and error method and made the best fit with the experimental data. Since the mode-I parameter of the nugget was available, mixed mode failure criterion along with experimental results of the lap-shear test was used to extract the mode-II CZM properties. In this stage, the abovementioned methodology was adopted to characterize the mode-II maximum shear cohesive strength (T2) and mode-II toughness (GIIC). It is noted that all mode-II and mode-III parameters were assumed to be equal.
5 Results and discussions
In this part, the results of finite element simulations and experiments are presented. Prior to this, the quality of the welds regarding the shunting effect in multi-spot welds was surveyed. However, as mentioned previously, to minimize this effect two measures had been taken into account [17], including the low thickness of the substrates (1 mm) and a high value of electrode force. As a justification for the safety of spots, Figure 5 shows that all spots are in the same dimension and color, with no trace of larger/darker electrode impressions.
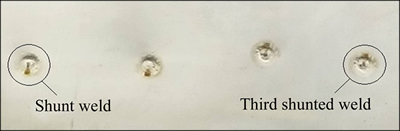
Figure 5 Safety of welding spots (almost no shunting effect)
5.1 FE results of thermal and mechanical model
It is well-known that incorporation of the electrical, thermal and mechanical effects into the simulations is essential in aid of accurate prediction of the nugget temperature and stress distribution.In fact, contact pressure as the first effective parameter determines dimensions of the contact region and it also affects the contact resistance directly in each moment of welding.
This requires applying the direct coupling to enable updating the contact condition during the analysis. Moreover, electrode force is the first cause of creating mechanical stresses in the workpiece. Second cause of creating and developing the stress is non-uniform expansion as the result of local heating of the workpiece. The mechanical stresses in this step add to the mechanical stresses generated in the squeezing step. It is noted that values of the contact pressure between electrode, workpiece and sheets�� faying surface as well as the stress distribution patterns inside the workpiece change during the welding. This is justified by non-uniform electrical resistance between the contact regions as well as non-uniform heating and cooling processes during the welding procedure. To incorporate the influence of the aforementioned factors, a coupled electro-thermo-mechanical solution was implemented to deduce thermal and mechanical results.
Figure 6 depicts temperature distribution in the workpiece. Additionally, a node in the nugget center was defined to extract temperature variation with time. This plot was obtained prior to the cooling stage at the end of the welding process. It is observed that the temperature increased to 1600 ��C in the nugget center. Also thermal analysis showed that the nugget size was 4.5 mm. These results are in agreement with the results presented in Ref. [13]. Moreover, it is observed that the maximum temperature induced in the workpiece affected the surrounding area and created a heat affected zone (HAZ) with about 8 mm in width. It is worth noting that the induced heat dissipates through conduction, convection and radiation. The dissipation rate at the commencement of cooling stage is high but it dwindles as time elapsed. The reason can be inferred by referring to the material conductivity values tabulated in Table 1 and the convection coefficient formulated by Eq. (3). It is seen that the conductivity and convection coefficients at high temperatures are meaningfully high and they decrease continuously till room temperature. These phenomena induce high stress gradient especially in the HAZ. It is worth mentioning that the mechanical stresses induced during the squeezing step and the generated thermal stresses during the heating and cooling stages are mostly higher than the material��s yield stress. Therefore, significant values of residual stresses are presented in the nugget and HAZ. The residual stress affects joints mechanical behaviors as well as fatigue life, fracture toughness, etc. Figure 7 shows von-Mises equivalent stress distribution around the HAZ in the end of the cooling stage. Furthermore, a path was defined on the workpiece surface and von-Mises stress magnitudes were extracted along the path. Residual stresses in the HAZ are induced due to the non-uniform heating and cooling.As it can be seen in this figure, higher stress levels were created in the nugget region (4.5 mm nugget size) and HAZ (approximately 8 mm). It is observed that the residual stress was reduced in the regions away from the HAZ.
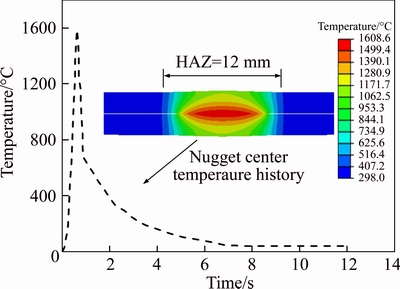
Figure 6 Temperature distribution in workpiece and temperature variation with time at nugget center
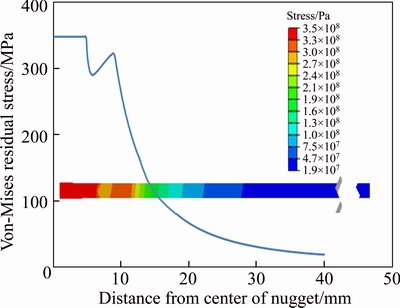
Figure 7 von-Mises stress distribution in HAZ and von-Mises stress magnitudes extracted along path on workpiece surface
It is observed that the maximum residual stress occurred at the nugget center. Moreover, radial residual stress along the path located on the surface of the workpiece was plotted against the results presented in Ref. [13] to validate the mechanical results. As can be seen in Figure 8, the results comply well with those in original study and this justifies the numerical simulations.
The residual stress values are noticeable in the HAZ but the stress values can be neglected as farther away from the center. It can be concluded,from this figure that circular region with radius of 10 mm around the nugget center includes substantial stress magnitudes which must be taken into account in simulating the joint��s behavior in the subsequent analyses.
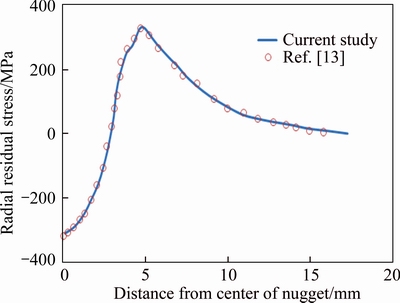
Figure 8 Radial residual stress
The results of this section signify that stress components in the HAZ cannot be neglected and must be incorporated in the fracture simulation of the samples. Due to the axisymmetric characteristic of the spot-weld, all the stress components in 10 mm distance from the nugget center were extracted from 2D model and were defined as pre-stress and applied to the corresponding nodes in the 3D model. As can be seen in Figure 4, the 3D model was partitioned by a circle with 10 mm in radius. The cylindrical area was meshed with identical mesh size to the 2D model. Therefore, the stress components obtained in 2D model were defined to the 3D model in axisymmetric manner. It is noted that the stress beyond this circular area was assumed negligible.
5.2 CZM results and model validation
This section presents model verification using samples of single-spot and multi-spot welded joints (see Figure 1). The samples were prepared under the same condition as coach-peel and shear-lap joints. However, these joints were not heat-treated to release their residual stresses. These joints were fabricated using AISI SUS-304 sheets of 1 mm thickness. The tensile tests were conducted at a crosshead rate of 1 mm/min. Finally, the samples were visually checked and no sign of crack was observed on the substrates. Hence, it was inferred that nugget failure occurred in all the samples.
Numerical calculations were carried out based on the results obtained by the especial experiments designed to deduce material characteristics. In this regard, mechanical properties were defined based on standard tensile specimen tests of SUS-304 presented in Ref. [9]. Mechanical properties were obtained through true stress�Cstrain diagram. Also, CZM parameters were characterized in the nugget region based on the coach-peel and shear-lap joint tests. Table 3 presents the material properties and nugget CZM parameters used.
Figure 9 depicts load�Celongation (p�C��) response of the joints tested using uniaxial testing machine. It is observed that the joints demonstrated a linear response, related to elastic behavior,followed by a nonlinear behavior which represents plastic deformation prior to failure. It should be noted that in this research, when a severe load drop observed in the p�C�� response, the test was stopped and the joint was assumed to be failed. Severe load drop occurred in the multi-spot joints due to the failure of one of the welds. Numerical results were superimposed in this figure to verify the calculations. A general review of the results shows that the numerical simulations can predict the joints�� behavior quite well. Furthermore, a detailed review reveals that application of CZM technique can surprisingly simulate the failure phenomenon in the joints. For instance, in Figure 9(a) (��=1 cm), a load-drop was observed in test results, owing to the commencement of a crack which relates to the maximum load carrying capacity predicted by the FE modeling. However, the subsequent hardening observed in the experiments was not modeled in the FE results. It is believed that the subsequent hardening was an outcome of fracture process zone phenomenon which has not been considered in the FE modeling. This phenomenon occurs at the crack tip due to micro cracks nucleation. The plasticity at the crack tip hinders crack propagation and causes a slight material hardening up to the complete failure. Reviewing the results of multi-spot welds reveals that FE analysis can predict the maximum load carrying capacity and the maximum elongation of the joints with high accuracy. According to the experiments, a sequential failure occurred in the multi-spot welds and it was attributed to the failure of one weld. At that point, the joints lost its primary configuration and further loading would reconfigure the joint with a new contact surface which has not been already in the contact. This process creates friction between the substrates and it causes an increase in loading, as seen in Figures 9(b) and (c), which should not be confused with material hardening. The FE modeling of this stage requires very complicated models and it is beyond the scope of this research. It is worth mentioning that during the tests, a digital camera was placed in front of the samples to record joints�� deformations. Figure 10 compares deformations of the substrates when the elongation is ��=2 cm in single spot joints and ��=1 cm in multi-spot joints. This figure indicates that application of isotropic hardening accompanied by CZM technique in FE analysis enabled accurately modeling of substrates�� deformation. Additionally, this figure shows the element failure in the nugget region. Above-mentioned element failure is indicated by SDEG values. The SDEG is a factor which demonstrates the percentage of damage in an element. More precisely, zero SDEG shows that material softening has not happened yet. However, when SDEG is equal to one, a complete failure occurs, in which the element no longer endures the loading. Figure 11 depicts von-Mises stress contours of substrates at the moment of failure. The stress values imply that stresses in the substrates never exceed the ultimate strength of the material. This is in agreement with the test results that nugget failure was observed in the all samples.
Table 3 Mechanical properties of materials
6 Conclusions
In this paper, tensile behavior of the lap-shear joints was simulated using FE models. Uniaxial tensile tests were implemented to verify the numerical results. For this purpose, electro-thermo- mechanical analysis was accomplished to evaluate the induced residual stress in substrates. Then a three-dimensional FE model was employed to simulate the deformation and failure of the samples under tension. Primary analysis to characterize the welding effects revealed that high stress gradient occurs in HAZ. Therefore, it is sufficient to extract the stress components only in this area and utilize them in the 3D models as pre-stress. Comparing the experimental and numerical results reveals that application of CZM technique in three-dimensional models enables remarkably precise prediction of the joints deformations and fracture during the loading.
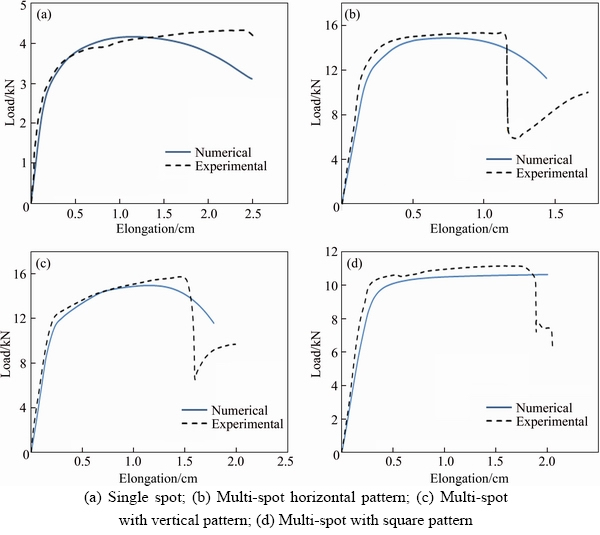
Figure 9 Load�Celongation (p�C��) response of joints:
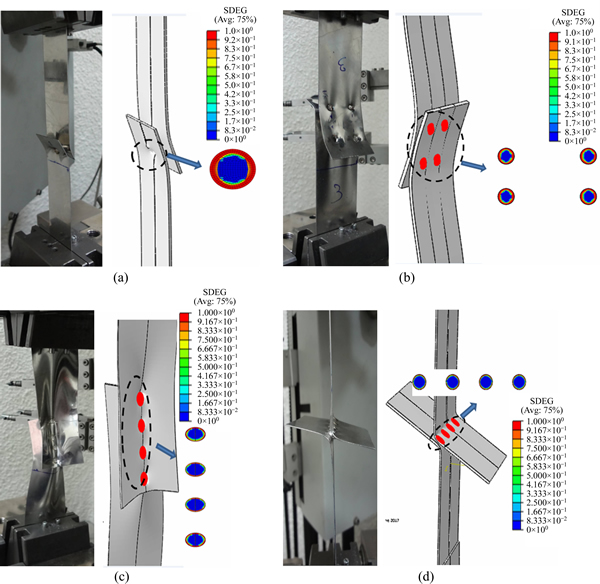
Figure 10 Deformation of joints of single spot in ��=2 cm (a), multi-spot joints in ��=1 cm with square (b), vertical (c) and horizontal pattern (d)
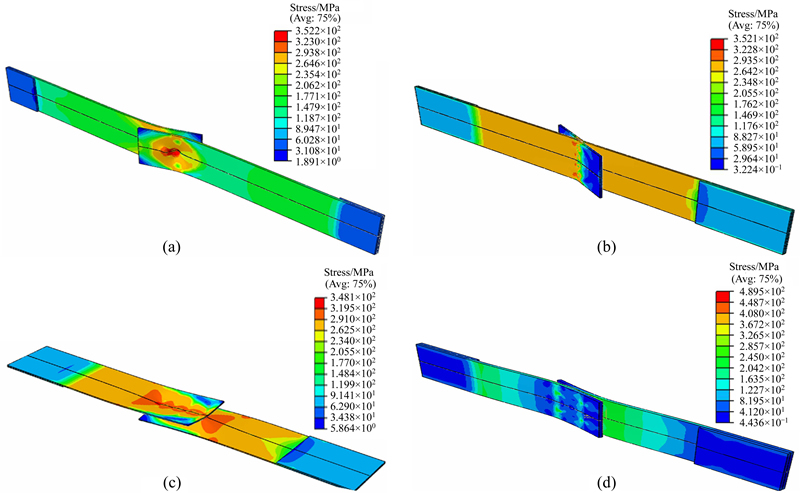
Figure 11 von-Mises stress contours of substrates for single spot (a), multi-spot with square (b), vertical (c) and horizontal pattern (d)
References
[1] ADIB H, GILGERT J, PLUVINAGE G. Fatigue life duration prediction for welded spots by volumetric method [J]. International Journal of Fatigue, 2004, 26(1): 81�C94.
[2] BRICKSTAD B, JOSEFSON B. A parametric study of residual stresses in multi-pass butt-welded stainless steel pipes [J]. International Journal of Pressure Vessels and Piping, 1998, 75(1): 11�C25.
[3] CAMPILHO R D, BANEA M D, NETO J, da SILVA L F. Modelling adhesive joints with cohesive zone models: Effect of the cohesive law shape of the adhesive layer [J]. International Journal of Adhesion and Adhesives, 2013, 44: 48�C56.
[4] CAMPILHO R D, BANEA M D, PINTO A M, da SILVA L F, de JESUS A. Strength prediction of single and double-lap joints by standard and extended finite element modelling [J]. International Journal of Adhesion and Adhesives, 2011, 31(5): 363�C372.
[5] CAVALLI M, THOULESS M, YANG Q. Cohesive-zone modelling of the deformation and fracture of spot-welded joints [J]. Fatigue & Fracture of Engineering Materials & Structures, 2005, 28(10): 861�C874.
[6] CHA B, NA S. A study on the relationship between welding conditions and residual stress of resistance spot welded 304-type stainless steels [J]. Journal of Manufacturing Systems, 2003, 22(3): 181�C189.
[7] DENG X, CHEN W, SHI G. Three-dimensional finite element analysis of the mechanical behavior of spot welds [J]. Finite Elements in Analysis and Design, 2000, 35(1): 17�C39.
[8] EISAZADEH H, HAMEDI M, HALVAEE A. New parametric study of nugget size in resistance spot welding process using finite element method [J]. Materials & Design, 2010, 31(1): 149�C157.
[9] ESMAEILI F, RAHMANI A, BARZEGAR S, AFKAR A. Prediction of fatigue life for multi-spot welded joints with different arrangements using different multiaxial fatigue criteria [J]. Materials & Design, 2015, 72: 21�C30.
[10] LIN S H, PAN J, TYAN T, PRASAD P. A general failure criterion for spot welds under combined loading conditions [J]. International Journal of Solids and Structures, 2003, 40(21): 5539�C5564.
[11] LIN S H, PAN J, WU S R, TYAN T, WUNG P. Failure loads of spot welds under combined opening and shear static loading conditions [J]. International Journal of Solids and Structures, 2002, 39(1): 19�C39.
[12] MARTIN  , de TIEDRA P, LPEZ M, SAN-JUAN M, GARCIA C, MARTIN F, BLANCO Y. Quality prediction of resistance spot welding joints of 304 austenitic stainless steel [J]. Materials & Design, 2009, 30(1): 68�C77.
[13] MOSHAYEDI H, SATTARI FAR I. Resistance spot welding and the effects of welding time and current on residual stresses [J]. Journal of Materials Processing Technology, 2014, 214(11): 2545�C2552.
[14] NODEH I R, SERAJZADEH S, KOKABI A H. Simulation of welding residual stresses in resistance spot welding, FE modeling and X-ray verification [J]. Journal of Materials Processing Technology, 2008, 205(1): 60�C69.
[15] PAKALNINS E, LU M W, MORRISSETT T W, WEHNER T J, LEE Y L. Ultimate strength of resistance spot welds subjected to combined tension and shear [J]. Journal of Testing and Evaluation, 1998, 26(3): 213�C219.
[16] PAN N, SHEPPARD S. Spot welds fatigue life prediction with cyclic strain range [J]. International Journal of Fatigue, 2002, 24(5): 519�C528.
[17] WANG B, LOU M, SHEN Q, LI Y B, ZHANG H. Shunting effect in resistance spot welding steels - Part 1: Experimental study [J]. Welding Journal, 2013, 92: 182�C189.
[18] SADIGH M A S, MARAMI G. Bearing and cleavage failure simulation of single lap bolted joint using finite element method [J]. Transactions of the Indian Institute of Metals, 2016, 69(8): 1613�C1622.
[19] SATOH T, ABE H, NISHIKAWA K, MORITA M. On three-dimensional elastic-plastic stress analysis of spot- welded joint under tensile shear load [J]. Transactions of the Japan Welding Society, 1991, 22(1): 46�C51.
(Edited by YANG Hua)
���ĵ���
����ճ����ģ�͵ĵ���㺸���ʧЧģ��
ժҪ��������Ҫ�о�����㺸��RSW�����ӱ��ڵ����ͷ�������غ������µĶ��ѹ��̡���3�鲻ͬ�ڵ�ṹ�Ĵ��ͷ�������飬�Ի�ý�ͷ���������ܡ�Ϊ��ģ�⺸�ӽ�ͷ��������Ϊ�����Ȳ��ö�ά��Գ�����Ԫģ�ͼ��㺸�ӹ����в����IJ���Ӧ����Ȼ���ת��Ϊ��άģ����ΪԤӦ�����ڴ˻����ϣ�����ճ����ģ�ͣ�CZM���������غ�������ģ���еĶ��ѽ�����ֵģ�⡣������Ƥ���ͼ��д�ӷ���ȡճ��������������ģ�ⵥ��ӵ㺸�����ı��κ�ʧЧ�Ľ����������ģ����κͶ����غ�ʱ�����Dz���Ӧ����Ӱ��Ա�֤Ԥ������ȷ���DZ�Ҫ�ġ�
�ؼ��ʣ��㺸�����ѣ�����Ӧ����ճ����
Received date: 2017-09-29; Accepted date: 2018-03-27
Corresponding author: Mohammad Ali Saeimi SADIGH, PhD, Assistant Professor; Tel: +98-4131452573; E-mail: saeimi.sadigh@ azaruniv.ac.ir; ORCID: 0000-0001-8500-4083
Abstract: This paper concentrates on simulating fracture in thin walled single-lap joints connected by resistance spot-welding (RSW) process which were subjected to tensile loading. For this purpose, three sets of lap-joints with different spot configurations were tested to achieve the joints�� tensile behavior. To simulate the joints tensile behavior, firstly a 2D axisymmetric finite element (FE) model was used to calculate residual stresses induced during the welding process. Then the results were transferred to 3D models as pre-stress. In this step, cohesive zone model (CZM) technique was used to simulate fracture in the models under tensile load. Cohesive zone parameters were extracted using coach-peel and shear lap specimens. The results were employed to simulate deformation and failure in single lap spot weld samples. It has been shown that considering the residual stresses in simulating deformation and fracture load enables quite accurate predictions.
