

J. Cent. South Univ. (2021) 28: 1342-1356
DOI: https://doi.org/10.1007/s11771-021-4704-z

Ventilation control of tunnel drilling dust based on numerical simulation
JIANG Zhong-an(���ٰ�)1, WANG Ya-peng(������)1, MEN Li-guo(������)2
1. School of Civil and Resource Engineering, University of Science and Technology Beijing,Beijing 100083, China;
2. PetroChina Southwest Pipeline Co., Ltd, Chengdu 610000, China
 Central South University Press and Springer-Verlag GmbH Germany, part of Springer Nature 2021
Abstract:
In order to control the dust pollution produced by air leg rock drill in the trolley area during the excavation of long-distance single ended tunnel, the full-scale physical model of working face was established by using FLUENT software, and the numerical simulation analysis of tunnel drilling ventilation and dust removal parameters was carried out. The results show that it is difficult to control the dust pollution of the face by conventional ventilation, and the drilling dust is distributed in the range of 10 m from the face; after the introduction of the long pressure and short suction ventilation scheme, when the ratio of compressed air volume to exhaust air volume is 0.72, the height of the pressure fan is 2.5 m, the distance between the pressure fan and the palm face is 20 m, and the exhaust fan is 12 m away from the palm, the dust concentration control efficiency of the working face is increased by about 60%. Therefore, in the similar long-distance single head tunnel construction, it is appropriate to adopt the dust removal method of long-distance short suction and exhaust fan to ensure the working environment.
Key words:
dust pollution; working environment; numerical simulation; ventilation parameters��
Cite this article as:
JIANG Zhong-an, WANG Ya-peng, MEN Li-guo. Ventilation control of tunnel drilling dust based on numerical simulation [J]. Journal of Central South University, 2021, 28(5): 1342-1356.
DOI:https://dx.doi.org/https://doi.org/10.1007/s11771-021-4704-z1 Introduction
As one of the ways to make modern construction more efficient, the drilling and blasting method is applied to tunnel construction, with higher efficiency. The most typical problem in the construction process of the drilling and blasting method is that the concentration of dust in the tunnel can reach 70 mg/m3 when the drill pipe is drilled at the same time, which seriously affects the health of the staff. In recent years, cases of silicosis caused by tunnel dust have gradually increased, even exceeding the number of coal dust diseases [1, 2]. At present stage, the research on dust concentration by domestic and foreign scholars mainly focuses on coal dust in coal mines. The dust control in coal mine mainly adopts spray dust removal and ventilation dust removal. Ventilation and dust removal technology have a wide range of applications, because of its low cost and easy operation and adjustment.
Many scholars have carried out extensive research and analysis on the distribution of coal dust and dust removal methods, and have developed reasonable dust removal methods, such as NIU et al [3], ZHANG et al [4], NIE et al [5], WANG et al [6] and JI et al [7]. The research on dust control in coal mines is relatively mature due to stricter dust control in coal mines compared to dust control in tunnels. Most studies focus more on the dust removal in the shotcrete process and less on the drilling dust in the tunnel [8, 9]. However, after the research on the construction of the metro, the visibility of the tunnel face is very low during the drilling construction of the single long-distance tunnel. Therefore, it is particularly important to study the generation and propagation of dust during the simultaneous construction of multiple boreholes and the rational application of dust-reducing equipment. Based on the study of coal mine dust law, tunnel dust also adopts the method of field measurement, numerical simulation and experimental research [10-12].
International and domestic academics have made some research on the dust of tunnel drilling. HE et al [13] proposed an innovative drilling system with a reverse circulation (RC) air hammer, in order to control the dust dispersion and improve the environmental quality of underground space while in tunnel drilling. REMPEL et al [14] proposed that the contractor should replace the pneumatic drill with the electric rotary drill to drill the structure in the concrete to reduce workers�� exposure to noise, hand vibration, and silica dust. LIU et al [15] simulated the construction ventilation of deep diversion tunnel by using Euler-Lagrange model. In order to solve the problem of construction ventilation in the extra-long tunnel under the context of drilling blasting method and trackless transportation, the construction shaft is used as an air inlet or outlet to better ventilation effect [16]. GLEHN et al [17] examined the use of mobile fan systems to ensure that fresh air is delivered to the specific areas where workers are located. The 3D unsteady quasi-single-phase models are proposed to optimize the ventilation time with different tunneling lengths [18].
The length of the single-head excavation in the submarine section of the Qingdao Metro can reach 2 km. Due to the larger tunnel section, the number of drills at the same time reaches eight people. It is found that the dust concentration at the tunnel face can reach 90 mg/m3. Taking this as the research background, the computational fluid dynamics (CFD) software is used to analyze the dust from the long-distance single-head tunnel. Based on the dust distribution characteristics obtained by simulation, an on-site dust control scheme was proposed. The scheme was applied to the site, and the dust concentration in the field was monitored in real-time to verify the rationality of the scheme and the accuracy of numerical simulation.
2 CFD simulation on dust removal
2.1 Mathematical models
To ensure the rationality of the simulated boundary conditions, a mathematical model is established according to the actual situation. Before establishing the model, the following four assumptions were made [19, 20]:
1) The air in the tunnel is idealized as an incompressible continuous fluid, and the actions of the staff do not affect the airflow distribution; 2) The temperature is not taken into account because the air temperature does not change much; 3) The dust gravity is ignored because the volume of dust particles is small and the interaction between particles is ignored; 4) The movement of dust particles in the air satisfies the three laws of mass conservation, momentum conservation, and energy conservation [21, 22].
The following model is established for the dust movement and the flow of the airflow in a complex environment according to the inherent equilibrium equation.
2.1.1 Model of airflow field
In order to analyze the diffusion of dust particles in the gas, the gas is regarded as the background fluid and the other phase is regarded as the particles distributed in the fluid. The Eulerian method is used to describe the background fluid, and the Lagrangian method is used to track the trajectory of the particle phase [23, 24]. The diffusion control equation of dust in the air is as follows:
Continuity equation of air phase:
 (1)
(1)
Momentum equation:
 (2)
(2)
where �� denotes the density of air, kg/m3; ��ij is the Reynolds stress tensor; p denotes the effective turbulence pressure, Pa; gi denotes the gravitational acceleration, m/s2; xi denotes an arbitrary component of the coordinate system composed of (x1, x2, x3), m; ui denotes an arbitrary component of the velocity vector (u1, u2, u3), m/s; Fi is particle fluid resistance, N. The control equation was then closed using the RNG k-�� turbulence model and the constraint conditions of the k-�� transport equations were added.
The k-�� transport equations can be written as [25-27]:

 (3)
(3)

 (4)
(4)
In Eqs. (3) and (4), Gk denotes the turbulent kinetic energy produced by the gradient of laminar velocity; k denotes the variation rate of turbulent kinetic energy, m2/s2; �� denotes the turbulent kinetic energy dissipation rate, m2/s3; S�� and Sk denote the source terms; �� denotes the molecular viscosity, Pa��s; ��t denote the turbulent viscosity, Pa��s, C1��, C2��, C��, ���� and ��k are the model constants with C1��=1.44, C2��=1.92, C��=0.09, ����=1.3, ��k=1.0.
2.1.2 Momentum equation of particles
Since multiple drills work simultaneously when drilling on the tunnel face, multiple dust source coupling is set to meet the practical situation. The dust has two states of laminar diffusion and turbulent diffusion in the air. When the diffusion phase is completed, the dust concentration is approximately in dynamic equilibrium. The dust concentration in the laminar flow field can be expressed as [28]:

 (5)
(5)
where D denotes the diffusion coefficient of dust particles, reflecting the size of dust particle diffusion capacity, which is inversely proportional to the dust particle size and directly proportional to the ambient temperature, m2/s; �� denotes the constant velocity of air flow, m/s; q denotes the dust mass constant per unit time.
Due to the blocking effect of the trolley, the steady-state of the continuous jet flow of the pressure fan is disturbed. When the dust produced by the borehole enters the turbulent flow field, the particle concentration can be expressed as:
 (6)
(6)
When a large amount of rock dust from the borehole diffuses to a certain part of the tunnel, the diffusion concentration follows the equation:
 (7)
(7)
When the dust is reflected by the external air current and the tunnel surface, the dust diffusion concentration of the borehole follows:
 (8)
(8)
The setting of dust field parameters in the numerical simulation is completely derived from the data detection of the field dust-producing point. The mean dust concentration difference and the mean wind speed in the upper and lower section of the dust producing source were measured respectively at the construction site. The amount of dust produced is calculated by the formula:
 (9)
(9)
where G is the dust production rate at the tunnel face, mg/s; c1 and c2 denote the dust concentrations at the downstream and upstream pints of the flow on the tunnel face, mg/m3; vg denotes the wind velocity of tunnel face; A denotes the area of the tunnel face, m2.
In order to improve the construction efficiency, it is generally required to work on multiple drills at the same time, as shown in Figures 1(a) and (b). The total dust amount at the tunnel face is the superposition of the dust amount produced by each drill hole. The calculation formula of the dust amount produced by a single drill hole can be seen from the equation of the section:
 (10)
(10)
where qd denotes dust yield per drill hole and n denotes the number of simultaneous operations of the palm surface drill.
The dust radius generated by drilling is about 0.5-21.5 ��m. The dust particles are small and the interaction forces between the particles can be ignored. The particle��s movement is divided into three processes: motion, diffusion, and free sedimentation from motion to rest. The motion of particles in the flow follows the equation:

 (11)
(11)
where dp denotes the particle diameter, m; ��g denotes the air density, kg/m3; ��p denotes the dust particle density, kg/m3; t denotes the particle motion time, s; Cd denotes aerodynamic drag coefficient; vg denotes the gas velocity, m/s; vp denotes the speed at which dust particles move, m/s; g denotes the gravity acceleration, m/s2.
As the drill will produce particles of very small size in the process of rotation, the particles will be impacted by the air flow, and the dust particles will flow along the direction of the wind current in the environment. When a particle is driven out at a certain speed by a drill hole, a constant rate of settlement is maintained when the force is balanced. The formula for calculating the constant speed is expressed as:
 (12)
(12)
where ��g denotes the aerodynamic viscosity, Pa��s.
2.2 Establishment of geometrical model
In order to achieve the effect of numerical simulation to reflect the actual situation on the site, a scaled physical model was established by SOLIDWORKS. As shown in Figure 2, the physical model consists of four sections, including an arch tunnel with a large section, a mobile drilling trolley,eight rock drill, and a pressure air duct. Among them, the dimensions of arch tunnel model are 50 m��10 m��5.5 m. The dimensions of mobile drilling trolley are 5.5 m��9.5 m, and the platform is divided into three layers, the height of the first layer is 1.9 m and that of the second layer is 1.8 m. The model of air leg rock drill is YT28, with body length of 661 mm and cylinder diameter of 80 mm. When drilling, the trolley is close to the face of the tunnel face, and there are drilling workers in each part. The trolley can realize eight-people drilling at the same time without any influence. As the tunnel is ventilated for a long distance, the rigid air duct is not convenient to use, so the flexible air duct is adopted.
The tunnel adopts forced ventilation, and flexible air ducts are used for convenient installation and transportation. The fan uses a low-noise axial flow fan (SFG4-4R) with an air volume of 5300 m3/h. Since the single-head excavation cannot form a complete ventilation loop, the compressive ventilator extends from the tunnel mouth to the palm face. The duct is tightly laid on the left side of the tunnel with a diameter of 0.8 m. It is very important to protect the ventilation equipment during blasting, and the equipment installation must conform to the safe distance of blasting (the safe distance of blasting flying stones). According to the safety regulations of blasting, the safety distance of blasting vibration rocks is expressed as follows:
 (13)
(13)
where Rf denotes the safe distance to blast the flying stones, m; n denotes blasting index; W denotes minimum burden, m; K denotes coefficients related to rock properties, topography and geological meteorology (values in 1.0-1.5).
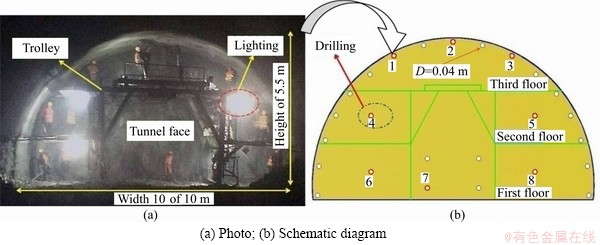
Figure 1 Drilling conditions of tunnel face:
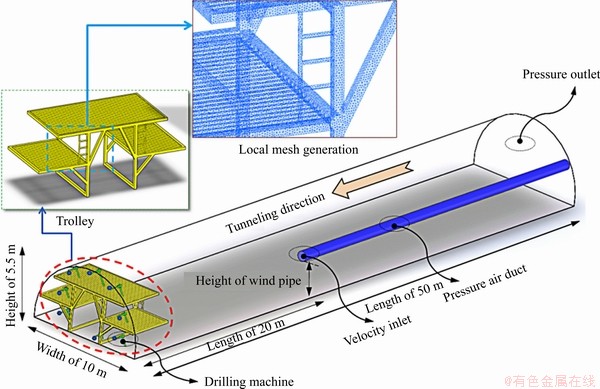
Figure 2 Established physical models
According to the above formula, the optimal distance between the air duct mouth and the tunnel face is at least 20 m, which ensures the safety of the air duct. The direction of tunnel axis pointing to tunnel face is the positive direction of the z-axis, the direction of vertical axis pointing to the vault is positive y-axis and the vertical tunnel axis pointing to the left is positive x-axis. The model establishment is shown in Figure 2.
2.3 Boundary conditions and parameter settings
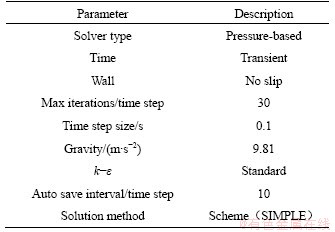
After the model is established with SOLIDWORKS, it is saved as .x_t format text and then imported to ICEM software for meshing. Due to the complexity of the trolley structure, it is difficult to use structural grid division, so the tetrahedron grid division is adopted without affecting the calculation accuracy. As shown in Table 1, the boundary conditions of the physical model are VELOCITY_INLET, PRESSURE_ OUTLET, and WALL. The fan is set to VELOCITY_INLET. The roadway rear outflow has a boundary type of PRESSURE_OUTLET. In the process of drilling, multiple points produce dust at the same time, so multiple source rock dust points are set on the tunnel face, and the boundary of source dust point is dust.
According to experience, the dust concentration at the trolley is detected after several changes in the air volume. It can be seen that when the pressure air volume is 440 m3/min, the dust concentration at the tunnel face is the lowest, and the wind speed at the open of the duct is 14.5 m/s. Formula (9) was adopted to calculate the dust mass flow rate of 0.2 g/s.
Table 1 Major parameters in numerical simulations
Rosin-Rammler distribution function was used to describe the distribution of dust particle size, with a distribution index of 1.93. The particle size has a minimum value of 2.0��10-6 m, a maximum of 1.0��10-4 m and a median of 1.2��10-5 m.
2.4 Verify rationality of numerical simulation
The rationality of grid division directly affects the accuracy of analysis results. As shown in Figure 3, the tetrahedron grid is used to mesh the computational domain of the model. The evaluation of meshing quality is mainly analyzed from two aspects: horizontal and vertical ratio of elements and flattening degree. The mesh evaluation results are shown in Figure 4.
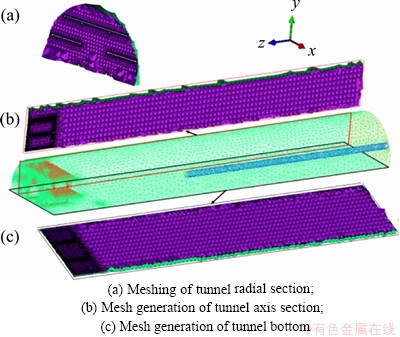
Figure 3 Mesh of physical model:
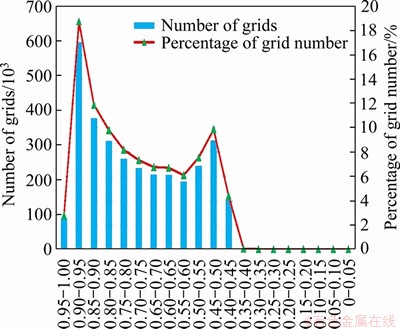
Figure 4 Variation of mesh quality with mesh numbers
In total 3190359 grids, meshes were acquired. According to the histogram, the mesh qualities have a minimum value of 0.29, a maximum of 0.99, and an average of 0.73. The mesh qualities satisfied the simulation requirements. To verify the accuracy of the simulation data, the variation of dust concentration and wind velocity in the axial direction of the tunnel are extracted and verified with the field measured data. Along the central axis of the tunnel, a dust concentration monitoring point is arranged every 5 m starting from the pressure vent. Meanwhile, a wind speed monitoring surface (denoted as ��) is set at 5 m from the tunnel face. Five monitoring points are arranged on the detection surface according to the upper, middle and lower three parts respectively. Five points for dust concentration measurement, A (0 m, 0 m, 20 m), B (0 m, 0 m, 15 m), C (0 m, 0 m, 10 m), D (0 m, 0 m, 5 m), and E (0 m, 0 m, 0 m), are set at each measured cross-section, as shown in Figure 5.
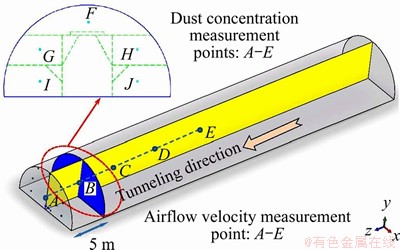
Figure 5 Diagram of measurement point arrangement
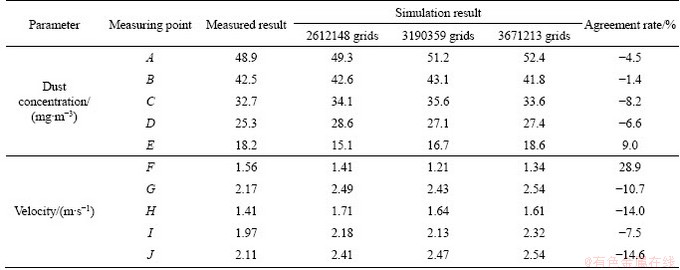
According to the arrangement of measuring points in the model, the field measured and simulation results of dust concentration were extracted respectively. The monitoring section of wind speed is located in the trolley, which can reflect the law of airflow change affected by the trolley. Numerical simulation software was used to extract airflow velocity values at five positions of the corresponding detection points A, B, C, E and D. The airflow velocity meter is also used in the construction site to measure the wind speed at the corresponding point. At the same time, in order to verify the independence of the grid, we divided 2612148 and 3671213 grids on the basis of 3190359 grids; the wind speed and dust concentration at the above measuring points were extracted. Table 2 illustrates the measured results and simulation results of dust diffusion and airflow velocity variation. It can be seen from Table 2 that the three simulation results have little difference, the grid has little influence on the calculation results, and the grid quality meets the requirements; At the same time, comparing the calculation results of the grid number 3190359 with the field measurement results, we can see that the overall error is small, which meets the requirements of field analysis.
2.5 Analysis of press-in ventilation and dust removal
Many parameters affect the removing dust ability of the fan. The parameters that directly affect the ability to discharge dust include the power of the fan, the height of air duct laying and the distance of air outlets. When the distance from the vents to the tunnel face and the amount of air pressure are determined, the height of the windpipe is particularly important. Due to the trolley in the tunnel face, it can guide the airflow to a certain extent. The airflow is sent to the tunnel face at different heights of the windpipe, and the path of dust removal is different at the tunnel face [29]. To study the influencing factors, models of 2.5 m (��), 1.9 m (��) and 1 m (��) were established respectively. According to the height of the wind tube, set the level dust concentration detection surfaces of 1.9 m (H1), 0.5 m (H2) and -1.9 m (H3) as the reference, and the dust concentration distribution cloud map is shown in Figure 6.
Table 2 Measured and simulation results of velocity and dust concentration
Figures 6(b) and (c) illustrate that the concentration of dust in most areas has been controlled below 4.2��10-5 kg/m3, and the concentration of dust at the trolley range of model �� has been reduced to 1.4��10-5 kg/m3, which has better protection for the drilling workers. However, there is still a dust concentration area in the upper left corner (lower right corner of the tunnel face), and the dust concentration reaches above 7.0��10-5 kg/m3. In addition, from the dust settlement area at the right end of the two dust concentration diagrams, it can be seen that the concentration of suspended dust in the air has been reduced to below 7.0��10-6 kg/m3 when the dust diffuses to about 30 m away from the trolley, and the air quality of the roadway is no longer affected. In Figure 6(d), the dust concentration near the ground is significantly larger than Figures 6(b) and (c), but the dust concentration at the tunnel face of models �� and �� is still relatively low. It is inferred that the concentration of dust in the near-trolley range is gradually increased from the concentration of the vault to the ground, and the range is 0-7.0��10-5 kg/m3. Model �� not only ensures that the dust concentration in the trolley is low but also controls the diffusion of the dust to model �� a certain extent.
By comparing and analyzing the dust concentration cloud maps of different models, it is found that when the wind tube is set up on the second floor of the trolley (height is set up at 2.5 m), the best dust emission can be achieved by trolley effect on airflow. However, there are still some limitations in single-press ventilation.Figures 7 and 8 respectively show the airflow streamlines and velocity cloud map in the numerical simulation tunnel. It can be seen that the airflow direction becomes more complicated after passing through the drilling platform. By comparing the part marked in the red block in Figures 7 and 8, it is found that there are eddy currents in both horizontal and vertical directions between the rear end of the trolley and the air duct mouth within 16 m.
As shown in Figure 9, dust concentration in vortex flow area and small wind speed zone is relatively high and the workers in the area are greatly endangered by the dust. The change of dust concentration is consistent with the analysis of airflow velocity in Figure 8. The presence of an eddy current is the main cause of dust accumulation. In addition to dust concentration caused by eddy current field, when drilling and blasting method is applied, a certain safety distance is required from the air duct mouth to the palm surface, which also weakens the dust emission capacity of wind current.
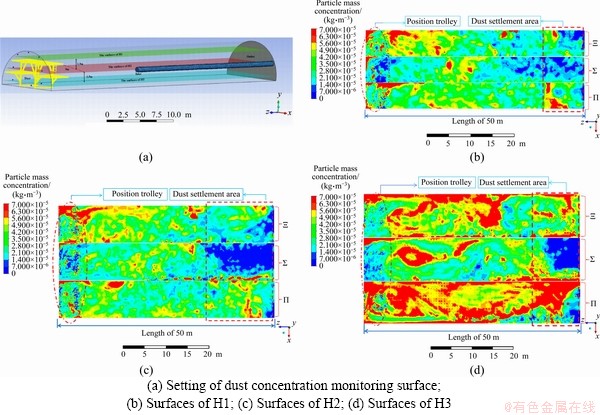
Figure 6 Contrast of dust concentration at three horizontal heights:
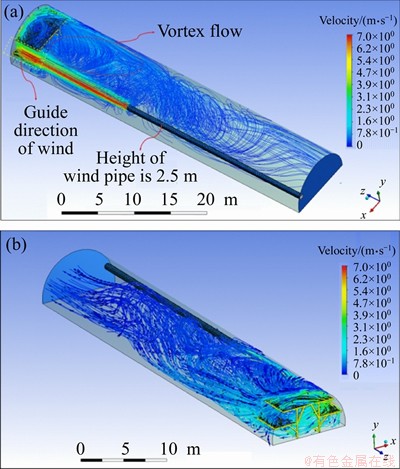
Figure 7 Airflow (a) and vector (b) streamlines in tunnel
3 Forced ventilation and fan work together to remove dust
At present, the blasting excavation of tunnels mostly adopts the operation mode of simultaneous drilling by many people, as shown in Figure 6(a). After the above simulation analysis and the field monitoring, it can be seen that the single forced ventilation cannot improve the air condition of the tunnel face. The dust has been in a diffused state in the 20 m range of tunnel face, and workers with high concentration are seriously damaged by rock dust. In order to increase the airflow at the tunnel face, a fan is added within a certain distance from the tunnel face. But fans only give the impression that the air flows faster and the dust is not embodiment. In order to better control the dust produced by drilling, the ventilation mode of pressure and extraction is put forward.
3.1 Pressure ventilation combined with fan for dust removal
Based on the pressure ventilation, the ventilation model (defined as ��) of the dust removal of the local fan combined with the pressure ventilation is established according to the placement position of the on-site fan. The local fan is set as the VELOCITY_INLET and the wind speed is 4.5 m/s. Airflow vectors of different sections are obtained through simulation, as shown in Figure 10. It can be seen from the third surface (Figure 10) that the wind speed drops below 1.75 m/s at a distance of 8 m from the air outlet. The presence of a local fan increases the wind speed at the tunnel face and reducing the dust concentration in the trolley to the greatest extent.
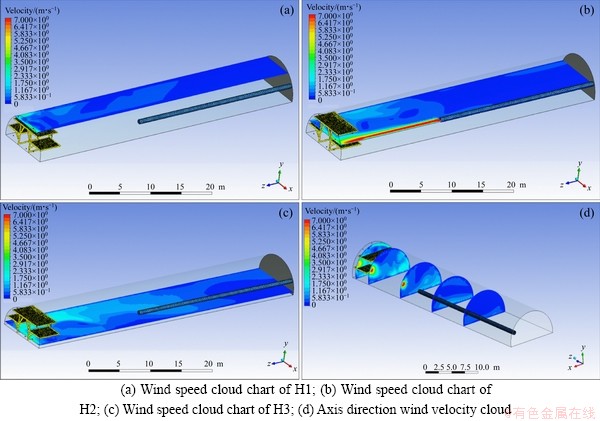
Figure 8 Simulation results of wind speed variation:
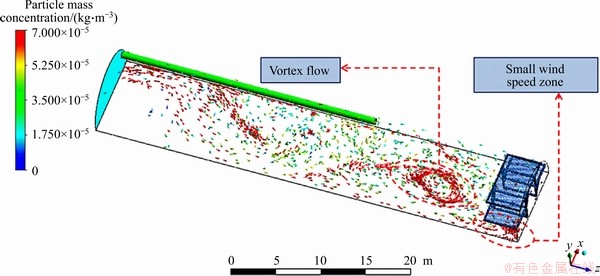
Figure 9 Simulation results of particle mass concentration
By comparing tunnel parallel to the three different height of the dust cloud on the ground shown in Figures 11 (model ��) and 6 (model ��), it can be seen that the dust concentration in about 85% of the area on the plane H2 decreased to less than 7.0��10-6 kg/m3. With the increase of the local fan, the dust concentration in the working area is reduced by 80%. Although the working environment at the tunnel face is largely guaranteed, the problem of the dead angle that the airflow cannot reach is still not completely solved. The dust is still transported in the tunnel under the effect of wind current, and the area with a concentration greater than 1.4��10-5 kg/m3 can spread to a range of 5-40 m from the tunnel face.
3.2 Long-compression short-suction combined dust removal
In order to completely solve the problem of high dust concentration in the lower right corner of the tunnel face and dust diffusion in the tunnel, the mine extraction dust removal fan was introduced into the tunnel construction to convert the dust discharge into dust removal [30, 31]. Based on Figure 6(a), movable dust removal fans are set along the right side of the tunnel. The boundary conditions of the dust removal fans are the same as that of the pressed fan. According to LIU��s [32] research on ventilation parameters of suction and pressure in roadway, the inlet boundary wind speed is set to be -20 m/s, the height of dust removal fan is 1.7 m, the diameter of the air duct is 0.8 m, and the distance between the air duct mouth and the tunnel face is 10 m. It can be seen from Figure 12 that the dust accumulation area at the tunnel edge and corner under the single pressed ventilation mode is improved by adding the exhaust ventilation fan. The dust concentration drops below 1.75��10-5 kg/m3 at the distance of L1 from the boundary of the model when there is a dust removal fan. On the contrary, if there is no dust removal fan, the distance is L2. Obviously, L1 is greater than L2.
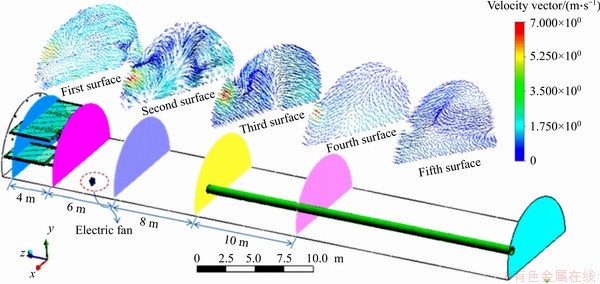
Figure 10 Simulation results of velocity vector
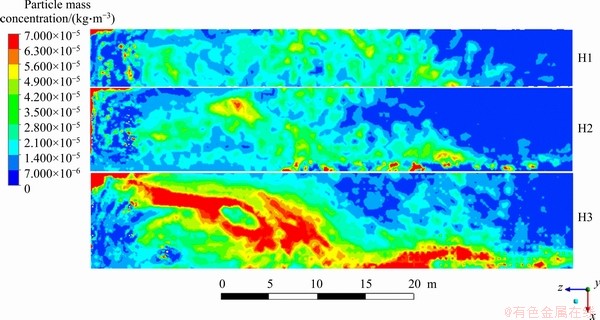
Figure 11 Simulation results of dust concentration
3.3 Parameter optimization in optimal ventilation mode
When the dust removal fan exists, a new dust accumulation area appears in the tunnel vault, which is not conducive to the occupational safety of the worker, as shown in Figure 12. In order to solve this problem, four comparative models were established based on the S=10 m (Dust removal fan inlet distance from palm surface denoted as S), and S was 6, 8, 12 and 15 m. According to the height of points F, G, H, I and J in Figure 5, five straight lines with a length of 14 m are set along the direction of tunnel axis (the negative direction of z-axis) starting from the tunnel face, as shown in Figure 13. Extract the change in dust concentration in the range of the line, as shown in Figure 14.
The blue shading part of the above graph is the trolley area within 5 m from the tunnel face. From the dust concentration variation curve of different locations, it can be seen that the dust concentration in the blue region is all less than 4.0��10-6 kg/m3. Among them, the overall concentration of I and J dust is well controlled, and the dust is maintained in a low concentration range. It is related to the increase of local fan at point I and the setting of dust removal fan at point J, and the curve analysis is consistent with the actual situation. Through the comparison of the four newly established numerical models, it is found that the problem of dust reagglomeration in Figure 14 can be solved when the dust removal fan is 12 m away from the tunnel face. Moreover, by analyzing the other four figures, it can be seen that the layout of the dust removal fan 12 m away from the tunnel face is the most reasonable, and the concentration of dust is relatively the lowest at each detection location. At the same time, the dust concentration was stable within the 14 m distance from the tunnel face.
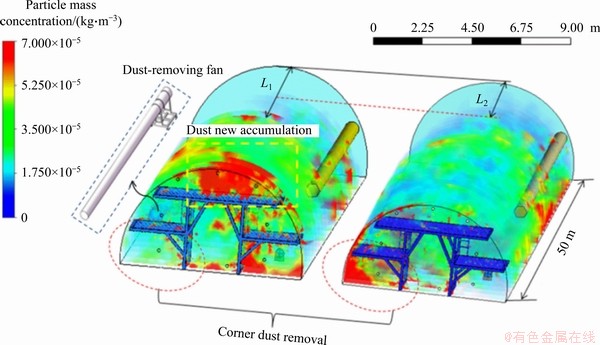
Figure 12 Contrast of dust volume cloud concentration in tunnel
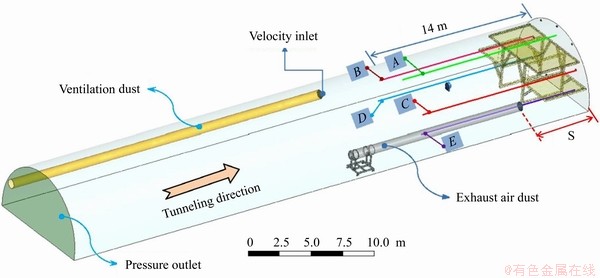
Figure 13 Dust concentration extraction line
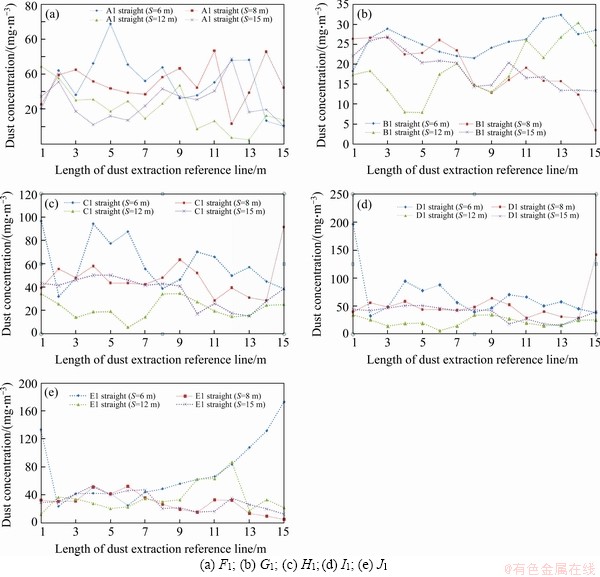
Figure 14 Dust concentration change curve under different points:
4 Field applications
At the site of the metro tunnel, the current dust concentration is about 30 mg/m3 after the drilling workers in each part work in parallel for a period of time. According to the above research results, set the height at the left side of the tunnel face to about 1.5 m, and set the extraction air volume at 580 m3/min. After ventilation for a period of time, imagine a plane parallel to the tunnel face at the position of 2 m away from the tunnel face, and set five monitoring points as shown in Figure 5. The results of dust detection are shown in Table 3. Site ventilation is shown in Figure 14.
5 Conclusions
Airflow migration simulation shows that the trolley affects the concentration of air dilution dust in air flow. Using the two-phase flow DPM model, numerical simulation analysis is conducted on the ventilation in the drilling site. It is found that it is reasonable and feasible to control the dust in the tunnel with local fans and to introduce the dust removal fan of coal mine into the long-distance single-head tunnel face. The dust concentration in the tunnel face is reduced to less than 2.0��10-6 kg/m3, and the dust removal efficiency is improved by about 60%.
Through the calculation and analysis of the safe distance of blasting, the distance between the press-in fan and the tunnel face is set as no less than 20 m. The local fan is set up to maintain the wind speed at the tunnel face within the range of 0.50-1.75 m/s, ensuring the directional movement of dust along with the wind current. By comparing the distance between the dust removal fan and the tunnel face, it is concluded that the optimal dust collector distance is about S=12 m, and the optimal height of the pressed air duct is 2.5 m.
Table 3 Results of dust detection
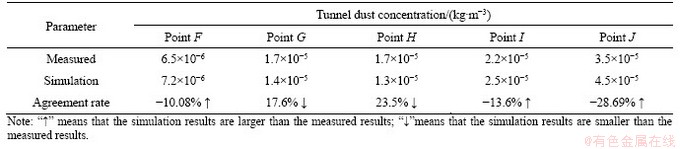
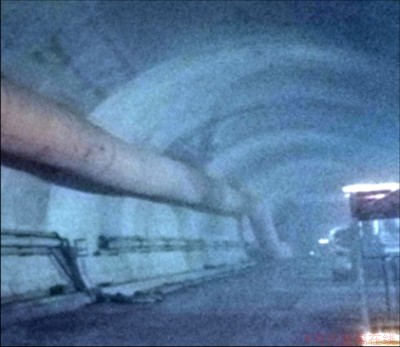
Figure 15 Ventilation of tunnel construction site
Contributors
WANG Ya-peng conducted the literature review and wrote the first draft of the manuscript. JIANG Zhong-an provided the concept and MEN Li-guo analyzed the measured data.
Conflict of interest
WANG Ya-peng, JIANG Zhong-an and MEN Li-guo declare that they have no conflict of interest.
References
[1] ABBEY D E, NISHINO N, MCDONNELL W F, BURCHETTE R J, KNUTSEN S F, LAWRENCE B W, YANG J X. Long-term inhalable particles and other air pollutants related to mortality in nonsmokers [J]. American Journal of Respiratory and Critical Care Medicine, 1999, 159(2): 373-382. DOI: 10.1164/ajrccm.159.2.9806020.
[2] ZHENG Y P, FENG C G, JING G X, QIAN X M, LI X J, LIU Z Y, HUANG P. A statistical analysis of coal mine accidents caused by coal dust explosions in China [J]. Journal of Loss Prevention in the Process Industries, 2009, 22(4): 528-532. DOI: 10.1016/j.jlp.2009.02.010.
[3] NIU W, JIANG Z A, TIAN D M. Numerical simulation of the factors influencing dust in drilling tunnels: its application [J]. Mining Science and Technology, 2011, 21(1): 11-15. DOI: 10.1016/j.mstc.2010.12.009. (in Chinese)
[4] ZHANG Q, ZHOU G, QIAN X M, YUAN M Q, SUN Y L, WANG D. Diffuse pollution characteristics of respirable dust in fully-mechanized mining face under various velocities based on CFD investigation [J]. Journal of Cleaner Production, 2018, 184: 239-250. DOI: 10.1016/j.jclepro. 2018.02.230.
[5] NIE W, WEI W L, MA X, LIU Y H, PENG H T, LIU Q. The effects of ventilation parameters on the migration behaviors of head-on dusts in the heading face [J]. Tunnelling and Underground Space Technology, 2017, 70: 400-408. DOI: 10.1016/j.tust.2017.09.017.
[6] WANG Xiao-zhen, JIANG Zhong-an, WANG Shan-wen, LIU Yi. Numerical simulation of distribution regularities of dust concentration during the ventilation process of coal roadway driving [J]. Journal of China Coal Society, 2007, 32(4): 386-390. DOI: 10.1016/S1872-2067(07)60020-5. (in Chinese)
[7] JI Y L, REN T, WYNNE P, WAN Z J, MA Z Y, WANG Z M. A comparative study of dust control practices in Chinese and Australian longwall coal mines [J]. International Journal of Mining Science and Technology, 2016, 26(2): 199-208. DOI: 10.1016/j.ijmst.2015.12.004.
[8] CHEN L J, LI P C, LIU G M, CHENG W M, LIU Z X. Development of cement dust suppression technology during shotcrete in mine of China-A review [J]. Journal of Loss Prevention in the Process Industries, 2018, 28(55): 232-242. DOI: 10.1016/ j.jlp.2018.07.001.
[9] FANG Y, YAO Z G, LEI S. Air flow and gas dispersion in the forced ventilation of a road tunnel during construction [J]. Underground Space, 2019, 4(2): 168-179. DOI: 10.1016/ j.undsp.2018.07.002.
[10] REN T, ZHANG J, WEI J P. Applications of water infusion for dust control in underground coal mines��A critical review [C]// Proceedings of the 11th International Mine Ventilation Congress. 2018: 219-230. DOI: 10.1007/978- 981-13-1420- 9_19.
[11] ZHOU G, ZHANG Q, BAI R N, FAN T, WANG G. The diffusion behavior law of respirable dust at fully mechanized caving face in coal mine: CFD numerical simulation and engineering application [J]. Process Safety and Environmental Protection, 2017, 106: 117-128. DOI: 10.1016/j.psep.2016.12.005.
[12] ZHOU G, FENG B, YIN W J, WANG J Y. Numerical simulations on airflow-dust diffusion rules with the use of coal cutter dust removal fans and related engineering applications in a fully-mechanized coal mining face [J]. Powder Technology, 2018, 339: 354-367. DOI: 10.1016/ j.powtec.2018.07.078.
[13] HE J F, SUN B X, LIANG Y P, LUO Y J. Research on suction capacity and dust suppression performance of a reverse circulation air hammer in tunnel drilling [J]. Tunnelling and Underground Space Technology, 2018, 71: 391-402. DOI: 10.1016/j.tust.2017.09.008.
[14] REMPEL D, ANTONUCCI A, BARR A, COOPER M R, MARTIN B, NEITZEL R L. Pneumatic rock drill vs. electric rotary hammer drill: Productivity, vibration, dust, and noise when drilling into concrete [J]. Applied Ergonomics, 2019, 74: 31-36. DOI: 10.1016/j.apergo.2018.08.005.
[15] LIU Z, WANG X L, CHENG Z F, SUN R R, ZHANG A L. Simulation of construction ventilation in deep diversion tunnels using Euler�CLagrange method [J]. Computers & Fluids, 2014, 105: 28-38. DOI: 10.1016/j.compfluid. 2014.09.016.
[16] ZHANG H, SUN J C, LIN F, WANG L. Optimization on energy saving ventilation of gallery-type combined construction shaft exhaust in extra long tunnel [J]. Procedia Engineering, 2017, 205: 1777-1784. DOI: 10.1016/j.proeng. 2017.10.030
[17] von GLEHN F H, BLUHM S J. Practical aspects of the ventilation of high-speed developing tunnels in hot working environments [J]. Tunnelling and Underground Space Technology, 2000, 15(4): 471-475. DOI: 10.1016/S0886- 7798(01)00016-5.
[18] WANG X L, LIU X P, SUN Y F, AN J, ZHANG J, CHEN H C. Construction schedule simulation of a diversion tunnel based on the optimized ventilation time [J]. Journal of Hazardous Materials, 2009, 165(1-3): 933-943. DOI: 10.1016/ j.jhazmat.2008.10.115.
[19] YU H M, CHENG W M, WU L R, WANG H, XIE Y. Mechanisms of dust diffuse pollution under forced-exhaust ventilation in fully-mechanized excavation faces by CFD-DEM [J]. Powder Technology, 2017, 317: 31-47. DOI: 10.1016/j.powtec.2017. 04.045.
[20] CAI P, NIE W L, HUA Y, WEI W L, JIN H. Diffusion and pollution of multi-source dusts in a fully mechanized coal face [J]. Process Safety and Environmental Protection, 2018, 118: 93-105. DOI: 10.1016/j.psep.2018.06.011.
[21] REN T, WANG Z W, COOPER G. CFD modelling of ventilation and dust flow behaviour above an underground bin and the design of an innovative dust mitigation system [J]. Tunnelling and Underground Space Technology, 2014, 41: 241-254. DOI: 10.1016/j.tust.2014.01.002.
[22] WANG Y P, JIANG Z A, CHEN J S, CHEN J H, WANG M. Study of high-pressure air curtain and combined dedusting of gas water spray in multilevel ore pass based on CFD-DEM [J]. Advanced Powder Technology, 2019, 30(9): 1789-1804. DOI: 10.1016/j.apt.2019.05.019.
[23] HU S Y, FENG G R, REN X Y, XU G, CHANG P, WANG Z, ZHANG Y T, LI Z, GAO Q. Numerical study of gas�Csolid two-phase flow in a coal roadway after blasting [J]. Advanced Powder Technology, 2016, 27(4): 1607-1617. DOI: 10.1016/j.apt.2016.05.024.
[24] CHEN X L, WHEELER C A, DONOHUE T J, MCLEAN R, ROBERTS A W. Evaluation of dust emissions from conveyor transfer chutes using experimental and CFD simulation [J]. International Journal of Mineral Processing, 2012, 110: 101-108. DOI: 10.1016/j.minpro.2012.04.008.
[25] HUA Y, NIE W, WEI W L, LIU Q, LIU Y H, PENG H T. Research on multi-radial swirling flow for optimal control of dust dispersion and pollution at a fully mechanized tunnelling face [J]. Tunnelling and Underground Space Technology, 2018, 79: 293-303. DOI: 10.1016/j.tust.2018.05.018.
[26] MA Z F, DAI H H. 3CFD numerical simulation of improving airflow state in upcast corner of coalface by spinning and direct airflow ventilation [J]. Journal of China Coal Society, 2008, 33(11): 1279-1282. DOI: 10.1016/S1872- 5791(08)60057-3.
[27] TASCON A, AGUADO P J. CFD simulations to study parameters affecting dust explosion venting in silos [J]. Powder Technology, 2015, 272: 132-141. DOI: 10.1016/ j.powtec.2014.11.031.
[28] ZHANG Hui. Study on dust production mechanism and dust control technology of dry drilling in coal lane [D]. Xiangtan: Hunan University of Science and Technology, 2017. (in Chinese)
[29] LEE D K. A computational flow analysis for choosing the diameter and position of an air duct in a working face [J]. Journal of Mining Science, 2011, 47(5): 664-674. DOI: 10.1134/S1062739147050169.
[30] SU S, CHEN H W, TEAKLE P, XUE S. Characteristics of coal mine ventilation air flows [J]. Journal of Environmental Management, 2008, 86(1): 44-62. DOI: 10.1016/j.jenvman. 2006.11.025.
[31] WALLACE K, PROSSER B, STINNETTE J D. The practice of mine ventilation engineering [J]. International Journal of Mining Science and Technology, 2015, 25(2): 165-169. DOI: 10.1016/j.ijmst.2015.02.001.
[32] LIU Q, NIE W, HUA Y, PENG H T, LIU C Q, WEI C H. Research on tunnel ventilation systems: Dust diffusion and pollution behaviour by air curtains based on CFD technology and field measurement [J]. Building and Environment, 2019, 147: 444-460. DOI: 10.1016/j.buildenv.2018.08.061.
(Edited by FANG Jing-hua)
���ĵ���
������ֵģ���������۳���ͨ������о�
ժҪ��Ϊ���Ƴ������ͷ�������������̨�����������һ������ķ۳���Ⱦ������Fluent���������˹�����ȫ�ߴ缸��ģ�ͣ����������ͨ�����������������ֵģ�������������������ó���ͨ�緽ʽ�����ѿ���������۳���Ⱦ����۳��鲼�ھ�������10 m��Χ�ڣ����볤ѹ�̳�ʽͨ�緽������ѹ�������ŷ���֮��Ϊ0.72��ѹ����߶���Ϊ2.5 m��ѹ�����������20 m���ŷ��������12 mʱ���������湤��ʱ�ķ۳�Ũ�ȿ���Ч�����Լ60%����ˣ������Ƴ�����Ķ�ͷ����ʩ���У��˲��ó�ѹ�̳鼰�ŷ�����ϵij�����ʽ���Ա�֤���õĹ���������
�ؼ��ʣ��۳���Ⱦ��������������ֵģ�⣻ͨ�����
Foundation item: Project(51874016) supported by the National Natural Science Foundation of China
Received date: 2020-05-13; Accepted date: 2020-09-28
Corresponding author: JIANG Zhong-an, PhD, Professor; Tel: +86-13661058581; E-mail: jza1963@263.net; ORCID: https://orcid.org/ 0000-0001-9733-8662
Abstract: In order to control the dust pollution produced by air leg rock drill in the trolley area during the excavation of long-distance single ended tunnel, the full-scale physical model of working face was established by using FLUENT software, and the numerical simulation analysis of tunnel drilling ventilation and dust removal parameters was carried out. The results show that it is difficult to control the dust pollution of the face by conventional ventilation, and the drilling dust is distributed in the range of 10 m from the face; after the introduction of the long pressure and short suction ventilation scheme, when the ratio of compressed air volume to exhaust air volume is 0.72, the height of the pressure fan is 2.5 m, the distance between the pressure fan and the palm face is 20 m, and the exhaust fan is 12 m away from the palm, the dust concentration control efficiency of the working face is increased by about 60%. Therefore, in the similar long-distance single head tunnel construction, it is appropriate to adopt the dust removal method of long-distance short suction and exhaust fan to ensure the working environment.
