
J. Cent. South Univ. (2012) 19: 586-592
DOI: 10.1007/s11771-012-1043-0![]()
Effects of real-time traffic information systems on traffic performance under different network structures
YAO Xue-heng(Ҧѧ��)1, 2, F. Benjamin ZHAN2, LU Yong-mei(¬ӽ÷)2, YANG Min-hua(������)1
1. School of Geosciences and Info-Physics, Central South University, Changsha 410075, China;
2. Texas Center for Geographic Information Science, Department of Geography,
Texas State University-San Marcos, San Marcos 78666 21, USA
? Central South University Press and Springer-Verlag Berlin Heidelberg 2012
Abstract:
The effects of real-time traffic information system (RTTIS) on traffic performance under parallel, grid and ring networks were investigated. The simulation results show that the effects of the proportion of RTTIS usage depend on the road network structures. For traffic on a parallel network, the performance of groups with and without RTTIS level is improved when the proportion of vehicles using RTTIS is greater than 0 and less than 30%, and a proportion of RTTIS usage higher than 90% would actually deteriorate the performance. For both grid and ring networks, a higher proportion of RTTIS usage always improves the performance of groups with and without RTTIS. For all three network structures, vehicles without RTTIS benefit from some proportion of RTTIS usage in a system.
Key words:
real-time traffic information; traffic network; traffic efficiency; optimization of urban traffic��
1 Introduction
With the advancement of information and communication technologies, it is now possible to deploy real-time traffic information (RTTI) widely to individual drivers through real-time traffic information systems (RTTIS) equipped on vehicles. RTTIS collects real-time traffic situation data, performs timely analyses on the data and disseminates traffic information to the public regarding road closure, traffic flow and weather condition that affect roadways or road conditions [1-2]. A fundamental question about the effectiveness of RTTIS is whether a high proportion of vehicles equipped with RTTIS would indeed lead to the performance improvement for both groups with and without RTTIS.
One of the challenges of providing an answer to the question stated above lies in the fact that traffic systems tend to exhibit emergent behaviors that are the results of the interactions between individual vehicles. Furthermore, these behaviors may also depend on the underlying transportation network structure in question. These emergent behaviors are hard to capture through traditional analysis approaches using some combinations of mathematical formulations and/or macro-simulations [3]. In this work, a micro-simulation approach is used to investigate the effects of RTTIS on the performance of groups with and without RTTIS under different network structures, i.e. parallel, grid and ring networks. This work differs from previous studies in three aspects: 1) three network structures, instead of only one, were used; 2) the performances of both groups with and without RTTIS were investigated; 3) how different proportions of vehicles equipped with RTTIS would affect the performances was examined in detail.
As of this writing, most studies support the position that providing RTTI to drivers can improve traffic efficiency. However, it is not clear as to what percentage of travelers would experience improved travel time and what proportion would not, or whether drivers equipped with RTTIS would really benefit from RTTI. In previous studies, ARNOTT et al [4] found that RTTIS benefits individual drivers but makes the whole traffic system less efficient. However, CHORUS et al [5-6] concluded that RTTIS can improve the efficiency of both individual travelers and the efficiency of a traffic system as a whole.
ABDALLA and ABDEL-ATY [7] suggested that drivers can save up to 44.7% of their travel time when RTTIS provides high level traffic information, i.e., pre-trip and en-route traffic information as well as travel advice. DAVIS [8] found that when a traffic system with simple RTTI cannot achieve Wardrop equilibrium, one with a driver-advice RTTIS (i.e., RTTIS that can provide a fair indicator regarding which route to choose) can help a traffic system to achieve approximate Wardrop equilibrium. A Wardrop equilibrium is a desired traffic situation where the travel time on different paths is the same, indicating an overall traffic efficiency.
Moreover, results from previous studies suggest that different drivers benefit differently from a RTTIS. BEN-ELIA et al [9] found that travel efficiency is improved more for drivers who lack long-term experience on the distribution of travel time on different routes in different traffic scenarios. ZIEGELMEYER et al [10] reported that drivers who used RTTIS arrived at their destinations during a wide time range. These authors suggest that the reason for this wide time range is that these drivers try not to make trips at the same time in order to avoid traffic congestion. SELTON et al [11] linked the effectiveness of RTTIS to the drivers�� approaches in response to traffic information. Their results suggest that drivers who take a contrarian approach to RTTI benefit more than those who respond to information from RTTIS directly. This result echoes the findings from ABDALLA and ABDEL-ATY [7], re-emphasizing the importance of making proactive travel and route choice decisions using information from RTTIS.
Is there a guiding ��magic number�� as to the proportion of drivers that should be provided with RTTIS? JAYAKRISHNAN et al [12] concluded that the performance of a traffic system is improved continuously as the proportion of drivers equipped with ATIS increases up to 50%, beyond which the effect of RTTIS decreases. Similarly, STERN et al [13] suggested that providing RTTI to some of the drivers will lead to higher efficiency than providing RTTI to all drivers.
Furthermore, many researchers observed traffic flow oscillation in their experiments and attempted to explain the cause of it. BEN-AKIVA and de PALMA [14] observed that if too many drivers respond to the same traffic information, new traffic congestion will be introduced on alternative routes. Similarly, STERN et al [13] stated that providing traffic information to drivers could improve the performance of a transportation system, but it could also create new congestions on alternate routes. SELTEN et al [11] attributed the failure to converge of their traffic simulation to traffic fluctuation (oscillation). WAHLE et al [15] found that vehicle flow oscillation appeared when drivers were equipped with RTTIS.
A significant limitation in previous studies using a micro-simulation approach is that these studies only used one type of networks, either a parallel network or a real road network from a specific area. It is not clear whether findings from these studies can be extended to other types of networks. In this work, three types of network, parallel, grid and ring networks, are used in the micro-simulation. Specifically, this work focuses on answering three questions: 1) Would a higher proportion of RTTIS usage improve both the performance of groups with and without RTTIS for all network structures? 2) Would the adoption of RTTIS improve the travel speed of individual drivers? 3) How would a higher proportion of RTTIS usage in a traffic system affect the travel speed of vehicles without a RTTIS? Answers to these questions help further understanding about the effects of RTTIS on the performance of a transportation system as a whole and the benefits of RTTIS for groups with and without RTTIS.
2 Methods
2.1 Overview
A microscopic simulation approach was used to provide answers to the three specific research questions stated above. Five rounds of simulations were conducted based on combinations of different proportions of vehicles using RTTIS in a traffic system and three different network structures i.e. parallel, grid and ring networks, using the VISSIM traffic simulation package (17). Results are reported using the average of these five rounds of simulations.
2.2 Road networks
The three types of networks are shown in Fig. 1. The parallel network contains 16 road segments with an origin and a destination at both ends of the network (Fig. 1(a)). The parallel network is symmetric and thus the length of the corresponding road segments from left to right along both the top and bottom routes are the same, and they are 800, 200, 200, 200, 100, 100, 200, 100, 100, 200, 100, 100, 200, 200, 200 and 800 m in length, respectively.
The grid network has five road segments in the east-west direction and five in the north-south direction (Fig. 1(b)). These road segments are two-way roads with two lanes in each direction. Each road segment between two adjacent intersections is 800 m long. Each zone is enclosed by four road segments and four intersections. There are two entrances and two exits for each zone, and the entrances and exits are denoted by the arrows. Each zone has an equal chance of being an origin or a destination in the simulations.
The third network is a ring network (Fig. 1(c)), in which every road has the same width and the same number of lanes as in the grid network. Similar to the grid network, the four roads and four adjacent intersections in the ring network enclose a zone. Each zone has two entrances and two exits denoted by arrows. The outer ring forms a circle with a radius of 1.5 km.
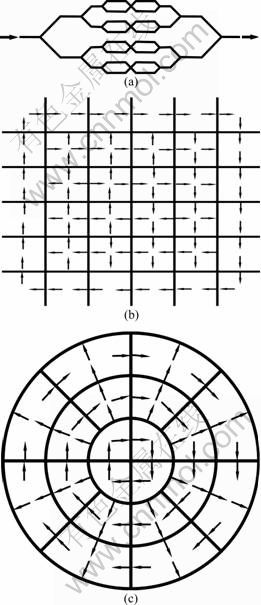
Fig. 1 Networks used in present work: (a) Parallel network; (b) Grid network; (c) Ring network
2.3 Traffic model
The VISSIM microscopic simulation software can be used to support simulations involving different types of road networks, traffic control signals, transportation modes (i.e., car, truck, bus and bike) and different configurations of trip origins and destinations. For all three types of networks in this work, symmetrical origin-destination (OD) matrices are constructed. Traffic flows between any OD pair are set to be constant. The parallel network has only one OD pair.
All vehicles are divided into two categories: those equipped with RTTIS and those without. The proportions of vehicles using RTTIS in an entire traffic system is controlled, and eleven different proportions (0, 10%, 20%, 30%, 40%, 50%, 60%, 70%, 80%, 90% and 100%) are used in the simulations. It is assumed that when a vehicle is equipped with RTTIS, the RTTIS is used for the entire trip to obtain both pre-trip and en-route information.
A method of successive averages (MSA) is applied to simulate the learning curve of drivers to use RTTIS for making travel decisions. During a simulation, the travel time of a vehicle along each section of a route in each iteration of a simulation is recorded. When there is congestion, the waiting time of vehicle is also recorded during the simulation. It is assumed that all vehicles entering a traffic system follow a route selected from a pool of ��best routes�� using a Logit utility function based on the travel information available to the driver in question.
In VISSIM, it is assumed that a driver chooses a route from a set of ��best routes�� when making a route choice decision. A best route is the one that has the least travel time from a given origin to a specific destination based on the distance of the OD pair in question and the traffic conditions on the network at a given time. The best routes are identified through iterations and are stored in a path file. Since traffic situations change as a simulation progresses, many different ��best routes�� are generated and recorded. These best routes form a pool from which a driver can select before they start a new trip. For the very first iteration of a simulation, there is no travel time information for each road segment, so the initial cost associated with a route is measured by the cumulative lengths of all road segments along that route.
In VISSIM, a route is assessed by a utility function:
![]() (1)
(1)
where Uj is the utility of route j; Cj indicates the general cost of route j.
The route choice model is a Logit function:
 (2)
(2)
where p(Rj) represents the probability of choosing route j; ![]() is the utility of route j; k is the sensitivity of the model.
is the utility of route j; k is the sensitivity of the model.
MSA is used to simulate a driver��s learning process of making a travel decision based on the formula given below:
![]() (3)
(3)
where d is the index of the iteration within a simulation; n is the total number of iterations to be conducted; N is a user-defined parameter; i indicates a road segment; ![]() is the observed travel time on road segment i for iteration d; Tin,d is the expected travel time on road segment i for iteration d; 1/(N+n) is a smoothing factor.
is the observed travel time on road segment i for iteration d; Tin,d is the expected travel time on road segment i for iteration d; 1/(N+n) is a smoothing factor.
2.4 Indicators used for traffic efficiency evaluation
Traffic efficiency is measured by a number of indicators. These indicators are: average delay, standard deviation of average delay, average queue length at intersections, average speed of all vehicles, average number of stops for all vehicles, and average delay per stop. Average delay indicates the average delay measured for all vehicles at all intersections in the entire traffic system in question. The standard deviation of average delay reflects the variation of traffic situation throughout a road network. Average queue length at intersections is used to estimate the situation of traffic congestion on a network based on the length of vehicles standing in traffic. The names of other indicators are self explanatory. Since the distance between the OD pair in the parallel network is very short, the number of vehicles passing through the parallel network in a unit time is used to measure the level of congestion in a parallel network.
3 Simulation results and summary of findings
3.1 Parallel networks
A higher proportion of RTTIS usage does not necessarily always bring significant benefits to groups with and without RTTIS in a parallel network. Figure 2 illustrates the average delay for traffic in the parallel network at different proportions of the travel agents with RTTIS. The overall traffic delay is greatly reduced when 10% of the vehicles use RTTIS. When the RTTIS adoption rate is higher than 10%, the traffic delay shows an increasing trend which is smooth before 60%. It is important to note that, when 60% or more travel agents use RTTIS, the average delay increases quickly with the proportion increasing and is longer than that with no RTTIS service.
For traffic efficiency in the parallel network, several observations can be made from the simulation results. Firstly, a 100% vehicle usage of RTTIS actually has the worst system level performance as measured by the number of vehicles passing through the network during a unit of time interval. It is 71% worse than the best performance when the proportion of RTTIS usage is 10%. Secondly, equipping a vehicle with RTTIS does not seem to bring much benefit to significant individual drivers in term of gaining high travel speed and avoiding any delays, because the best level of performance for vehicles with RTTIS is at the proportion of 10% RTTIS usage (Table 1). Thirdly, the performance for vehicles without RTTIS, as measured by average speed, the delay per vehicle, the delay per stop, and stop time per vehicle, changes smoothly when the proportion of RTTIS usage increases from 10% to 30%, but this performance can not be improved beyond the 30% adoption rate. Based on these observations, it is reasonable to suggest that higher proportion (>30%) of RTTIS usage for vehicles in a parallel network does not necessarily lead to better performance for both groups with and without RTTIS.
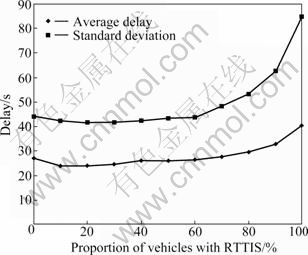
Fig. 2 Relationship between proportions of vehicles equipped with RTTIS and average delays in parallel network
Table 1 Relative vehicle performances in parallel network

3.2 Grid networks
A higher proportion of RTTIS usage improves the performance of both groups with and without RTTIS in grid networks. Figure 3 illustrates the change of average delay in the grid network as the proportion of vehicles with RTTIS increases. As more vehicles in the system are equipped with RTTIS, both the average delay of traffic and its standard deviation decrease. They decrease by 33% and 37%, respectively, from the highest point to the lowest point. However, when more than 50% of the vehicles are equipped with RTTIS, both the average delay and the standard deviation tend to stay stable.
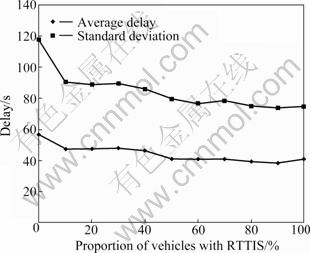
Fig. 3 Relationship between proportions of vehicles equipped with RTTIS and average delays in grid networks
To measure performance in the grid network, results similar to those reported in Table 1 are obtained. At the system level in a grid network, if system performance is measured by the queue length of vehicles standing in traffic, then the proportion of vehicles with RTTIS corresponding to the best performance of a traffic system is 90%. In general, as the proportion of vehicles equipped with RTTIS increases, the average speed for both groups of vehicles with and without RTTIS in a grid network is improved. Moreover, as more and more vehicles are equipped with RTTIS, indicators such as average delay, average number of stops, and average delay per stop continue to improve for both groups of vehicles. In addition, improvements of these indicators for vehicles without RTTIS are larger than those for the vehicles with RTTIS. Therefore, the difference in the performance between vehicles with and without RTTIS becomes smaller as more and more vehicles are equipped with RTTIS. These two groups of vehicles show similar levels of performance when the proportion of vehicles equipped with RTTIS reaches 90%. These observations suggest that providing RTTIS can improve the performance of both groups with and without RTTIS in the grid network.
3.3 Ring networks
Similar to the grid network, a higher proportion of RTTIS usage leads to improved performance of both groups with and without RTTIS in the ring networks. Figure 4 shows the dynamics of average traffic delay when different proportions of the vehicles in the ring network are equipped with RTTIS. Similar to the grid network, the overall traffic system performance is improved as more vehicles are equipped with RTTIS. When more than 60% of the vehicles are equipped with RTTIS, the change of average delay becomes trivial. The average delay decreases by 40% from the highest point to the lowest point, which is 25% more than that in the parallel network and 7% more than that in the grid network. This implies that RTTIS can improve traffic efficiency to the greatest degree for the ring network.

Fig. 4 Relationship between proportions of vehicles equipped with RTTIS and average delays in ring networks
Similar to the results of the grid network, when the average queue length of traffic is used to measure the system level performance, the proportion of RTTIS usage corresponding to the best system level performance is 90%. System level indicators such as average delay, average number of stops, and average delay per stop continue to improve for both groups of vehicles with and without RTTIS as the proportion of vehicles equipped with RTTIS becomes higher. At the individual vehicle level, vehicles without RTTIS can travel 50% faster when the proportion of vehicles with RTTIS increases from 0 to 90%. Again, simulation results suggest that a higher proportion of vehicles with RTTIS improves the performance of both the group with RTTIS and the group without RTTIS in ring networks.
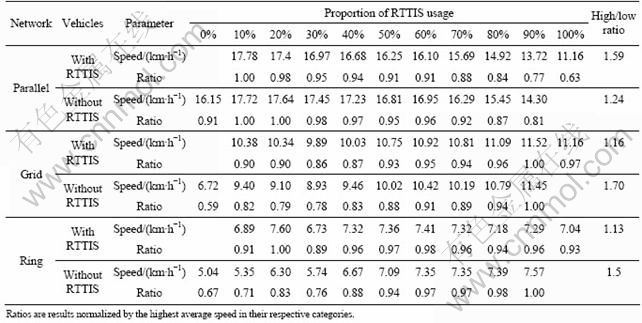
3.4 Vehicle performance under different network structures
Table 2 summarizes the performances of individual vehicles in different network structures based on average travel speed. The higher the average travel speed is, the better the performance of individual vehicles is. Two observations can be made based on the results shown in Table 2. Firstly, a proportion of RTTIS usage higher than 30% in parallel networks does not give significant improvement in average vehicle speed for both groups of vehicles with and without RTTIS, but for grid and ring networks, the trend is opposite. Secondly, vehicles without RTTIS benefit from a higher proportion of RTTIS usage in all network structures, particularly for grid and ring networks when the proportion of vehicles with RTTIS changes from 0 to 90%. The average travel speed of vehicles without RTTIS increases by 70% in a grid network and 50% in a ring network. But the improvement in average travel speed of vehicles with RTTIS is not significant based on the ratios of highest to lowest average speed in the grid and ring networks. The ratios are less than 20% across the range of different proportions of RTTIS usage (Table 2).
Table 2 Relative vehicle performance in different network structures
4 Conclusions
1) The performance of both groups with and without RTTIS can be improved when a proportion of vehicles are equipped with real-time traffic information systems, but the effects of the proportion of RTTIS usage depend on road network structures.
2) For traffic in a parallel network, the performance of both individual vehicles and traffic at the system level is improved when the proportion of vehicles using RTTIS is less than 30%. A proportion of RTTIS usage higher than 90% gives the worst performance for both the system and individual drivers.
3) For both the grid and ring networks, a higher proportion of RTTIS usage improves the performance of both groups with and without RTTIS.
4) For all three network structures, vehicles without RTTIS benefit from some proportion of RTTIS usage by vehicles in the traffic system. This is particularly true for grid and ring networks where the performance of vehicles without RTTIS is always improved when a higher proportion of vehicles use RTTIS.
Acknowledgments
Simulations reported in this article were completed while the first author was a visiting doctoral student at the Texas Center for Geographic Information Science in the Department of Geography at Texas State University-San Marcos under the supervision of F. Benjamin Zhan.
References
[1] WISE D J. Surface transportation: Efforts to address highway congestion through real-time traffic information systems are expanding but face implementation challenges [M]. Darby: DIANE Publishing, 2010: 55-90.
[2] LIU T I, HUANG H J, TIAN L J. Microscopic simulation of multi-lane traffic under dynamic tolling and information feedback [J]. Journal of Central South University of Technology, 2009, 16(5): 865-870.
[3] CHEN X, ZHAN F B. Agent-based modelling and simulation of urban evacuation: Relative effectiveness of simultaneous and staged evacuation strategies [J]. J Oper Res Soc, 2008, 59(1): 25-33.
[4] ARNOTT R, de PALMA A, LINDSEY R. Does providing information to drivers reduce traffic congestion? [J]. Transport Res A-Pol, 1991, 25(5): 309-318.
[5] CHORUS C G, MOLIN E J E, van WEE B. Use and effects of advanced traveller information services (ATIS): A review of the literature [J]. Transport Rev, 2006, 26(2): 127-149.
[6] CHORUS C, MOLIN E, van WEE B. Travel information as an instrument to change car drivers travel choices [J]. EJTIR, 2006, 6(4): 335-364.
[7] ABDALLA M, ABDEL-ATY M. Modeling travel time under atis using mixed linear models [J]. Transportation, 2006, 33(1): 63-82.
[8] DAVIS L. Realizing Wardrop equilibria with real-time traffic information [J]. Physica A, 2009, 388(20): 4459-4474.
[9] BEN-ELIA E, EREV I, SHIFTAN Y. The combined effect of information and experience on drivers�� route-choice behavior [J]. Transportation, 2008, 35(2): 165-177.
[10] ZIEGELMEYER A, KOESSLER F, MY K, DENANT-BOEMONT L. Road Traffic Congestion and Public Information: An Experimental Investigation [J]. J Transp Econ Policy, 2008, 42(1): 43-82.
[11] SELTEN R, CHMURA T, PITZ T, KUBE S, SCHRECKENBERG M. Commuters route choice behaviour [J]. Game Econ Behav, 2007, 58(2): 394-406.
[12] JAYAKRISHNAN R, MCNALLY M, COHEN M. Simulation of advanced traveller information systems (ATIS) strategies to reduce non-recurring congestion from special events [M]. Irvine: University of California, 1993: 5-22.
[13] STERN E, ZILA S S, ZOAR S, EINAR H. Congestion-related information and road network performance [J]. J Transport Geogr, 1996, 4(3): 169-178.
[14] BEN-AKIVA M, de PALMA A. Dynamic network models and driver information systems [J]. Transport Res A-Pol, 1991, 25(5): 251-266.
[15] WAHLE J, BAZZAN A, KL GL F, SCHRECKENBERG M. The impact of real-time information in a two-route scenario using agent-based simulation [J]. Transport Res C-Emer, 2002, 10(5/6): 399-417.
(Edited by HE Yun-bin)
Received date: 2011-07-18; Accepted date: 2011-09-26
Corresponding author: LU Yong-mei; Tel: +86-18674863096; E-mail: rocket1028@gmail.com
Abstract: The effects of real-time traffic information system (RTTIS) on traffic performance under parallel, grid and ring networks were investigated. The simulation results show that the effects of the proportion of RTTIS usage depend on the road network structures. For traffic on a parallel network, the performance of groups with and without RTTIS level is improved when the proportion of vehicles using RTTIS is greater than 0 and less than 30%, and a proportion of RTTIS usage higher than 90% would actually deteriorate the performance. For both grid and ring networks, a higher proportion of RTTIS usage always improves the performance of groups with and without RTTIS. For all three network structures, vehicles without RTTIS benefit from some proportion of RTTIS usage in a system.
