
Trans. Nonferrous Met. Soc. China 23(2013) 2776-2780
A new method of testing frother performance
Yan-ling GU, Qi-ming FENG, Le-ming OU, Pei-chao 
School of Mineral Processing and Bioengineering, Central South University, Changsha 410083, China
Received 16 July 2012; accepted 5 December 2012
Abstract:
A new method of testing frother performance was proposed. Four parameters were tested: maximum foam volume, foam half-life, gas-liquid ratio and mean foam rise velocity. Among them the former two parameters indicate frother��s foaming ability and foam stability respectively, and the latter two indicate water carrying ability and foam viscosity, respectively. The performance of four frothers in a two-phase (solution-air) system was tested and batch flotation tests on a copper ore were carried out. By analyzing frother performance in a two-phase system and comparing with the flotation results, correlation between them was found. Higher-copper concentrate grade was obtained by frothers with weak water carrying ability and low foam viscosity. And frothers with strong foaming ability and stable foam tend to obtain higher copper recovery.
Key words:
flotation; frother; foam performance; copper ore;
1 Introduction
Froth flotation is a separation process widely used in mining industry and froth phase is of crucial importance since it can affect both recovery and grade through selective drainage of minerals back to the pulp phase [1-3]. Frothers are surface-active agents widely used in flotation to aid generation of small bubbles [4,5] and therefore the efficiency of separation is strongly dependent on frother performance [3,6,7].
Over the past decades, researchers have developed many techniques to test and evaluate frother performance. These techniques can be classified as traditional and modern methods. The traditional methods include airflow method, also advanced Bikerman method [8], Ross-Miles method [9], Waring-Blender method [10], etc. The modern methods include near-infrared scanner method [11], conductivity method [12], confocal microscopy method [13], resistance strengthening technology [14], etc. Many of these methods have found applications in enhanced oil recovery (EOR), chemical industry, food processing, etc [15]. However, many of these methods are not appropriate for flotation frothers and the test results are often not practical. As for the currently available methods, the traditional methods are generally intuitive, simple and convenient, but the results are not accurate. In addition the traditional methods only focus on frothers�� foaming ability and foam stability, but neglect other important foam properties. Though the modern methods have higher accuracy, limitations also exist due to their complicated device, high test cost, incomplete information, etc. Above all, the modern techniques often need some time to prepare testing sample before measurement. As many flotation frothers produce foams which exist only several seconds, it is impossible to test their foam performance by modern methods.
Therefore, the selection of a suitable frother for a given mineral flotation so far can only be made after batch test work [16] and it is timely to develop a feasible and effective method to test frother performance. Based on classical Bikerman method, besides foam volume and foam half-life, another two parameters, gas-liquid ratio and mean foam rise velocity, were measured, thus making the test results more accurate and credible. Most importantly, four parameters tested can be related to flotation performance (grade and recovery), providing a possibility of predicting frother performance in three- phase (slurry-air) system.
2 Experimental
2.1 Experimental setup
Test setup consisted of five parts: nitrogen gas cylinder, reducing valve, buffer container, gas flowmeter and foam tester. The five parts were connected by hoses. In order to measure gas-liquid ratio and mean foam rise velocity, the traditional foam tester used in Bikerman method was retrofitted into a graduated cylinder with two reverse graduations, as shown in Fig. 1.
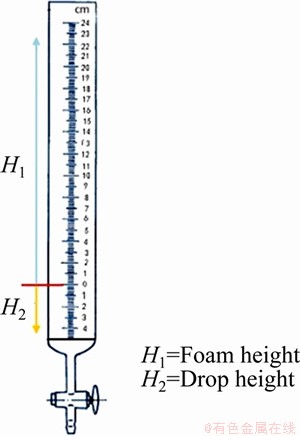
Fig. 1 Foam tester
Nitrogen, due to its stable chemical properties and extremely low water solubility, was reported to make frother produce foam with high strength and stability in a wide range of concentration [17], and thus it was chosen as gas source in this test. Reducing valve connected with nitrogen gas cylinder helps to reduce gas pressure to be desirable for test. Buffer container kept nitrogen flow constant and gas flowmeter measured gas flow rate.
Foam tester was the dominant part of this setup and it was a graduated cylinder with a porous filter plate on its base. When the test solution of 50 mL was added in it, liquid level just reached zero graduation, i.e. the horizontal line shown in Fig. 1. Nitrogen passes through the filter plate and then foam would be produced in the graduated cylinder and the foam height would reach H1. Meanwhile, the liquid level would drop from zero graduation to some height H2. The volume and graduation of this foam tester could be changed if necessary.
2.2 Test method
Illustration of the test procedures is shown in Fig. 2. Firstly, adjust reducing valve to make nitrogen flow of 500 mL/min and keep this flow velocity constant in all tests. Then, pour test solution into graduated cylinder and begin nitrogen aerating. When the maximum foam height was reached, H1, H2 and aeration time t were recorded. Then aerating was stopped and down time was recorded as foam height to reduce from the maximum height to its half (t1/2). Nitrogen aerating must begin as soon as test solution is poured into graduated cylinder because it takes 7-8 s for water to pass through the microporous filter plate.
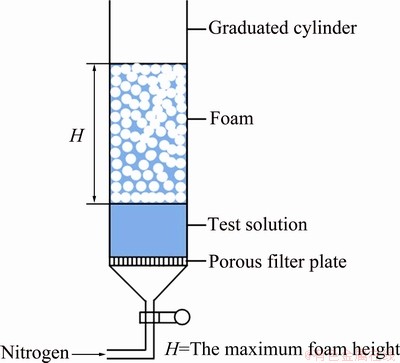
Fig. 2 Illustration of test procedures
Before tests, aqueous frother solutions with concentrations of 0.1, 0.2, 0.4, 0.6, 0.8, 1.0 g/L were prepared with distilled water and foam tester was rinsed thoroughly with test solution three times. For insoluble frothers, 1 min of ultrasonic dispersion was needed before tests.
Tests were carried out at room temperature ((25��2) ��C) from a low concentration solution to high concentration solution for one frother, and before another frother solution test, the foam tester must be washed with distilled water. Each test solution was tested four times and their arithmetic mean value was used.
Based on the above measurement results, the following parameters can be obtained, characterizing frother performance in a two-phase system:
1) The maximum foam height H, H=H1+H2.
2) The maximum foam volume Vmax. As the inner diameter of graduated cylinder is 37 mm and H is known, the maximum foam volume (Vmax) can be calculated, which indicates the frother��s foaming ability. Larger volume demonstrates stronger foaming ability.
3) Foam half-life t1/2. It indicates the foam stability, i.e. foam life. Longer half-life demonstrates more stable foam.
4) Gas-liquid ratio G/L. It refers to the volume ratio of gas to liquid in foam system. G/L=gas volume/ volume of consumed liquid. Volume of the consumed liquid is the product of cylinder cross-section (S) and descent height of liquid level (H2), so G/L= [(H1+H2)S- H2S]/H2S, i.e. H1/H2. Smaller gas-liquid ratio demonstrates stronger water carrying ability.
5) Mean foam rise velocity u. It is defined as the maximum foam height (H) divided by aeration time (t). Greater mean foam rise velocity demonstrates lower foam viscosity.
2.3 Reagents and samples
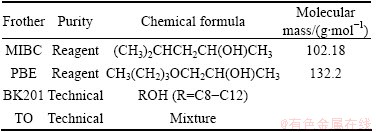
Performance of four commonly used flotation frothers were tested: methyl isobutyl carbinol (MIBC), propanediol butyl ether (PBE), BK201, terpenic oil (TO). All frothers were provided by Zhuzhou Flotation Reagents Factory, China. Some properties of the tested frothers are shown in Table 1.
Table 1 List of tested frothers
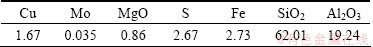
Copper ore sample used in flotation tests was obtained from Manzhouli, China. The Chemical composition of the ore is shown in Table 2.
Table 2 Main chemical composition of copper ore (mass fraction, %)
2.4 Flotation procedures
Before flotation tests, a sample of 500 g and lime of 1 g were milled in a laboratory stainless ball mill at 62.5% solids to achieve a grind of 81% passing 74 ��m and make pH of the pulp at the beginning of the flotation 7.8. The milled slurry was transferred to flotation cell and diluted to 20% solids content. The impeller speed was set at 1700 r/min and the air supply to the flotation cell was maintained at a flow rate of 2 L/min in all tests. The pulp level was kept at the same level by addition of water. Reagent addition strategy and flotation procedures are shown in Fig. 3. After tests, feeds, concentrates and tails were filtered, dried, weighed and analyzed for Cu content.
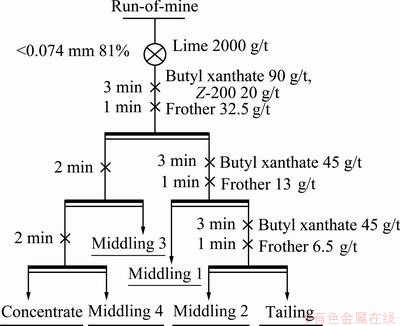
Fig. 3 Flotation flowsheet of copper ore
3 Results and discussion
3.1 Frother performance in two-phase system
Performance of the four frothers was tested by this novel method. Figures 4 and 5 show the maximum foam volume and foam half-life as a function of frother concentration, respectively. Generally speaking, foam volume indicates frother��s foaming ability and foam half-life foam stability, thus they are often considered the criterion to evaluate frother performance. As shown in Figs. 4 and 5, both the maximum foam volume and foam half-life increase as the frother concentration increases; however, the increment differs for various frothers. Figure 4 shows that when the concentration is greater than 0.4 g/L, the maximum foam volumes of BK201 and TO increase slowly while those of PBE and MIBC increase significantly. Comparing Figs. 4 and 5, it can be seen that the maximum foam volume and foam half-life exhibit similar change trends with concentration of frother. As shown in Fig.6, the maximum foam volume is positively and almost linearly correlated with the foam half-life. The above mentioned test results and conclusions are in agreement with that in Ref. [8,18].
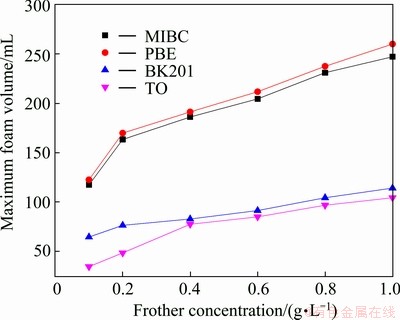
Fig. 4 Maximum foam volume as function of frother concentration
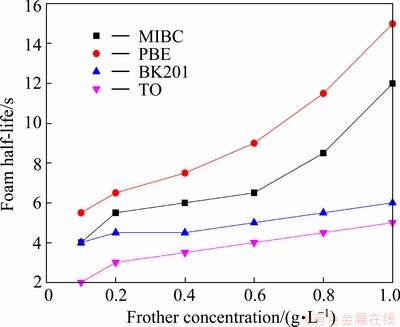
Fig. 5 Foam half-life as function of frother concentration
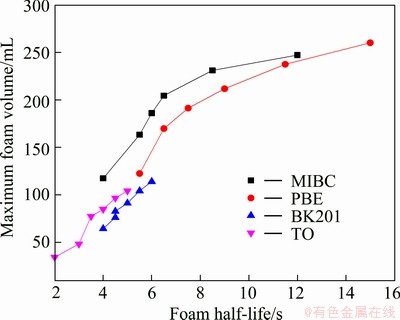
Fig. 6 Relation between maximum foam volume and foam half-life
Figures 7 and 8 show gas-liquid ratio and mean foam rise velocity as a function of frother concentration. Slight decrease of gas-liquid ratio and mean foam rise velocity can be seen in the two figures, indicating that with the increase of concentration, frothers�� water carrying ability becomes stronger and foam viscosity becomes greater. Nevertheless, when the concentration is greater than a certain value, frothers�� water carrying ability and foam viscosity will keep constant or increase little despite the increase of concentration. And this certain value differs for various frothers due to their diverse physical and chemical properties and molecular structures. Taking MIBC and TO as an example, Fig. 7 shows that when the concentration of MIBC is greater than 0.4 g/L, its gas-liquid ratio reaches an equilibrium while that of TO keeps decreasing. And Fig. 8 shows that the mean foam rise velocity of TO reaches an equilibrium at the highest concentration among the four frothers, which may be ascribed to the fact that the saturated adsorption concentration of TO on air-water interface is greater [19]. Saturated adsorption concentration here refers to a situation where frother molecules adsorbing on air-water interface are packed so closely that few molecules can be adsorbed on the interface again. For TO, its active constituent is terpenol whose benzene ring is surrounded by four carbon atoms and the hybridization type of the four carton atoms is sp3 which weakens the steric hindrance effect and increases its flexibility. As a result, some attraction and space will exist between its non-polar groups, thus making it adsorb more closely on air-water interface [20]. Therefore, its water carrying ability and foam viscosity reach an equilibrium at higher concentration. However, these findings are just a preliminary understanding of the complicated foam system; much more work should be carried out.
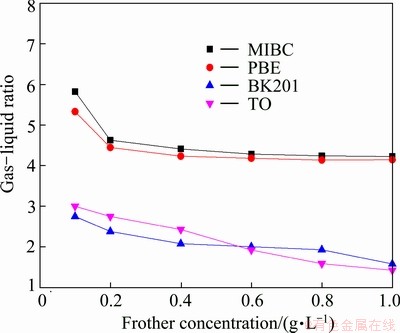
Fig. 7 Gas-liquid ratio as function of frother concentration
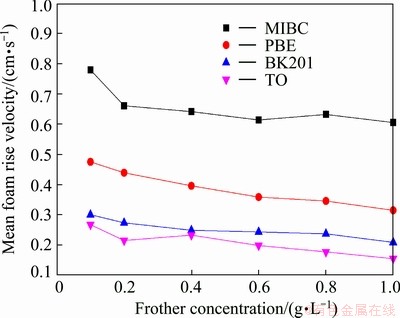
Fig. 8 Mean foam rise velocity as function of frother concentration
3.2 Flotation results
All flotation tests were carried out under the same condition. Influence of frother type on copper grade and recovery is shown in Fig. 9. Reagent addition strategy in this test is proved appropriate as copper concentrate grade and recovery is considerably high. As shown in Fig. 9, copper concentrate grade and recovery obtained by various frothers differ from each other, demonstrating that frothers affect not only concentrate grade but also recovery. Comparing frother performance in a two-phase system with flotation results, correlation between them was found. Figure 9 shows that copper recovery obtained by PBE or MIBC is higher than that by BK201 or TO. It can be seen from Fig. 4 and Fig. 5 that foaming ability and foam stability of PBE and MIBC are more satisfactory than those of BK201 and TO. Therefore, frothers with strong foaming ability and good foam stability tend to obtain higher metal recovery [16]. Figure 9 shows that copper concentrate grade obtained by MIBC or PBE is higher than that by BK201 or TO. It can be seen from Figs. 7 and 8 that MIBC and PBE possess weaker water carrying ability and lower foam viscosity than BK201 and TO. Thus frothers with weak water carrying ability and low foam viscosity are very likely to obtain higher metal grade, which is attributed to low entrainment.
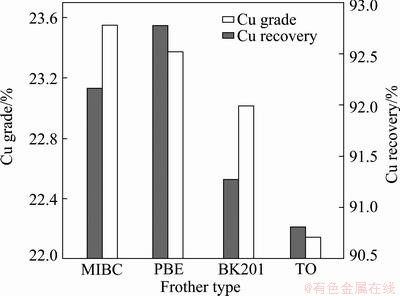
Fig. 9 Copper grade and recovery obtained by various frothers
4 Conclusions
1) A novel method of testing frother performance in a two-phase system is developed by retrofitting the traditional foam tester employed in classical Bikerman method into a graduated cylinder with two reverse graduations.
2) Frothers with strong foaming ability and good foam stability tend to obtain high metal recovery; Frothers with weak water carrying ability and low foam viscosity are very likely to obtain high metal grade.
References
[1] ROSS E V. Particle-bubble attachment in flotation froths [J]. Minerals Engineering, 1997, 10(7): 695-706.
[2] LYNCH A J, JOHNSON N W, MANLAPIG E V, ALEXANDER J P. Developments in mineral processing�C�CMineral and coal flotation circuits [M]. New York: Elsevier Scientific Publishing Co., 1981, 4: 487-492.
[3] SAEED F. The significance of froth stability in mineral flotation��A review [J]. Advances in Colloid and Interface Science, 2011, 166: 1-7.
[4] KRACHT W, FINCH J A. Effect of frother on initial bubble shape and velocity [J]. International Journal of Mineral Processing, 2010, 94: 115-120.
[5] JAMES A F, NESSET J E, CLAUDIO A. Role of frother on bubble production and behaviour in flotation [J]. Minerals Engineering, 2008, 21: 949-957.
[6] MELO F, LASKOWSKI J S. Fundamental properties of flotation frothers and their effect on flotation [J]. Minerals Engineering, 2006, 19: 766-773.
[7] FINCH J A, GELINAS S, MOYO P. Frother-related research at McGill University [J]. Minerals Engineering, 2006, 19: 726-733.
[8] XU Zhen-hong��ZHU Jian-hua��ZHANG Rong-zeng��Study on evaluation method of flotation frother��s froth stability [J]��Journal of Chemical Industry and Engineering, 1999, 50(3): 399-403. (in Chinese)
[9] WANG Jun-zhi. Evaluation of foam agents [J]. Advances in Fine Pertrochemicals, 2006, 7(3): 17-20. (in Chinese)
[10] WANG Chen-wen, WANG Rui-he, CHEN E-ding. Synthesis and properties of novel alkyl glyceryl ether sulfonate with thermal stability and brine tolerance [J]. Journal of China University of Petroleum, 2008, 32(4): 55-59. (in Chinese)
[11] ZHANG Rui, WANG Rui-he, QIU Zheng-song. Stability evaluation of foam drilling fluid using light backscattering theory [J]. Acta Petrolei Sinica, 2005, 26(1): 105-108. (in Chinese)
[12] YAN Yong-li, ZHANG Ning-sheng, QU Chen-tun. Study on formation and stability of colloidal liquid aphrons [J]. Acta Chimica Sinica, 2006, 64(1): 54-60. (in Chinese)
[13] KOEHLER S A, HILGENFELDT S, WEEKS E R, STONE H A. Foam drainage on the microscale II. Imaging flow through single plateau borders [J]. Journal of Colloid and Interface Science, 2004, 276(2): 439-449.
[14] BARIGOU M, DESHPANDE N S, WIGGERS F N. An enhanced electrical resistance technique for foam drainage measurement [J]. Journal of Colloid and Interface Science, 2001, 189(1): 237-246.
[15] WANG Li-juan, ZHANG Gao-yong, DONG Jin-feng, ZHOU Xiao-mei, HONG Xin-lin. Progress in test and evaluation methods for foaming performance [J]. China Surfactant Detergent & Cosmetics, 2005(3): 171-173, 191. (in Chinese)
[16] XIA Y K, PENG F F. Selection of frothers from residual organic reagents for copper-molybdenite sulfide flotation [J]. International Journal of Mineral Processing, 2007, 83: 68-75.
[17] HUANG Min. The study on property evaluation and injection improvement for foam system [D]. Daqing: Daqing Petroleum Institute, 2009: 15-16. (in Chinese)
[18] WIESE J G, HARRIS P J, BRADSHAW D J. The effect of increased frother dosage on froth stability at high depressant dosages [J]. Minerals Engineering, 2010, 23: 1010-1017.
[19] EKMEKA Z, BRADSHAW D J, ALLISON S A, HARRIS P J. Effects of frother type and froth height on the flotation behaviour of chromite in UG2 ore [J]. Minerals Engineering, 2003, 16(10): 941-949.
[20] ZHANG Ke, GUI Xia-hui, DING Qi-peng. Study on testing frother��s foaming performance by airflow method [J]. China Mining Magazine, 2009, 18(z): 94-99. (in Chinese).
һ���µIJ������ݼ����ܷ���
�����ᣬ��������ŷ���������泬
���ϴ�ѧ ��Դ�ӹ������﹤��ѧԺ����ɳ 410083
ժ Ҫ�����һ�ֲ������ݼ����ܵ��·�����������4�������������ĭ�������ĭ��˥�ڡ���-Һ���Լ���ĭƽ�����١����У�ǰ���������ֱ�������ݼ���������������ĭ�ȶ��ԣ������������ֱ�������ݼ���ЯҺ��������ĭ�ȡ�������4�����ݼ�����-Һ������ϵ�е����ܣ����Ҷ�ijͭ����и�ѡ���顣ͨ�������Ƚ�������ϵ���ݼ��������Լ���õĸ�ѡ����������������֮������ϵ��ЯҺ����������ĭ�ȵ͵����ݼ���õ�ͭ����Ʒλ�ϸߣ���������ǿ����ĭ�ȶ������ݼ���õ�ͭ�����ʽϸߡ�
�ؼ��ʣ���ѡ�����ݼ�����ĭ���ܣ�ͭ��
(Edited by Hua YANG)
Foundation item: Project (51174229) supported by the National Natural Science Foundation of China
Corresponding author: Qi-ming FENG; Tel: +86-731-88836817; E-mail: feng_309@csu.edu.cn
DOI: 10.1016/S1003-6326(13)62796-X
Abstract: A new method of testing frother performance was proposed. Four parameters were tested: maximum foam volume, foam half-life, gas-liquid ratio and mean foam rise velocity. Among them the former two parameters indicate frother��s foaming ability and foam stability respectively, and the latter two indicate water carrying ability and foam viscosity, respectively. The performance of four frothers in a two-phase (solution-air) system was tested and batch flotation tests on a copper ore were carried out. By analyzing frother performance in a two-phase system and comparing with the flotation results, correlation between them was found. Higher-copper concentrate grade was obtained by frothers with weak water carrying ability and low foam viscosity. And frothers with strong foaming ability and stable foam tend to obtain higher copper recovery.
